PostgreSQL integration for Grafana Cloud
PostgreSQL is a free and open-source relational database management system (RDBMS) emphasizing extensibility and SQL compliance.
This integration provides infrastructure-level observability: connections, replication, cache, locks, and table-level metrics. For query-level insights about slow queries, wait events, and execution plans, see Database Observability, Grafana’s dedicated product for database performance analysis.
This integration includes 19 useful alerts and 4 pre-built dashboards to help monitor and visualize PostgreSQL metrics and logs.
Before you begin
The PostgreSQL user is required to gather metrics. While you can use root user for testing, we strongly advise that you configure a separate user for Grafana Alloy, and give it only the strictly mandatory security privileges necessary for monitoring your node, as per the official documentation.
The provided Alloy configuration enables the following postgres_exporter collectors to support all dashboards and alerts:
database— per-database sizes and statisticslocks— lock counts by modelong_running_transactions— long-running transaction detectionpostmaster— server uptime via postmaster start timereplication— replication lag and slot statusstat_bgwriter— background writer and checkpoint activitystat_database— per-database throughput and cache statisticsstat_statements— query performance analysis (requirespg_stat_statementsextension)stat_user_tables— table-level vacuum, analyze, and bloat statisticsstatio_user_indexes— index block read/hit statistics
Query performance dashboard (stat_statements collector) requires the pg_stat_statements extension to be enabled in PostgreSQL:
-- In postgresql.conf:
shared_preload_libraries = 'pg_stat_statements'

-- After restarting PostgreSQL, run once per database:
CREATE EXTENSION IF NOT EXISTS pg_stat_statements;
The filtered metrics variant omits stat_statements to reduce cardinality when query analysis is not needed.
If you want to collect logs from your PostgreSQL nodes, please check the official documentation since it only writes logs to stderr by default.
Install PostgreSQL integration for Grafana Cloud
- In your Grafana Cloud stack, click Connections in the left-hand menu.
- Find PostgreSQL and click its tile to open the integration.
- Review the prerequisites in the Configuration Details tab and set up Grafana Alloy to send PostgreSQL metrics and logs to your Grafana Cloud instance.
- Click Install to add this integration’s pre-built dashboards and alerts to your Grafana Cloud instance, and you can start monitoring your PostgreSQL setup.
Configuration snippets for Grafana Alloy
Simple mode
These snippets are configured to scrape a single PostgreSQL node running locally with default ports.
Manually copy and append the following snippets into your Grafana Alloy configuration file.
Integrations snippets
prometheus.exporter.postgres "integrations_postgres_exporter" {
    data_source_names    = ["postgresql://localhost:5432/postgres"]
    enabled_collectors   = ["database", "locks", "long_running_transactions", "postmaster", "replication", "stat_bgwriter", "stat_database", "stat_statements", "stat_user_tables", "statio_user_indexes"]
}
discovery.relabel "integrations_postgres_exporter" {
    targets = prometheus.exporter.postgres.integrations_postgres_exporter.targets

    rule {
        target_label = "instance"
        replacement  = constants.hostname
    }
    rule {
        target_label = "job"
        replacement  = "integrations/postgres_exporter"
    }
}
prometheus.scrape "integrations_postgres_exporter" {
    targets    = discovery.relabel.integrations_postgres_exporter.output
    forward_to = [prometheus.remote_write.metrics_service.receiver]
    job_name   = "integrations/postgres_exporter"
}
Logs snippets
darwin
local.file_match "logs_integrations_postgres_exporter" {
    path_targets = [{
        __address__ = "localhost",
        __path__    = "/var/log/postgresql/postgres.log",
        instance    = constants.hostname,
        job         = "integrations/postgres_exporter",
    }]
}
loki.source.file "logs_integrations_postgres_exporter" {
    targets    = local.file_match.logs_integrations_postgres_exporter.targets
    forward_to = [loki.write.grafana_cloud_loki.receiver]
}
linux
local.file_match "logs_integrations_postgres_exporter" {
    path_targets = [{
        __address__ = "localhost",
        __path__    = "/var/log/postgresql/postgres.log",
        instance    = constants.hostname,
        job         = "integrations/postgres_exporter",
    }]
}
loki.source.file "logs_integrations_postgres_exporter" {
    targets    = local.file_match.logs_integrations_postgres_exporter.targets
    forward_to = [loki.write.grafana_cloud_loki.receiver]
}
windows
local.file_match "logs_integrations_postgres_exporter" {
    path_targets = [{
        __address__ = "localhost",
        __path__    = "C:\\Program Files\\PostgreSQL\\*\\data\\pg_log",
        instance    = constants.hostname,
        job         = "integrations/postgres_exporter",
    }]
}
loki.source.file "logs_integrations_postgres_exporter" {
    targets    = local.file_match.logs_integrations_postgres_exporter.targets
    forward_to = [loki.write.grafana_cloud_loki.receiver]
}
Advanced mode
To instruct Grafana Alloy to scrape your PostgreSQL nodes, go though the subsequent instructions.
The snippets provide examples to guide you through the configuration process.
First, manually copy and append the following snippets into your Grafana Alloy configuration file.
Then follow the instructions below to modify the necessary variables.
Advanced integrations snippets
prometheus.exporter.postgres "integrations_postgres_exporter" {
    data_source_names    = ["postgresql://localhost:5432/postgres"]
    enabled_collectors   = ["database", "locks", "long_running_transactions", "postmaster", "replication", "stat_bgwriter", "stat_database", "stat_statements", "stat_user_tables", "statio_user_indexes"]
}
discovery.relabel "integrations_postgres_exporter" {
    targets = prometheus.exporter.postgres.integrations_postgres_exporter.targets

    rule {
        target_label = "instance"
        replacement  = constants.hostname
    }
    rule {
        target_label = "job"
        replacement  = "integrations/postgres_exporter"
    }
}
prometheus.scrape "integrations_postgres_exporter" {
    targets    = discovery.relabel.integrations_postgres_exporter.output
    forward_to = [prometheus.remote_write.metrics_service.receiver]
    job_name   = "integrations/postgres_exporter"
}
Add a prometheus.exporter.postgres, discovery.relabel, and prometheus.scrape to your Grafana Alloy configuration to monitor a PostgreSQL instance.
Make sure to change the data_source_names to the connection string for the PostgreSQL server you want to monitor.
The enabled_collectors list activates the specific collectors required to populate all dashboards and alerts. The stat_statements collector requires the pg_stat_statements extension — see the prerequisites above for setup instructions.
For ease of use, the provided snippet sets the instance label to the hostname using the constants.hostname Alloy constant. If you are scraping from a remote Alloy instance, change it to a value that identifies the target host.
Refer to the linked documentation for the full array of options.
Advanced logs snippets
darwin
local.file_match "logs_integrations_postgres_exporter" {
    path_targets = [{
        __address__ = "localhost",
        __path__    = "/var/log/postgresql/postgres.log",
        instance    = constants.hostname,
        job         = "integrations/postgres_exporter",
    }]
}
loki.source.file "logs_integrations_postgres_exporter" {
    targets    = local.file_match.logs_integrations_postgres_exporter.targets
    forward_to = [loki.write.grafana_cloud_loki.receiver]
}
To collect logs from unix-like systems, you need a pair of loki.source.file, and local.file_match components.
The provided snippet is pre-configured with the default log write location for unix-like OS environments.
If you wish to capture other log files, you must add new maps to the path_targets list parameter of the local.file_match component, and include it in the targets list of loki.source.file component. Make sure that the new entry has the same instance and job labels, so it is matched to the correct instance to be shown in the Logs dashboard.
The log write location depends on your PostgreSQL configuration, make sure to configure __path__ within local.file_match accordingly.
linux
local.file_match "logs_integrations_postgres_exporter" {
    path_targets = [{
        __address__ = "localhost",
        __path__    = "/var/log/postgresql/postgres.log",
        instance    = constants.hostname,
        job         = "integrations/postgres_exporter",
    }]
}
loki.source.file "logs_integrations_postgres_exporter" {
    targets    = local.file_match.logs_integrations_postgres_exporter.targets
    forward_to = [loki.write.grafana_cloud_loki.receiver]
}
To collect logs from unix-like systems, you need a pair of loki.source.file, and local.file_match components.
The provided snippet is pre-configured with the default log write location for unix-like OS environments.
If you wish to capture other log files, you must add new maps to the path_targets list parameter of the local.file_match component, and include it in the targets list of loki.source.file component. Make sure that the new entry has the same instance and job labels, so it is matched to the correct instance to be shown in the Logs dashboard.
The log write location depends on your PostgreSQL configuration, make sure to configure __path__ within local.file_match accordingly.
windows
local.file_match "logs_integrations_postgres_exporter" {
    path_targets = [{
        __address__ = "localhost",
        __path__    = "C:\\Program Files\\PostgreSQL\\*\\data\\pg_log",
        instance    = constants.hostname,
        job         = "integrations/postgres_exporter",
    }]
}
loki.source.file "logs_integrations_postgres_exporter" {
    targets    = local.file_match.logs_integrations_postgres_exporter.targets
    forward_to = [loki.write.grafana_cloud_loki.receiver]
}
To collect logs from Windows systems, you need a pair of loki.source.file, and local.file_match components.
The provided snippet is pre-configured with the default log write location for Windows OS environments.
If you wish to capture other log files, you must add new maps to the path_targets list parameter of the local.file_match component, and include it in the targets list of loki.source.file component. Make sure that the new entry has the same instance and job labels, so it is matched to the correct instance to be shown in the Logs dashboard.
The log write location depends on your PostgreSQL configuration, make sure to configure __path__ within local.file_match accordingly.
You can also configure your PostgreSQL nodes to write logs to eventlog, in which case you will need to use the loki.source.windowsevent component instead of local.file_match and loki.source.file.
Kubernetes instructions
Before you begin with Kubernetes
Please note: These instructions assume the use of the Kubernetes Monitoring Helm chart
The PostgreSQL user is required to gather metrics. While you can use root user for testing, we strongly advise that you configure a separate user for Grafana Alloy, and give it only the strictly mandatory security privileges necessary for monitoring your node, as per the official documentation.
If you want to collect logs from your PostgreSQL nodes, please check the official documentation since it only writes logs to stderr by default.
Configuration snippets for Kubernetes Helm chart
The following snippets provide examples to guide you through the configuration process.
To scrape your Postgres instances, manually modify your Kubernetes Monitoring Helm chart with these configuration snippets.
Replace any values between the angle brackets <> in the provided snippets with your desired configuration values.
Metrics snippets
# Replace any values between the angle brackets '<>', with your desired configuration
alloy-metrics:
    extraConfig: |-
        prometheus.exporter.postgres "postgres" {
            data_source_names = ["postgresql://<username>:<password>@<your_postgres_instance_name>:5432/postgres"]
        }

        prometheus.scrape "postgres" {
        targets      = prometheus.exporter.postgres.postgres.targets
        job_name     = "integrations/postgres_exporter"
        forward_to   = [prometheus.relabel.postgres.receiver]
        }

        prometheus.relabel "postgres" {
            rule {
                replacement = "<your_postgres_instance_name>"
                target_label = "instance"
            }
            forward_to   = [prometheus.remote_write.grafana_cloud_metrics.receiver]
        }
Logs snippets
# Replace any values between the angle brackets '<>', with your desired configuration
podLogs:
    extraDiscoveryRules: |-
        rule {
            source_labels = ["__meta_kubernetes_namespace", "__meta_kubernetes_pod_label_<your_postgres_selector_labelname>"]
            separator     = ":"
            regex         = "<your_postgres_namespace>:<your_postgres_selector_labelvalue>"
            replacement   = "postgres"
            target_label  = "integration"
        }

        rule {
            source_labels = ["integration"]
            regex = "postgres"
            replacement = "<your_postgres_instance_name>"
            target_label = "instance"
        }

        rule {
            source_labels = ["integration"]
            regex = "postgres"
            replacement = "integrations/postgres_exporter"
            target_label = "job"
        }
Dashboards
The PostgreSQL integration installs the following dashboards in your Grafana Cloud instance to help monitor your system.
- PostgreSQL cluster overview
- PostgreSQL instance overview
- PostgreSQL logs
- PostgreSQL query performance
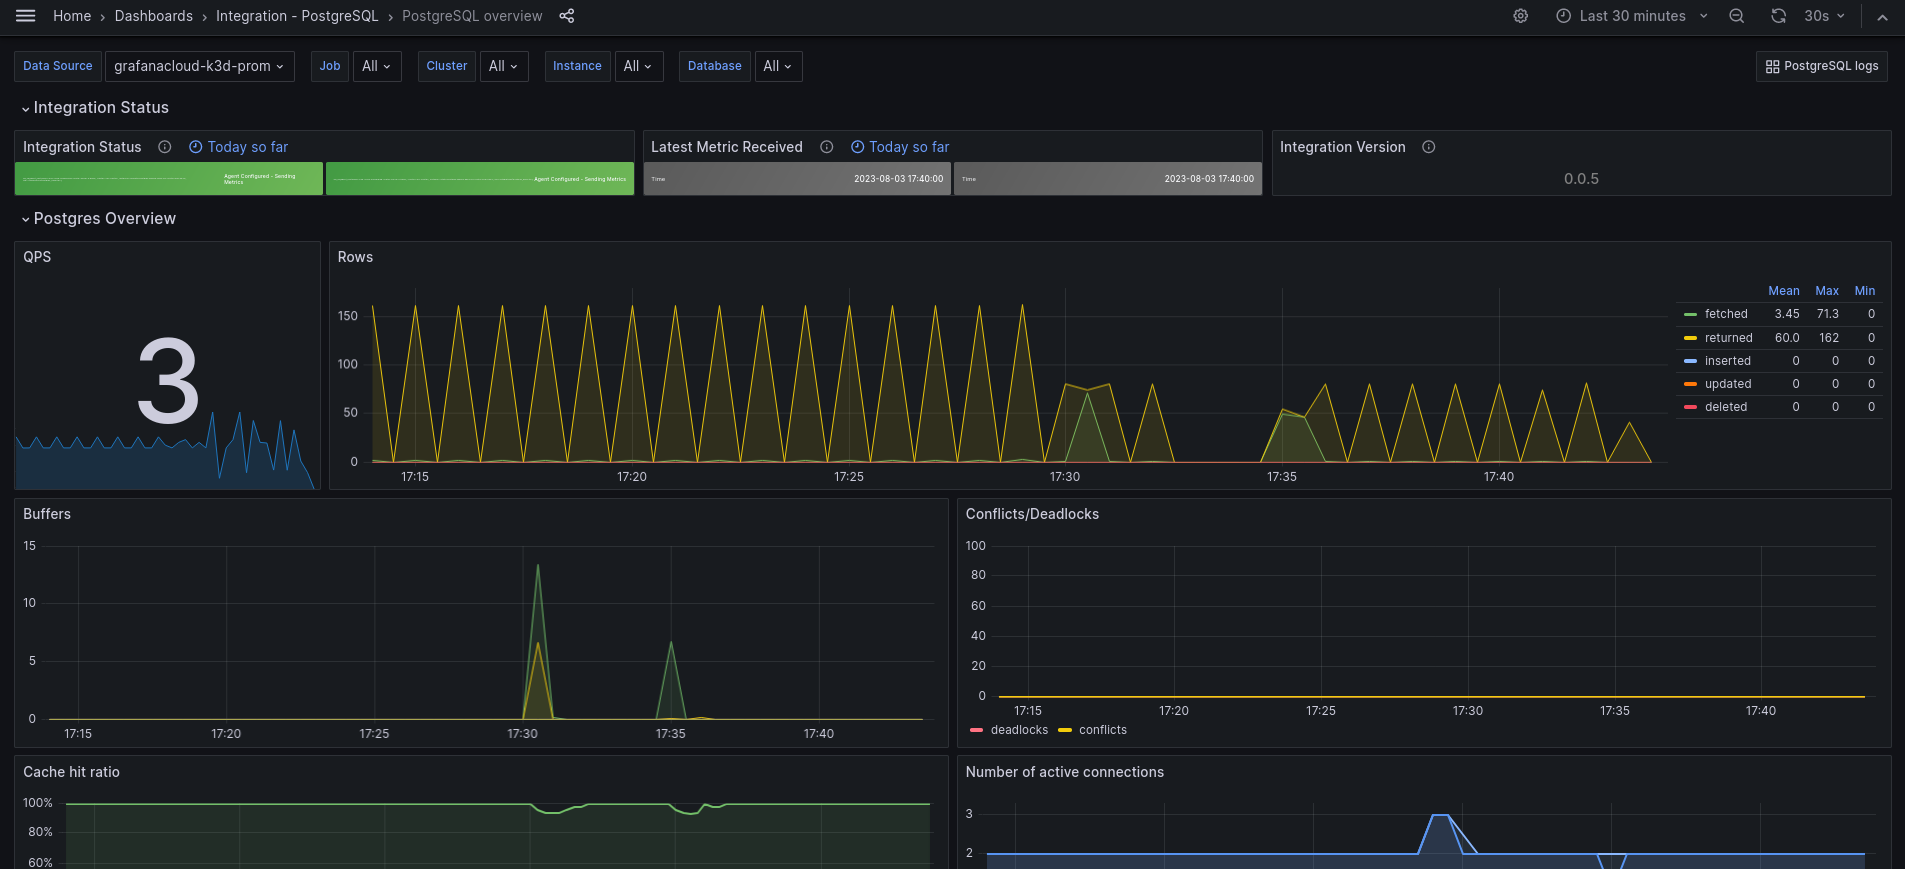
PostgreSQL overview dashboard
PostgreSQL logs dashboard

Alerts
The PostgreSQL integration includes the following useful alerts:
Metrics
The most important metrics provided by the PostgreSQL integration, which are used on the pre-built dashboards and Prometheus alerts, are as follows:
- pg_database_size_bytes
- pg_exporter_last_scrape_error
- pg_locks_count
- pg_long_running_transactions
- pg_postmaster_start_time_seconds
- pg_replication_is_replica
- pg_replication_lag
- pg_replication_lag_seconds
- pg_settings_block_size
- pg_settings_max_connections
- pg_settings_max_locks_per_transaction
- pg_settings_superuser_reserved_connections
- pg_stat_activity_count
- pg_stat_activity_max_tx_duration
- pg_stat_archiver_failed_count
- pg_stat_bgwriter_buffers_alloc_total
- pg_stat_bgwriter_buffers_clean_total
- pg_stat_bgwriter_checkpoints_req_total
- pg_stat_bgwriter_checkpoints_timed_total
- pg_stat_bgwriter_maxwritten_clean_total
- pg_stat_database_blks_hit
- pg_stat_database_blks_read
- pg_stat_database_conflicts
- pg_stat_database_deadlocks
- pg_stat_database_numbackends
- pg_stat_database_temp_bytes
- pg_stat_database_tup_deleted
- pg_stat_database_tup_fetched
- pg_stat_database_tup_inserted
- pg_stat_database_tup_updated
- pg_stat_database_xact_commit
- pg_stat_database_xact_rollback
- pg_stat_replication_pg_current_wal_lsn_bytes
- pg_stat_replication_pg_wal_lsn_diff
- pg_stat_statements_calls_total
- pg_stat_statements_rows_total
- pg_stat_statements_seconds_total
- pg_stat_user_tables_idx_scan
- pg_stat_user_tables_last_autoanalyze
- pg_stat_user_tables_last_autovacuum
- pg_stat_user_tables_n_dead_tup
- pg_stat_user_tables_n_live_tup
- pg_stat_user_tables_seq_scan
- pg_statio_user_indexes_idx_blks_hit_total
- pg_statio_user_indexes_idx_blks_read_total
- pg_up
- process_cpu_seconds_total
- process_resident_memory_bytes
- process_virtual_memory_bytes
- up
Changelog
# 1.1.1 - November 2024

- Update status panel check queries

# 1.1.0 - August 2024

* Add asserts support
* Update mixin

# 1.0.4 - May 2024

* Update mixin to accommodate pg_stat_bgwriter counter metrics name changes. Updated in Grafana Alloy and Grafana Agent v0.40.5.

# 1.0.3 - September 2023

* New Filter Metrics option for configuring the Grafana Agent, which saves on metrics cost by dropping any metric not used by this integration. Beware that anything custom built using metrics that are not on the snippet will stop working.
* New hostname relabel option, which applies the instance name you write on the text box to the Grafana Agent configuration snippets, making it easier and less error prone to configure this mandatory label.

# 1.0.2 - August 2023

* Add regex filter for logs datasource

# 1.0.1 - August 2023

* Fix typo in agent instructions

# 1.0.0 - August 2023

* Add K8s support
* Add Logs dashboard
* Support cluster/multicluster visualization
* New Filter Metrics option for configuring the Grafana Agent, which saves on metrics cost by dropping any metric not used by this integration. Beware that anything custom built using metrics that are not on the snippet will stop working.
* New hostname relabel option, which applies the instance name you write on the text box to the Grafana Agent configuration snippets, making it easier and less error prone to configure this mandatory label.

# 0.0.4 - April 2023

* Fix cache hit ratio panel
* Use psql specific metric pg_up to avoid return of postgres unrelated instances
* Change panels to timeseries
* Move QPS to left and remove transparency for common style
* Fix conflict/deadlock metrics

# 0.0.3 - May 2022

* Use `$job` template variable in selectors for all queries
* Reorder template variables in dashboard UI
* Enable multi-select for job and instance template variables
* Filter instance template variable query by selected value(s) for job template variable

# 0.0.2 - October 2021

* Update all rate queries to use `$__rate_interval`

# 0.0.1 - December 2020

* Initial release
Cost
By connecting your PostgreSQL instance to Grafana Cloud, you might incur charges. To view information on the number of active series that your Grafana Cloud account uses for metrics included in each Cloud tier, see Active series and dpm usage and Cloud tier pricing.


