Microsoft IIS integration for Grafana Cloud
Microsoft IIS is a web server that can host and manage web apps on Windows servers. This integration for Grafana Cloud allows users to collect metrics and access logs for monitoring a Microsoft IIS instance.
This integration supports Microsoft IIS 10.0 onwards.
This integration includes 5 useful alerts and 3 pre-built dashboards to help monitor and visualize Microsoft IIS metrics and logs.
Before you begin
In order for the integration to properly work, you must configure Microsoft IIS with the following:
Performance Counters need to be enabled
- Start Server Manager
- Navigate to the Local Server tab
- Scroll down to the Performance section
- Right click the server and select
Start Performance Counters
You will also need to have a site running on your IIS instance to see some of the metrics.
Install Microsoft IIS integration for Grafana Cloud
- In your Grafana Cloud stack, click Connections in the left-hand menu.
- Find Microsoft IIS and click its tile to open the integration.
- Review the prerequisites in the Configuration Details tab and set up Grafana Alloy to send Microsoft IIS metrics and logs to your Grafana Cloud instance.
- Click Install to add this integration’s pre-built dashboards and alerts to your Grafana Cloud instance, and you can start monitoring your Microsoft IIS setup.
Configuration snippets for Grafana Alloy
Simple mode
These snippets are configured to scrape a single Microsoft IIS instance running locally with default ports.
First, manually copy and append the following snippets into your alloy configuration file.
Integrations snippets
prometheus.exporter.windows "integrations_windows_exporter" {
	enabled_collectors = ["iis"]

	dfsr {
		sources_enabled = [""]
	}

	exchange {
		enabled_list = [""]
	}

	mssql {
		enabled_classes = [""]
	}
}

discovery.relabel "integrations_windows_exporter" {
	targets = prometheus.exporter.windows.integrations_windows_exporter.targets

	rule {
		target_label = "job"
		replacement  = "integrations/iis"
	}

	rule {
		target_label = "instance"
		replacement  = constants.hostname
	}
}

prometheus.scrape "integrations_windows_exporter" {
	targets    = discovery.relabel.integrations_windows_exporter.output
	forward_to = [prometheus.remote_write.metrics_service.receiver]
	job_name   = "integrations/windows_exporter"
}
Advanced mode
The following snippets provide examples to guide you through the configuration process.
To instruct Grafana Alloy to scrape your Microsoft IIS instances, manually copy and append the snippets to your alloy configuration file, then follow subsequent instructions.
Advanced integrations snippets
prometheus.exporter.windows "integrations_windows_exporter" {
	enabled_collectors = ["iis"]

	dfsr {
		sources_enabled = [""]
	}

	exchange {
		enabled_list = [""]
	}

	mssql {
		enabled_classes = [""]
	}
}

discovery.relabel "integrations_windows_exporter" {
	targets = prometheus.exporter.windows.integrations_windows_exporter.targets

	rule {
		target_label = "job"
		replacement  = "integrations/iis"
	}

	rule {
		target_label = "instance"
		replacement  = constants.hostname
	}
}

prometheus.scrape "integrations_windows_exporter" {
	targets    = discovery.relabel.integrations_windows_exporter.output
	forward_to = [prometheus.remote_write.metrics_service.receiver]
	job_name   = "integrations/windows_exporter"
}
This integrations uses the prometheus.exporter.windows component to generate metrics from a Microsoft IIS instance.
For the full array of configuration options, refer to the prometheus.exporter.windows component reference documentation.
This exporter must be linked with a discovery.relabel component to apply the necessary relabelings.
For each Microsoft IIS instance to be monitored you must create a pair of these components.
Configure the following properties within each discovery.relabel component:
instancelabel:constants.hostnamesets theinstancelabel to your Grafana Alloy server hostname. If that is not suitable, change it to a value uniquely identifies this Microsoft IIS instance. Make sure this label value is the same for all telemetry data collected for this instance.
You can then scrape them by including each discovery.relabel under targets within the prometheus.scrape component.
Advanced logs snippets
windows
local.file_match "logs_integrations_integrations_iis" {
	path_targets = [{
		__address__ = "localhost",
		__path__    = "/inetpub/logs/LogFiles/W3SVC<site1-id>/u_ex*.log",
		instance    = constants.hostname,
		job         = "integrations/iis",
		site        = "<your-site1-name>",
	}]
}

loki.process "logs_integrations_integrations_iis" {
	forward_to = [loki.write.grafana_cloud_loki.receiver]

	stage.match {
		selector            = "{job=\"integrations/iis\"} |~ \"^#\""
		action              = "drop"
		drop_counter_reason = "iis_comment_line"
	}
}

loki.source.file "logs_integrations_integrations_iis" {
	targets    = local.file_match.logs_integrations_integrations_iis.targets
	forward_to = [loki.process.logs_integrations_integrations_iis.receiver]
}
To monitor your Microsoft IIS instance logs, you will use a combination of the following components:
local.file_match defines where to find the log file to be scraped. Change the following properties according to your environment:
__address__: The Microsoft IIS instance address__path__: The path to the log file.instancelabel:constants.hostnamesets theinstancelabel to your Grafana Alloy server hostname. If that is not suitable, change it to a value uniquely identifies this Microsoft IIS instance. Make sure this label value is the same for all telemetry data collected for this instance.sitelabel must be set to the website name that corresponds to the log path label__path__, which will contain a correspondingsiteID. ThesiteIDneeds to bet set to a matching ID of thesitelabel in the__path__. For example, a site name might beDefault Websiteand its site ID might be1. This would result insite: Default Websiteand__path__: /inetpub/logs/LogFiles/W3SVC1/u_ex*.log. For each site, a new static config must be appended to the list understatic_configsin order to filter logs by their sitelabels.
loki.process defines how to process logs before sending it to Loki.
loki.source.file sends logs to Loki.
Dashboards
The Microsoft IIS integration installs the following dashboards in your Grafana Cloud instance to help monitor your system.
- Microsoft IIS applications
- Microsoft IIS logs
- Microsoft IIS overview
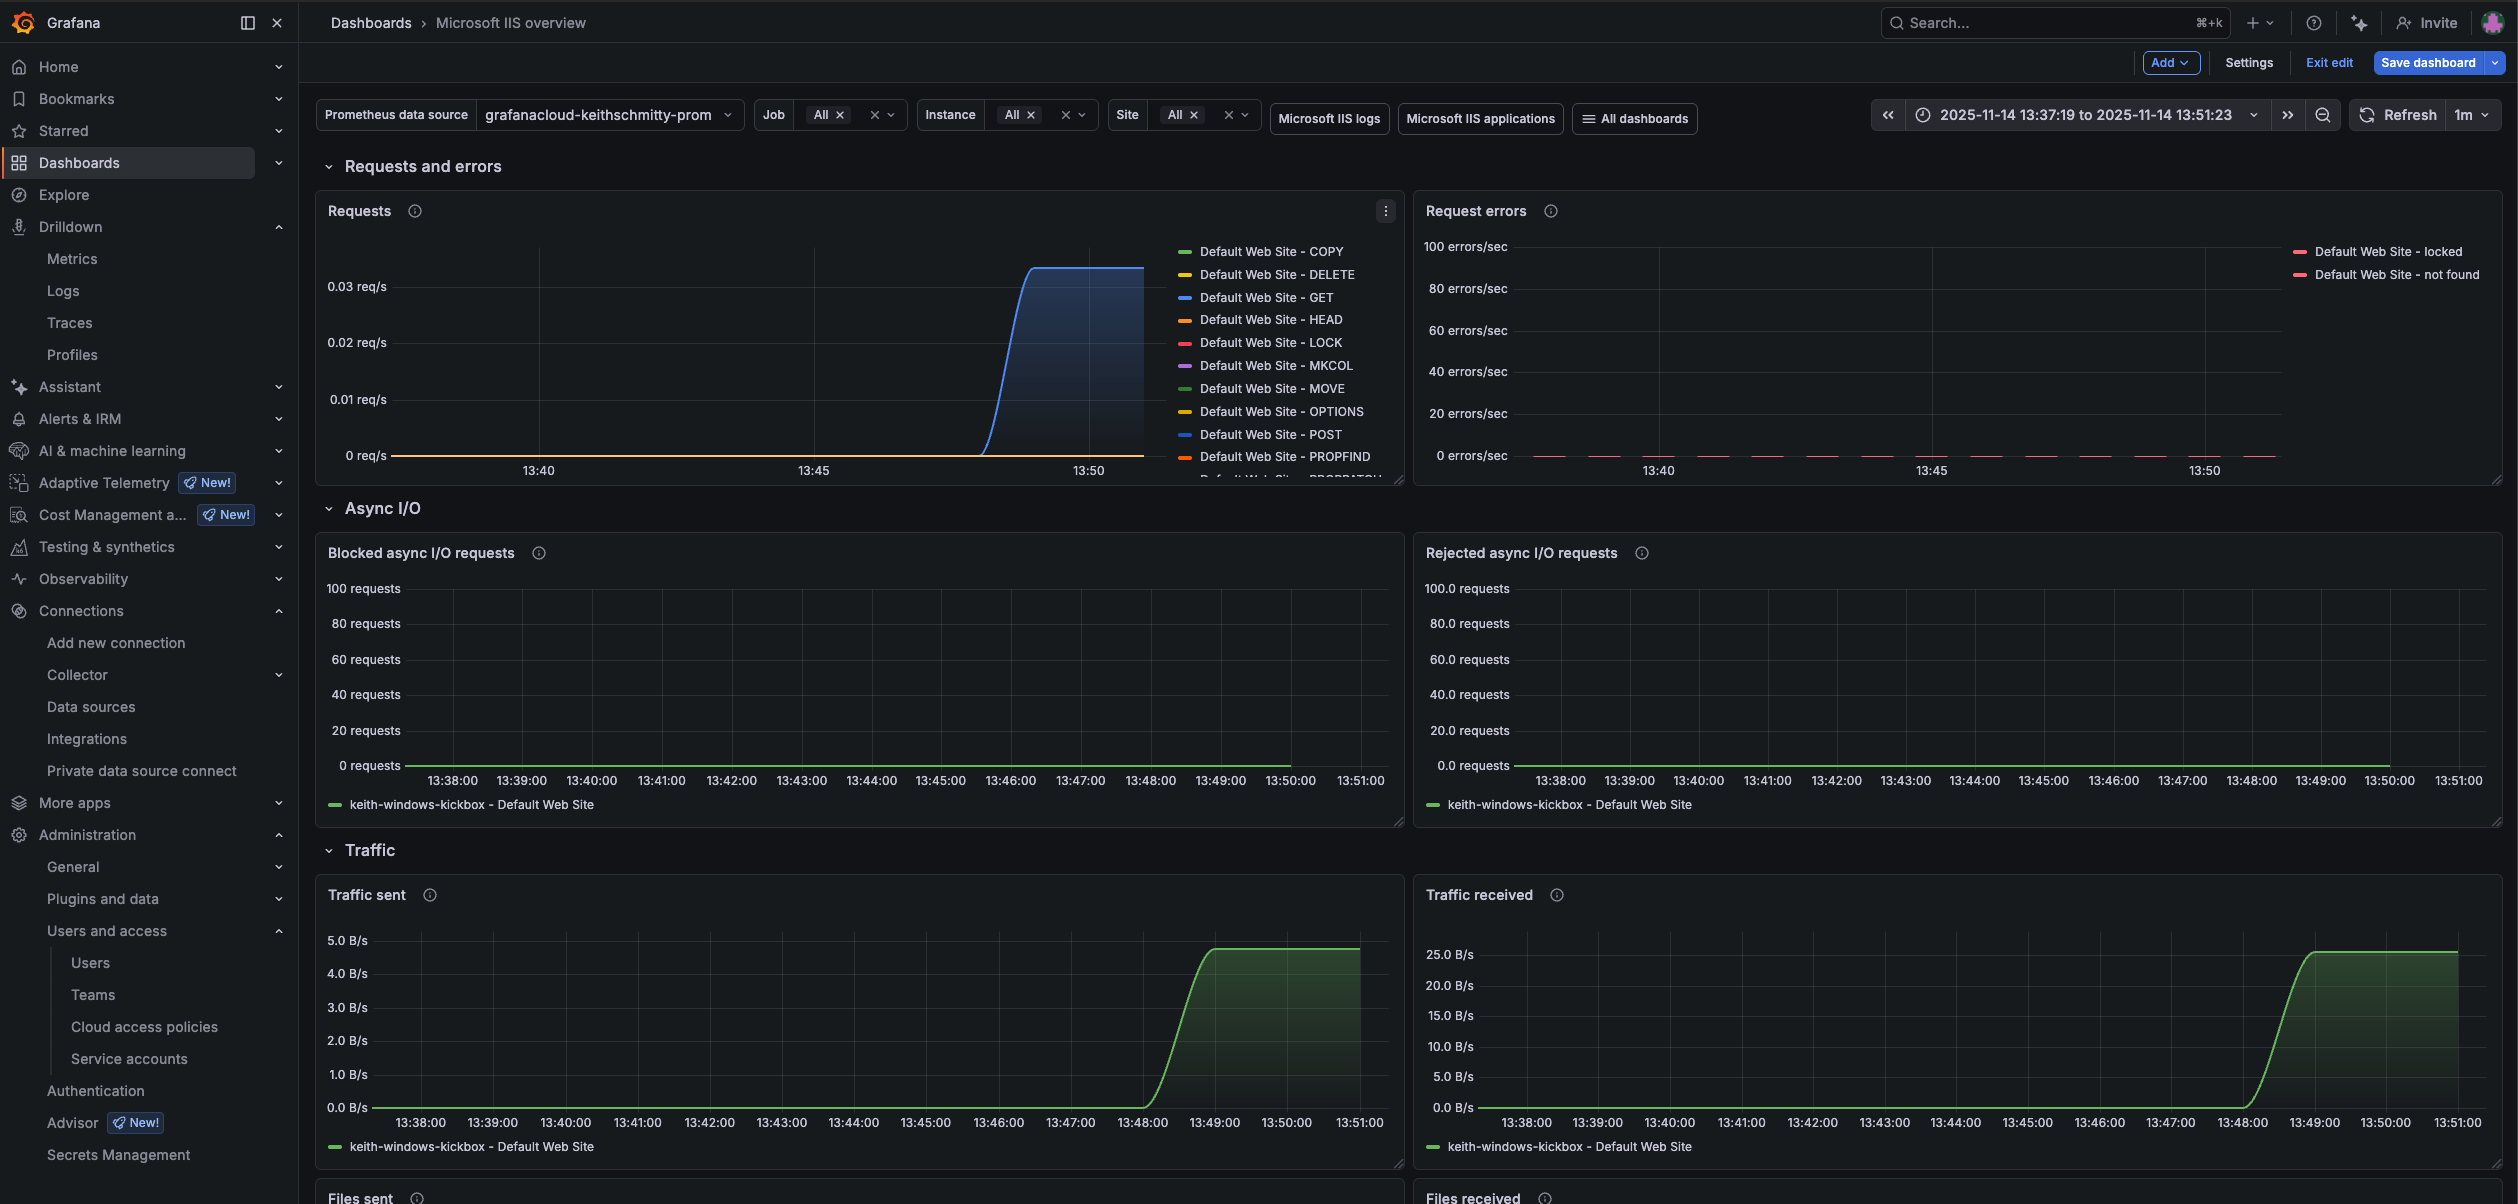
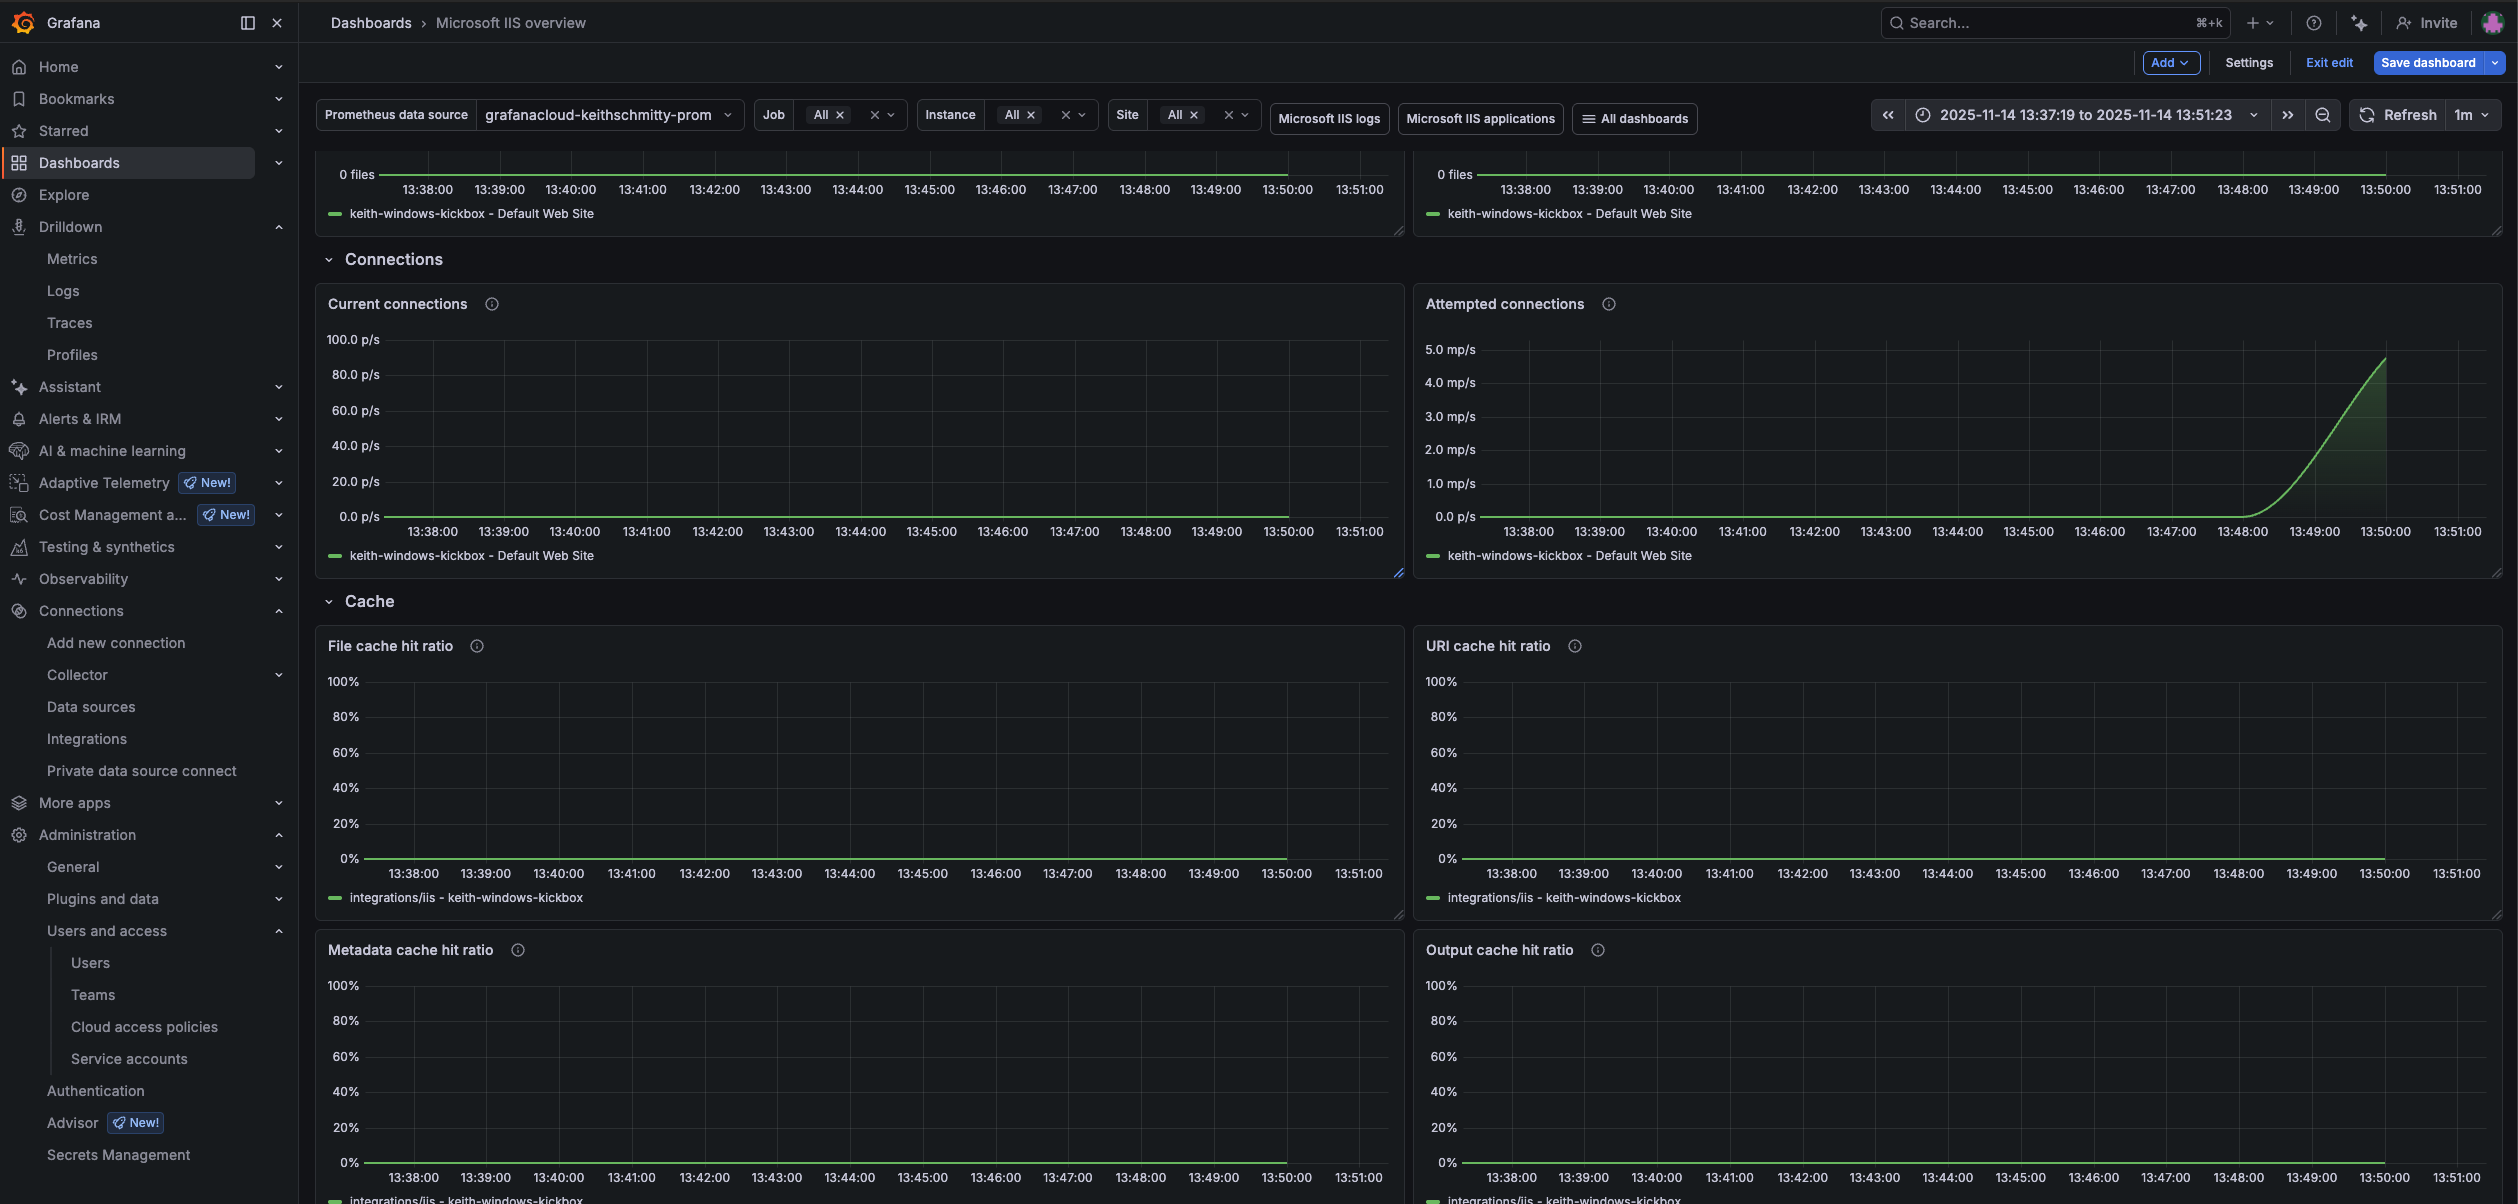
Microsoft IIS overview
Microsoft IIS overview (Traffic)
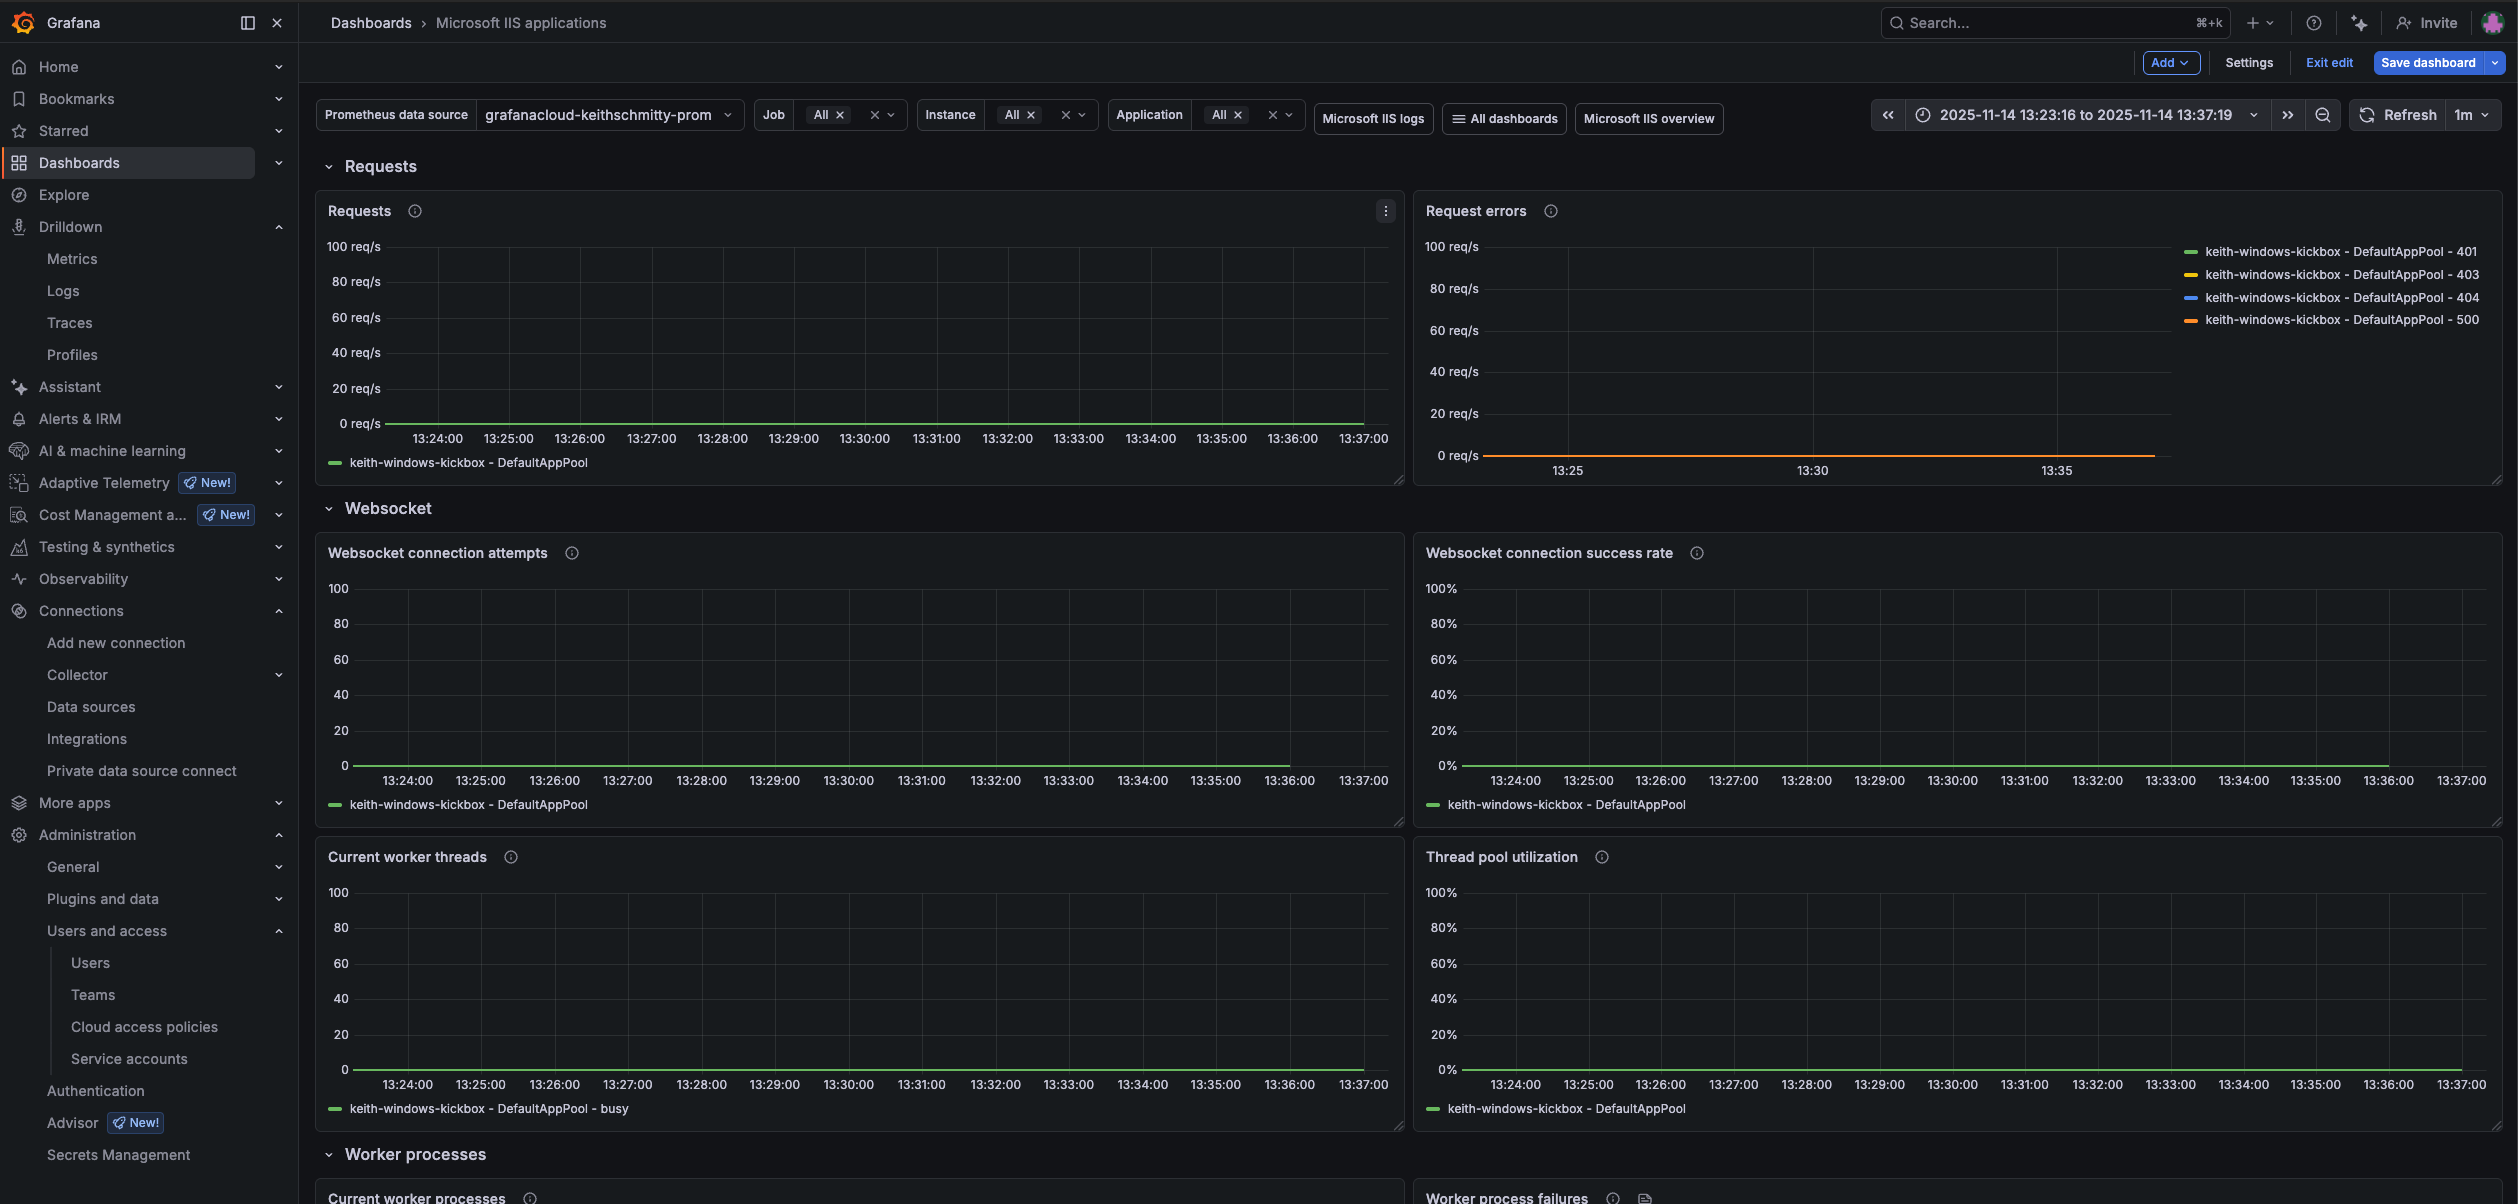
Microsoft IIS applications
Alerts
The Microsoft IIS integration includes the following useful alerts:
Metrics
The most important metrics provided by the Microsoft IIS integration, which are used on the pre-built dashboards and Prometheus alerts, are as follows:
- up
- windows_iis_blocked_async_io_requests_total
- windows_iis_connection_attempts_all_instances_total
- windows_iis_current_application_pool_state
- windows_iis_current_connections
- windows_iis_current_worker_processes
- windows_iis_files_received_total
- windows_iis_files_sent_total
- windows_iis_locked_errors_total
- windows_iis_not_found_errors_total
- windows_iis_received_bytes_total
- windows_iis_rejected_async_io_requests_total
- windows_iis_requests_total
- windows_iis_sent_bytes_total
- windows_iis_server_file_cache_hits_total
- windows_iis_server_file_cache_queries_total
- windows_iis_server_metadata_cache_hits_total
- windows_iis_server_metadata_cache_queries_total
- windows_iis_server_output_cache_hits_total
- windows_iis_server_output_cache_queries_total
- windows_iis_server_uri_cache_hits_total
- windows_iis_server_uri_cache_queries_total
- windows_iis_total_worker_process_failures
- windows_iis_total_worker_process_ping_failures
- windows_iis_total_worker_process_shutdown_failures
- windows_iis_total_worker_process_startup_failures
- windows_iis_worker_file_cache_hits_total
- windows_iis_worker_file_cache_queries_total
- windows_iis_worker_max_threads
- windows_iis_worker_metadata_cache_hits_total
- windows_iis_worker_metadata_cache_queries_total
- windows_iis_worker_output_cache_hits_total
- windows_iis_worker_output_queries_total
- windows_iis_worker_request_errors_total
- windows_iis_worker_requests_total
- windows_iis_worker_threads
- windows_iis_worker_uri_cache_hits_total
- windows_iis_worker_uri_cache_queries_total
- windows_iis_worker_websocket_connection_accepted_total
- windows_iis_worker_websocket_connection_attempts_total
Changelog
# 1.1.0 - April 2026

* Updated dashboards to follow new stylistic standards

# 1.0.0 - December 2025

* Chore: Fix incorrect semver to 1.0.0. No further changes

# 0.0.3 - September 2023

* New Filter Metrics option for configuring the Grafana Agent, which saves on metrics cost by dropping any metric not used by this integration. Beware that anything custom built using metrics that are not on the snippet will stop working.
* New hostname relabel option, which applies the instance name you write on the text box to the Grafana Agent configuration snippets, making it easier and less error prone to configure this mandatory label.

# 0.0.2 - August 2023

* Add regex filter for logs datasource

# 0.0.1 - April 2023

* Initial release
Cost
By connecting your Microsoft IIS instance to Grafana Cloud, you might incur charges. To view information on the number of active series that your Grafana Cloud account uses for metrics included in each Cloud tier, see Active series and dpm usage and Cloud tier pricing.


