What's new from Grafana Labs
Grafana Labs products, projects, and features can go through multiple release stages before becoming generally available. These stages in the release life cycle can present varying degrees of stability and support. For more information, refer to release life cycle for Grafana Labs.
Loading...
Area of interest:
Cloud availability:
Cloud editions:
Self-managed availability:
Self-managed editions:
No results found. Please adjust your filters or search criteria.
There was an error with your request.
The Grafana AI SDK is now open source. It’s a Go SDK for building your own agents, with support for Grafana Cloud, Anthropic, OpenAI, Amazon Bedrock, and any OpenAI-compatible endpoint.
We’re excited to announce the Private Preview of Grafana Assistant in Microsoft Teams. The Assistant is already in Slack, and now it comes to Teams too, meeting your team where they already work. Once enabled for your organization, you can ask questions in your DMs and channels, get support on live issues, and pull in your Grafana Cloud data and integrations without leaving the conversation.
We’re excited to announce the private preview of the Grafana Assistant desktop app, which brings the Assistant closer to your workflow than ever. With the desktop app, the Assistant can work with your local file system, your code, and your other tools alongside all your data in Grafana Cloud, so you can wrangle alerts, incidents, dashboards, data sources, and more from one place.
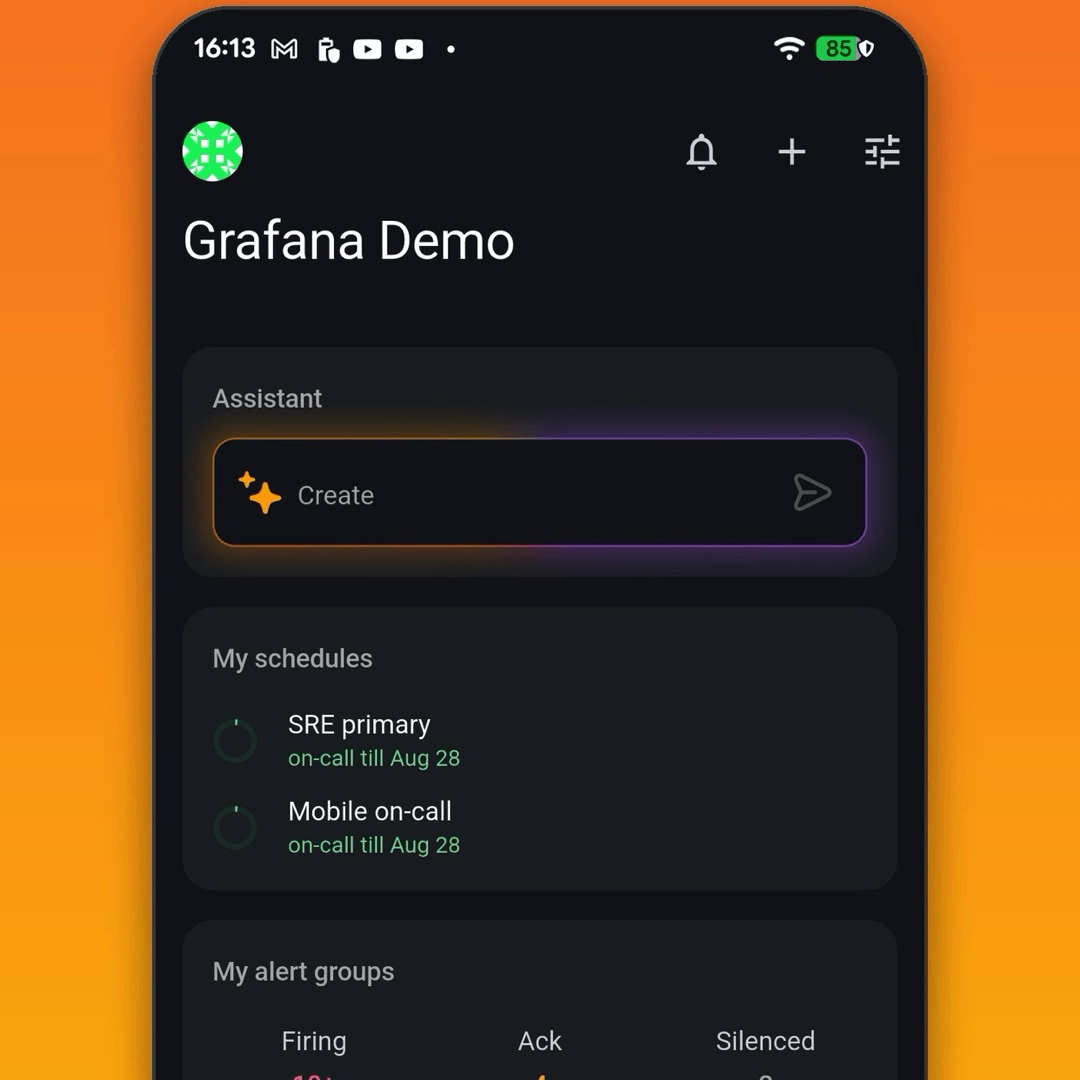
The Grafana IRM mobile app has a new name and a lot more to offer. It’s now the Grafana Mobile app, and it comes with Grafana Assistant built-in.
With the Assistant in your pocket, your phone becomes an actually useful extension of Grafana Cloud. Get paged by IRM, open an Assistant chat, and start remediation without waiting to get back to a keyboard. Because conversations sync across devices, you can start on your phone and pick up right where you left off on desktop, without losing any context.
What you can do:
- Respond: get alert group and incident context automatically pulled into the chat, so the Assistant can start investigating for you the moment you’re notified.
- Chat: ask the Assistant questions in plain language to understand what’s happening before you act.
- Verify: check on your dashboards and panels from anywhere.
Update to the latest Grafana app on iOS or Android to get started. Grafana Assistant and dashboard viewing are in public preview.
Stop hunting through menus for the dashboard you built months ago. Assistant Search lets you query your Grafana artifacts blazingly fast. Describe what you’re after in plain language, and get back the dashboards, alerts, incidents, Assistant Investigations, labels, and more that match, no exact names required.
Agent Observability is now generally available in Grafana Cloud. Agentic workloads need observability just like everything else you run, but it’s harder to see into how an agent reasons, what tools it calls, or where it quietly degrades. Agent Observability brings that behavior into the light, tightly integrated across Grafana Cloud and Grafana Assistant so it lives right next to the rest of your telemetry.
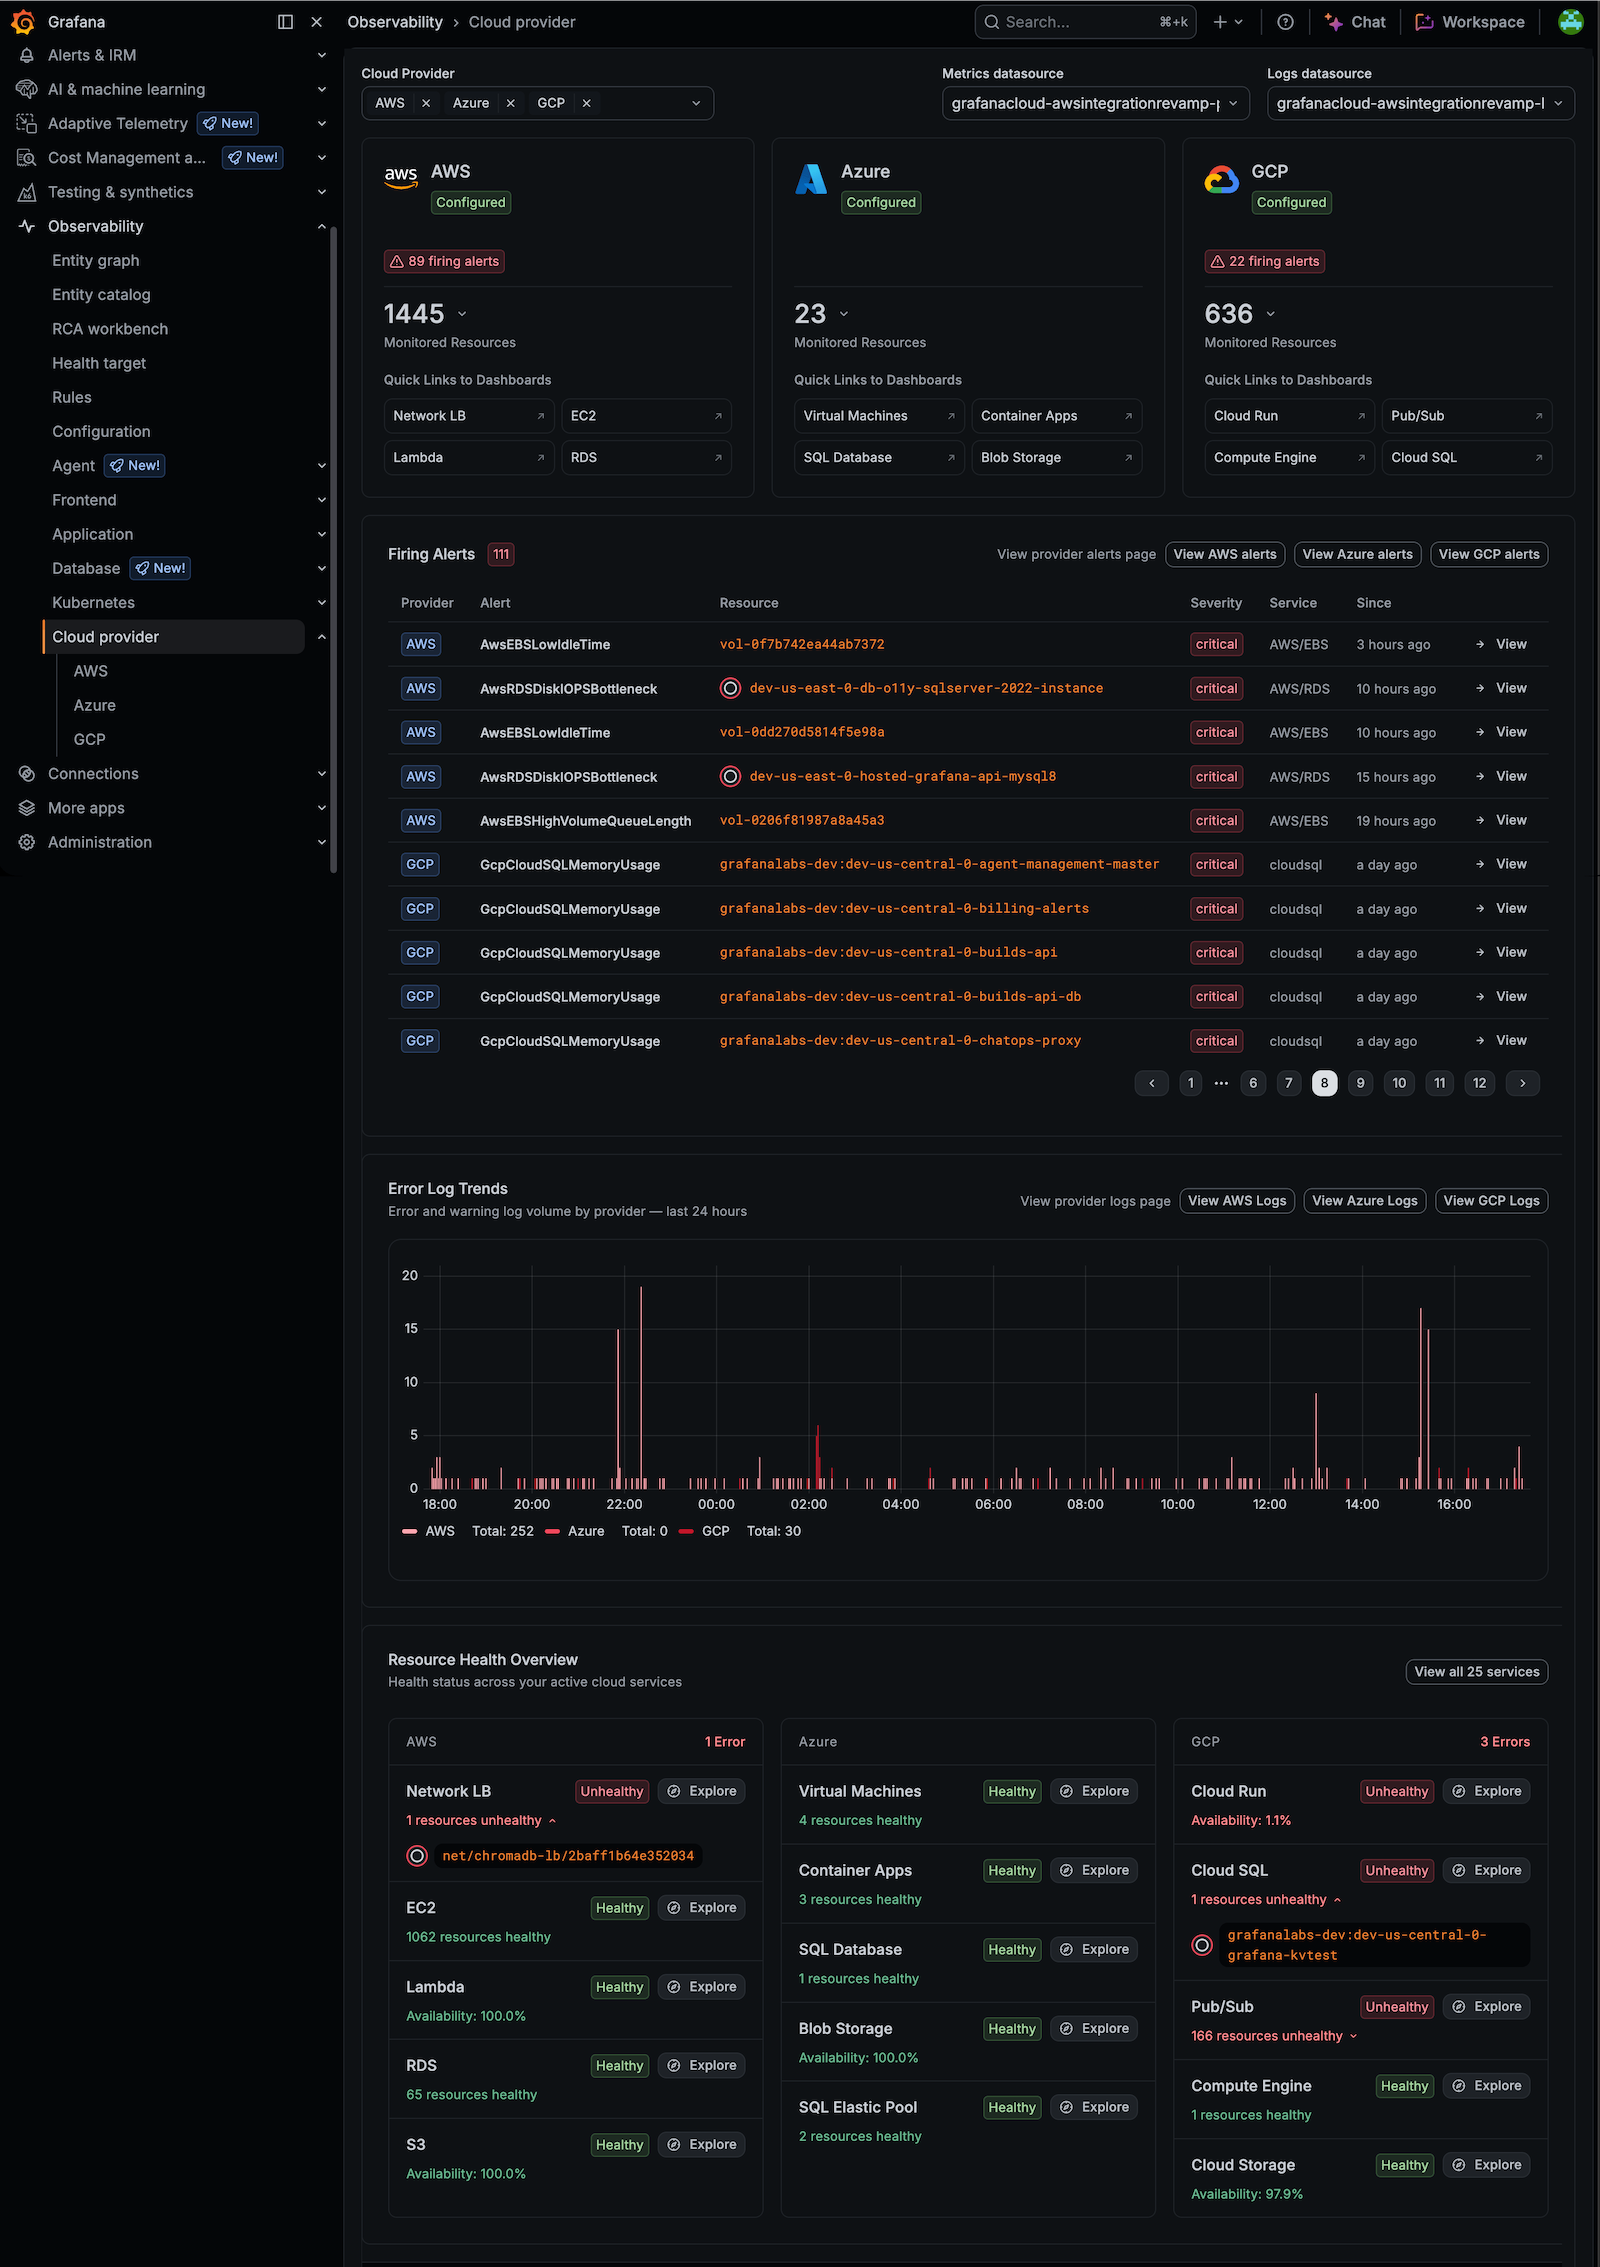
The Cloud Provider Observability home page is now a live summary of your environment instead of static introductory content. Once you configure at least one provider, the page brings together the signals that need your attention across AWS, Azure, and GCP, so you can triage from one place and decide where to look next.
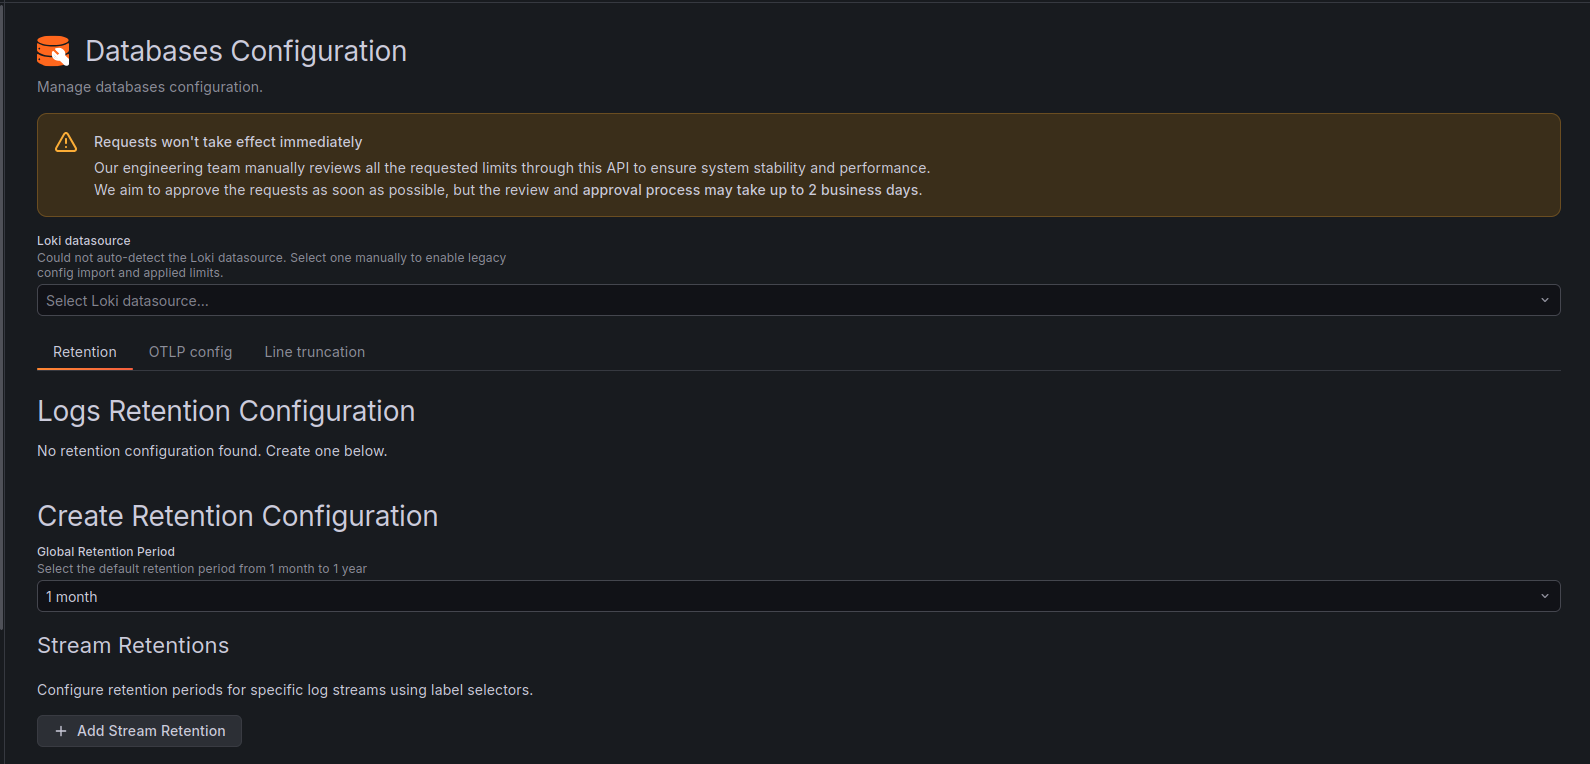
The logs self-service configuration API, which had previously been available to all Grafana Cloud Logs users, is being deprecated and will be removed.
This API is being replaced by the Grafana Database Configuration app, which will only be available to paid users of Grafana Cloud.
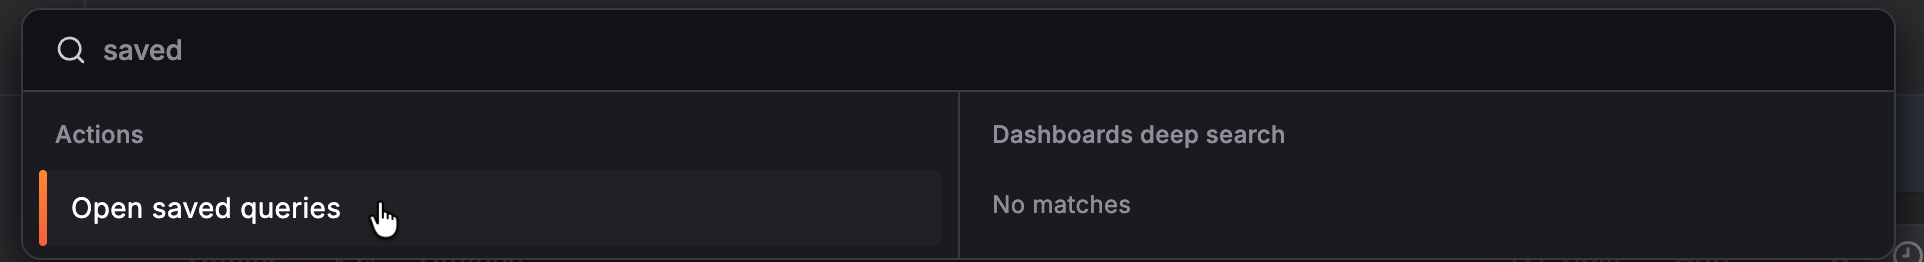
Saved queries is now generally available in Grafana Enterprise and Grafana Cloud, making it easier to discover, reuse, and share queries across your organization.
This release also introduces two major enhancements: the ability to access saved queries directly from the command palette for faster discovery, and to provision saved queries with Terraform to manage them as code. Together, these updates make saved queries easier to find, easier to manage, and easier to incorporate into your everyday workflow.
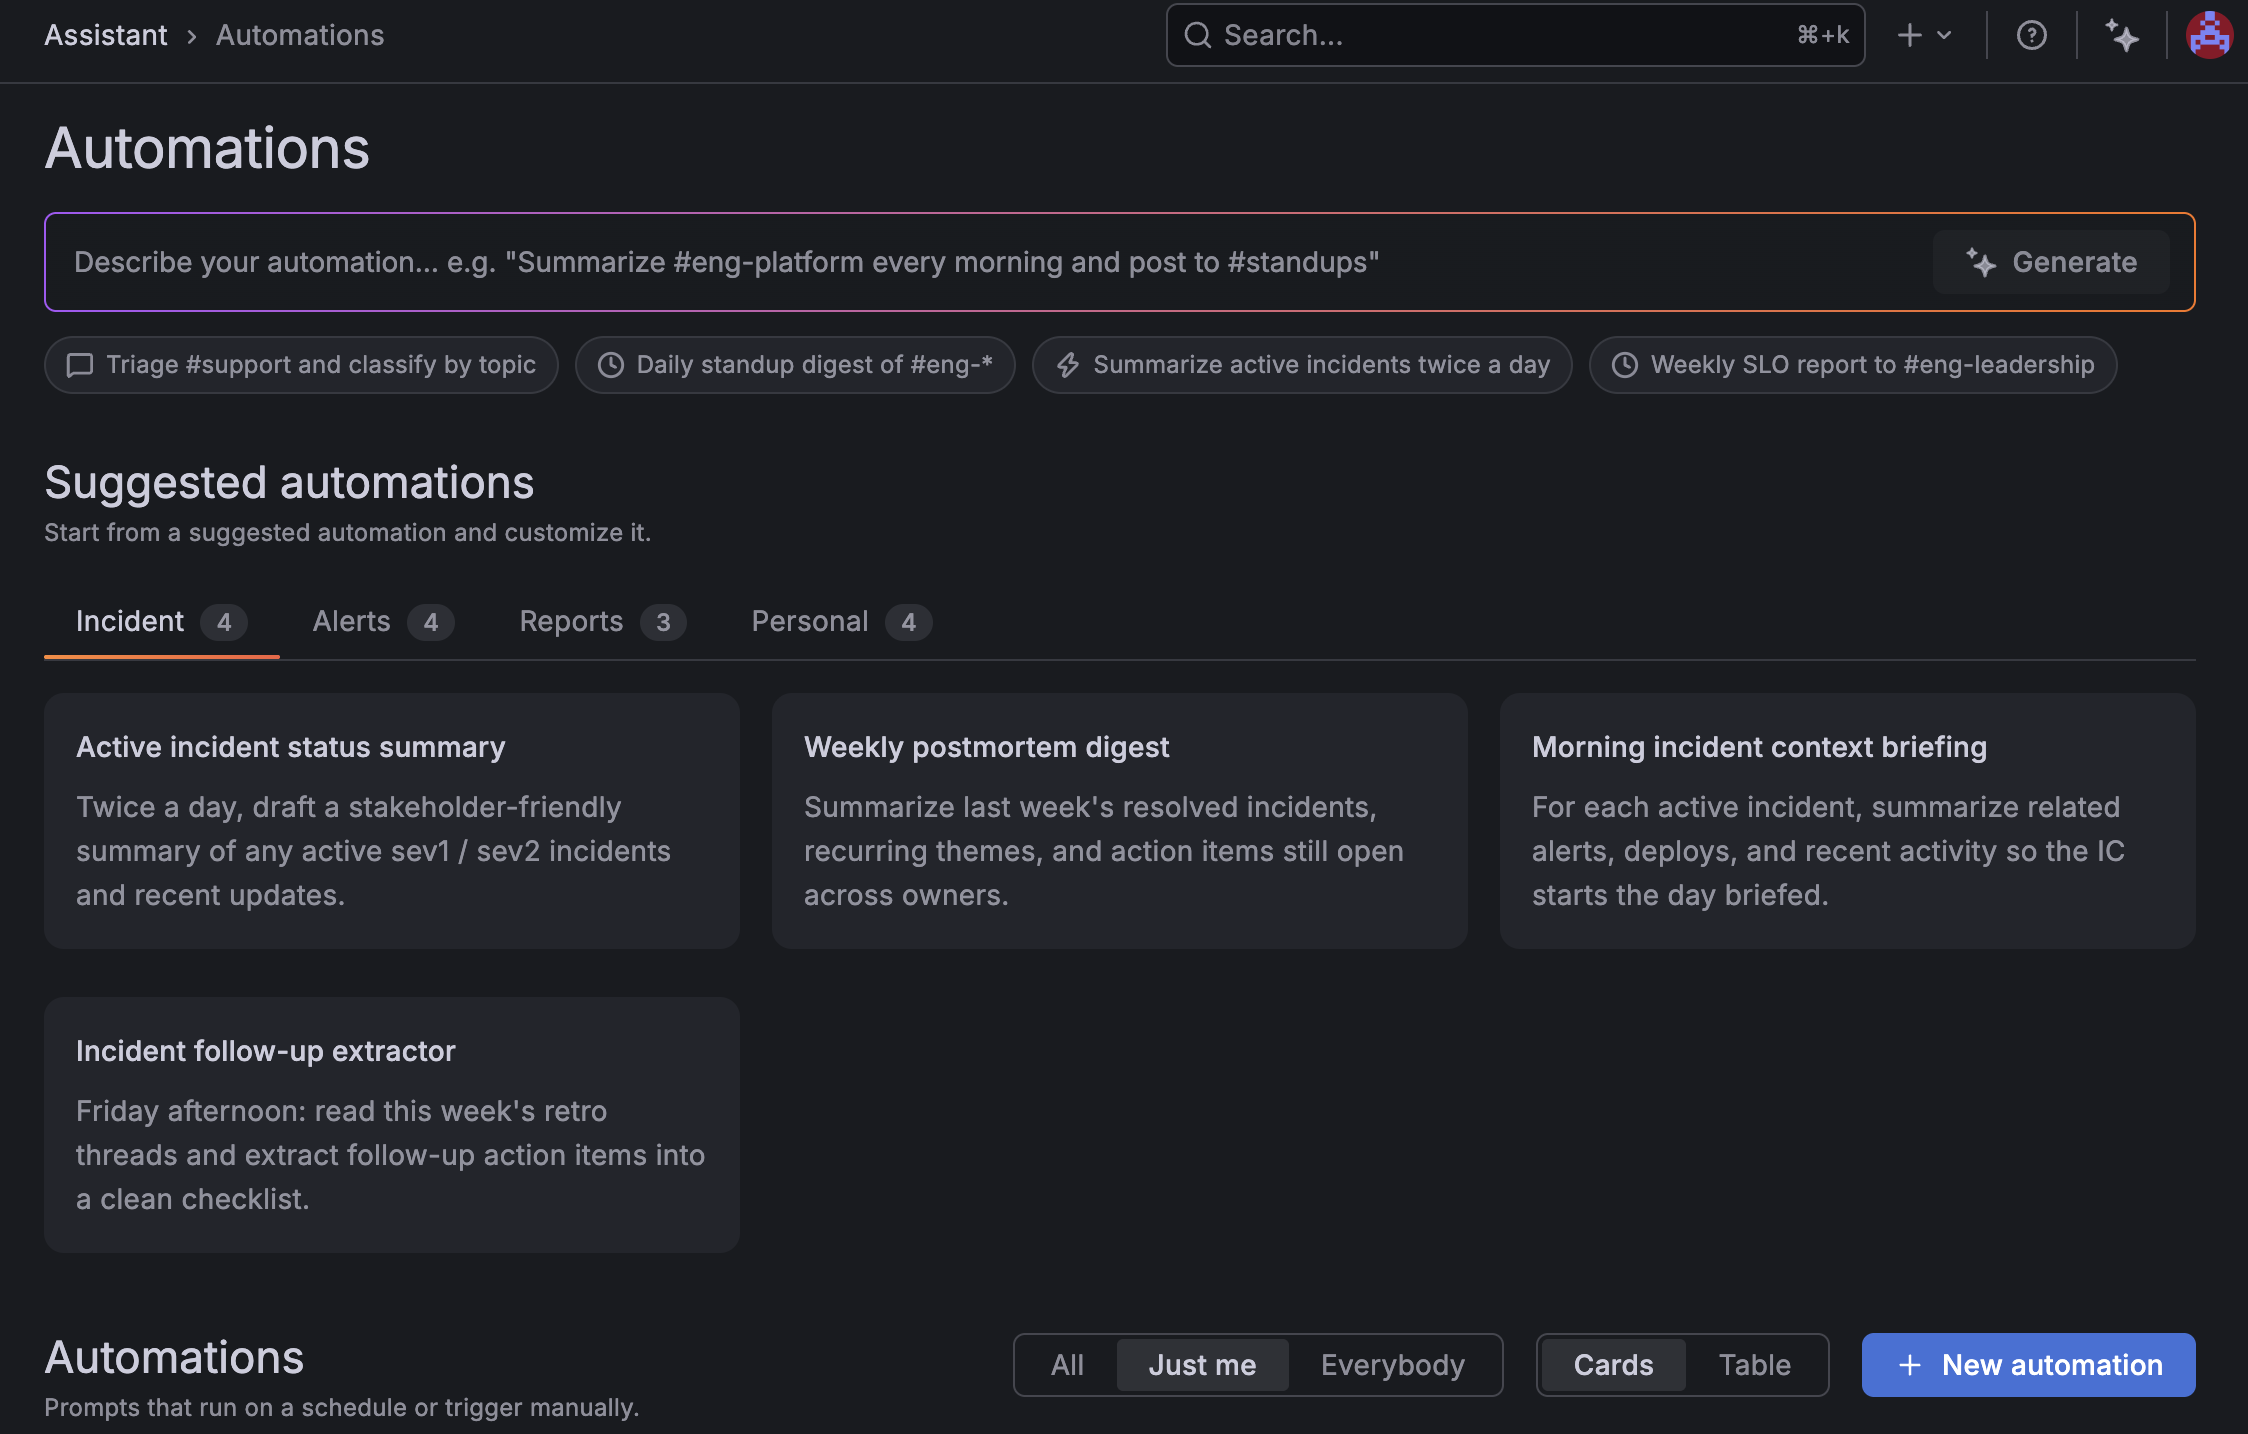
The recurring work you’d normally run yourself - a morning summary, a routine check, a standing report - Assistant can take care of that for you. With Assistant Automations, you save a Grafana Assistant prompt once and it happens on schedule, so you log in and it’s already done.
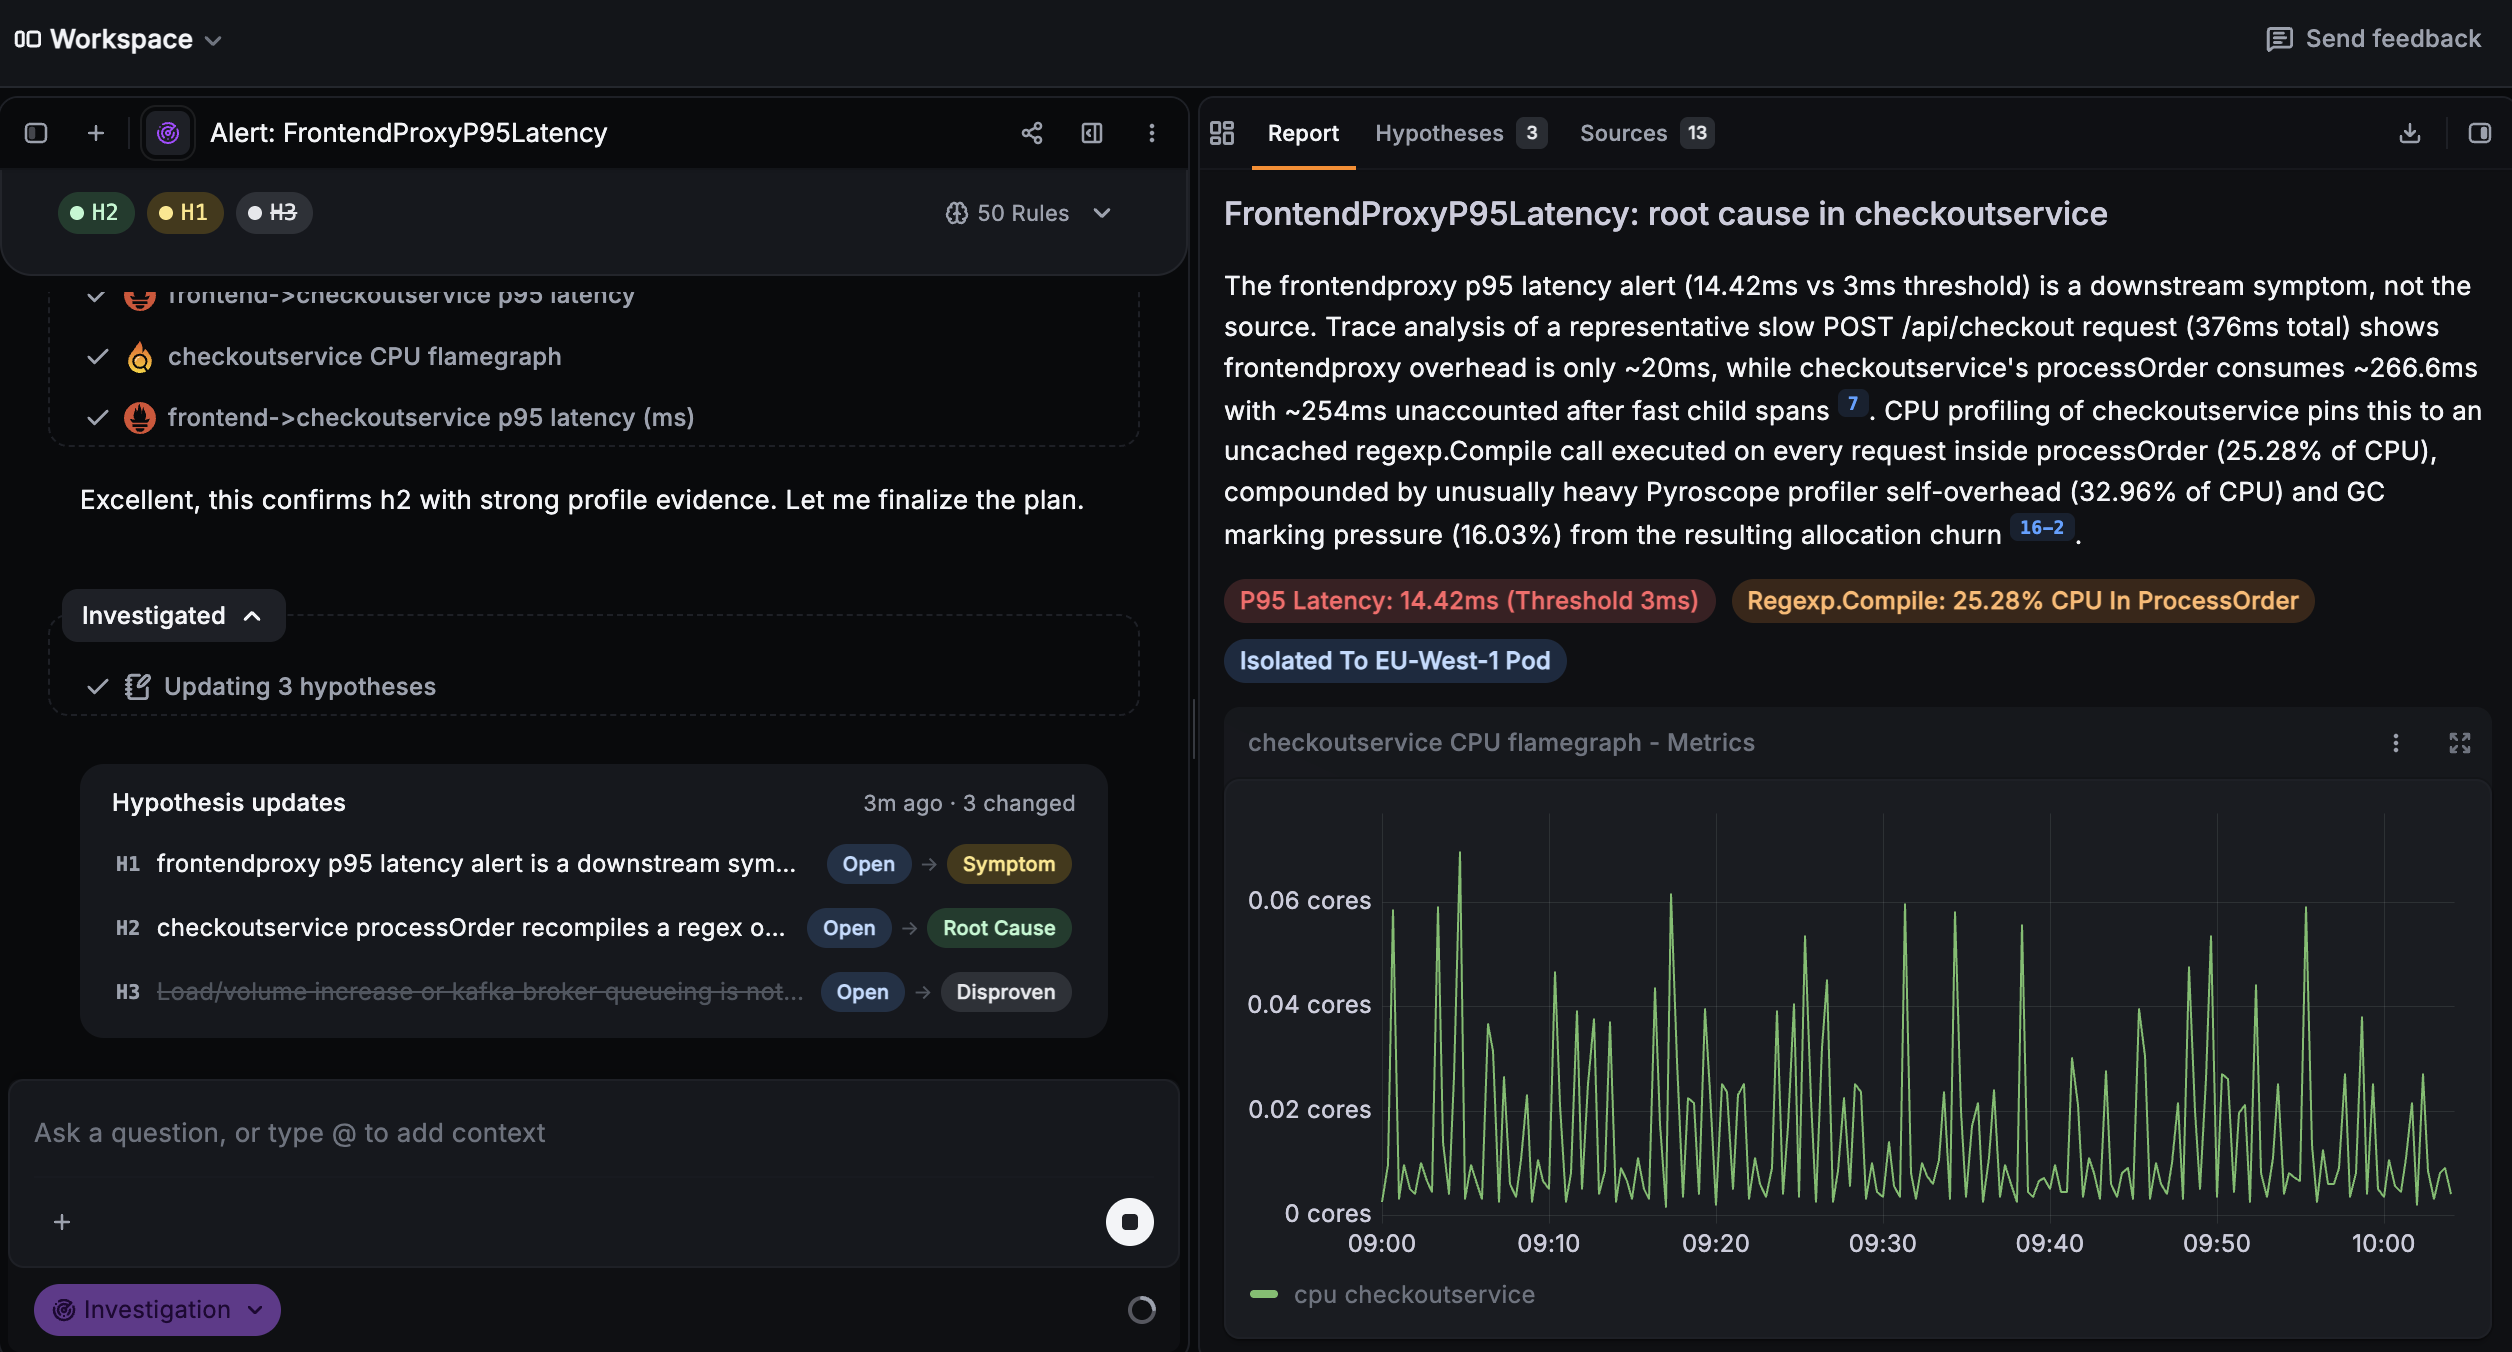
Assistant Investigations is now generally available. It’s Grafana Assistant’s way of running longer, deeper investigations for you: point it at an alert or incident, and it explores your metrics, logs, traces, and profiles, builds hypotheses as it learns more, and produces a structured report with findings, supporting evidence, and recommended next steps.
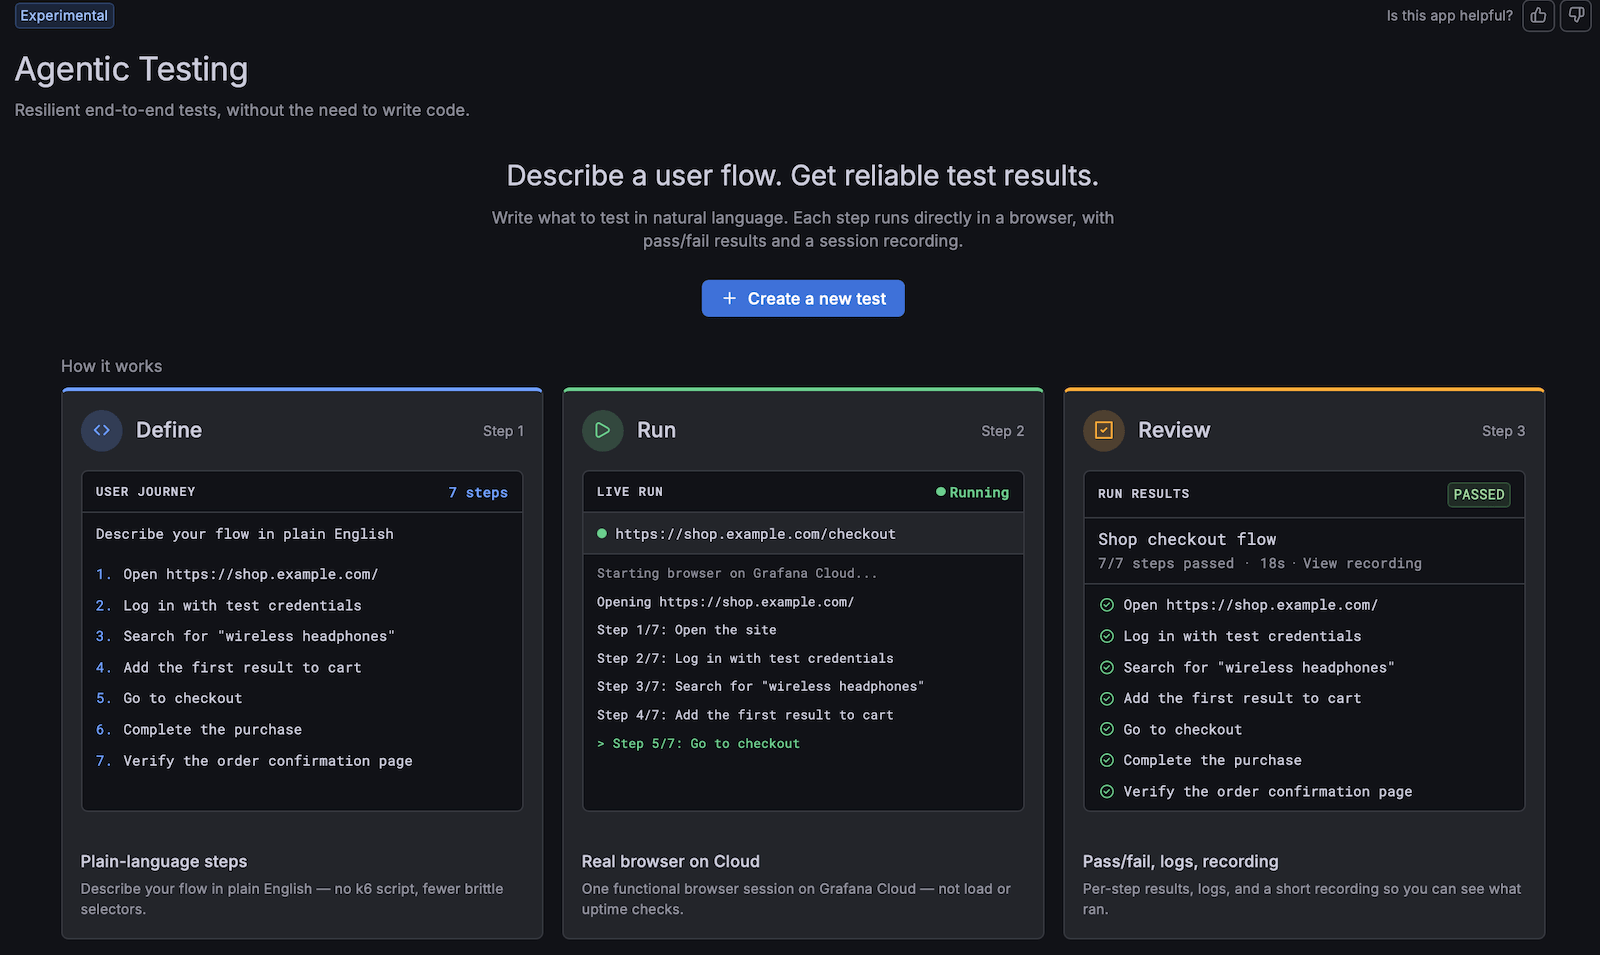
With Agentic Testing, describe a user flow in plain language, like “log in, add an item, check out,” and an agent runs it in a real browser on Grafana Cloud: locating elements, adapting to UI changes, navigating unexpected states, and verifying the result looks right. No brittle selectors to maintain, no scripts to babysit.
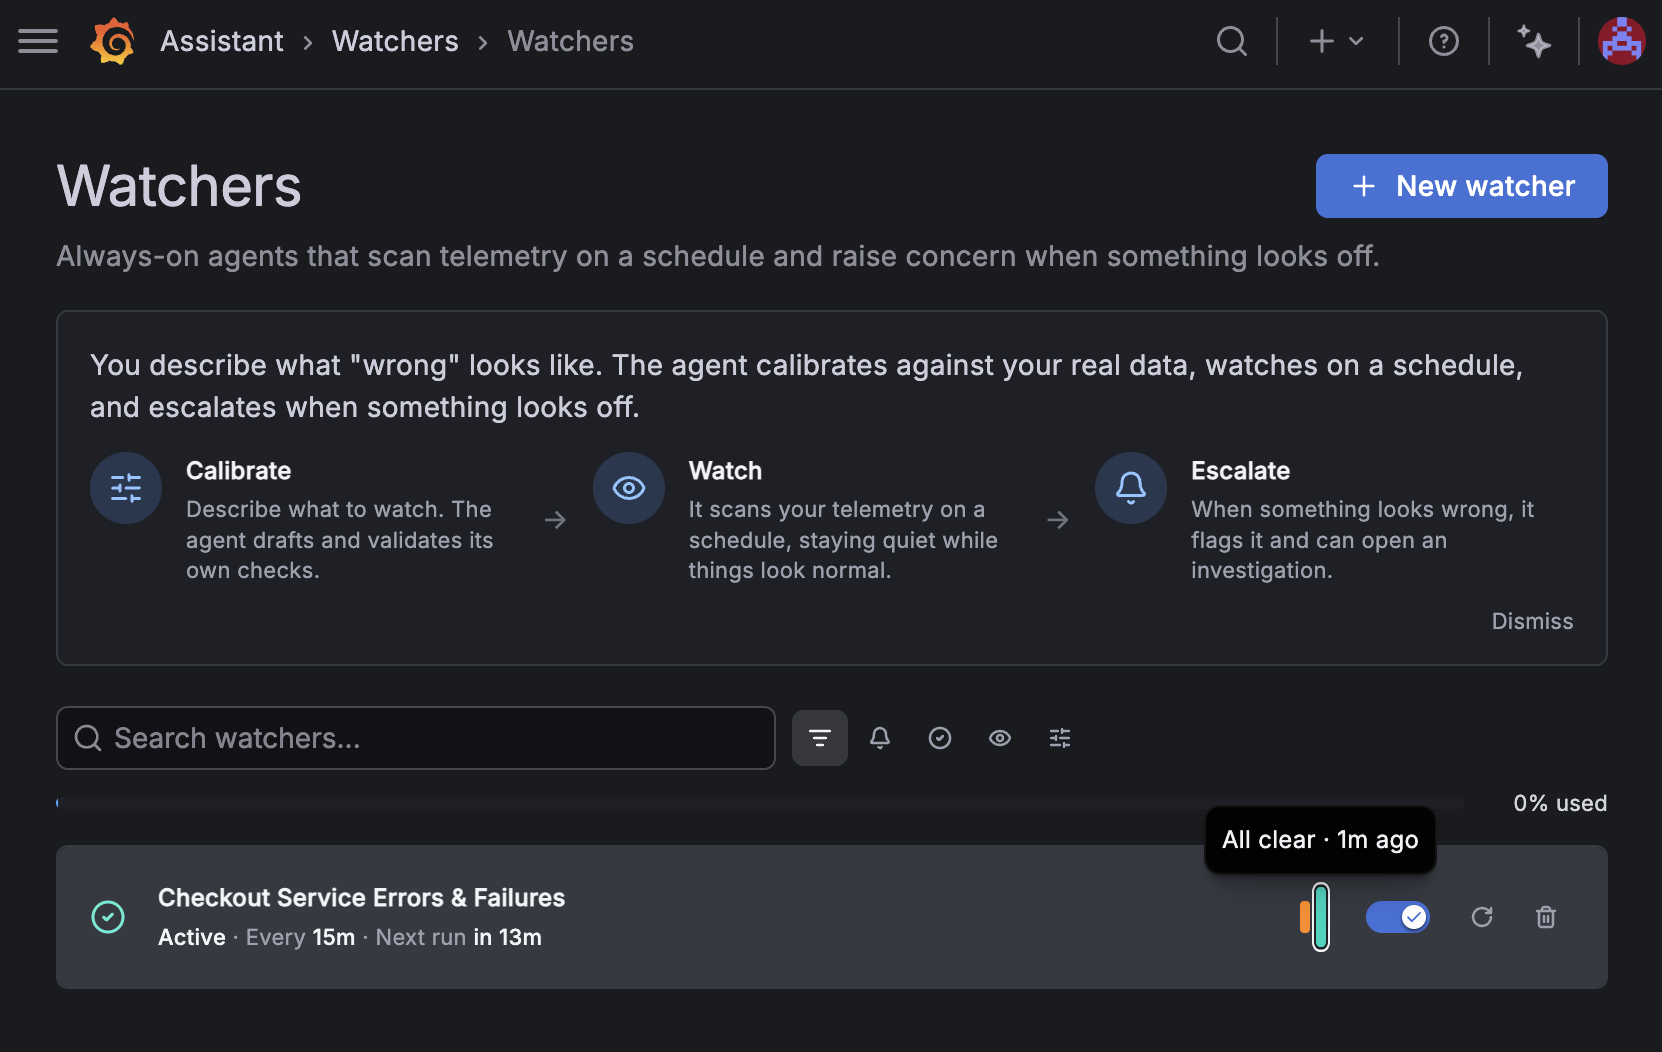
Watchers are a new Grafana Assistant capability that add an agentic option alongside your existing alerts. They’re built for the cases that are hard to express as a traditional rule: sometimes you can’t spell out every way something can go “wrong,” but you know exactly what “right” looks like. Ask the Assistant to set up a Watcher, describe what healthy looks like, and it keeps watch for when reality starts to drift.
Maintenance windows are now available for Grafana SLOs. Use maintenance windows to schedule planned work for one or more service level objectives (SLOs). During an active maintenance window, Grafana SLO pauses error budget consumption and burn rate alerting for the selected SLOs.
As part of AI Week, we’re shipping a restructured information architecture (IA) for Grafana Cloud docs. The new navigation makes it easier to find the right docs by grouping content around how you work in Grafana Cloud, with a clear home for AI capabilities.
This change reflects how the platform has actually grown.
The new structure groups everything into four sections:
- Platform - cross-cutting capabilities that support Grafana Cloud’s product suite
- Observe and act - the task-oriented home for monitoring, alerting, incident response, testing, and data connections, where product names (Alerting, IRM, SLO) now live on landing pages instead of in the navigation.
- AI tools - infrastructure-level AI capabilities (MCP server, Dynamic alerting, gcx, the LLM plugin) that enhance workflows rather than standing alone.
- Learn and build - Grafana Learn, get started, conceptual content, dashboard-building, and developer resources.