Shaping the future of observability
Grafana Labs CEO Raj Dutt discusses how we're reimagining SaaS economics and simplifying complexity.

Full-stack observability with Grafana Cloud
Trusted by everyone from startups to the Fortune 500
Use Grafana Assistant to understand production telemetry, Investigations to accelerate root cause analysis, and Agent Observability to evaluate and improve production AI agents. All in one OpenTelemetry-native platform.
Our open observability cloud includes incident response, testing, synthetic monitoring, and more, built on open standards and usable by individual teams or across an organization.


Grafana Labs CEO Raj Dutt discusses how we're reimagining SaaS economics and simplifying complexity.
July 27-31: Learn how teams are using observability to confidently operate AI-powered systems at scale.

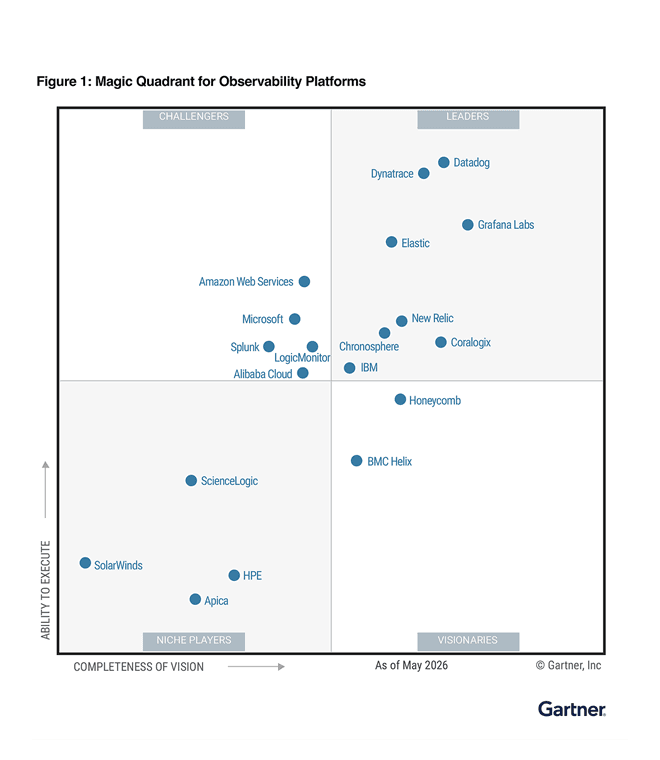
Gartner evaluated 19 vendors based on their Ability to Execute and Completeness of Vision, and Grafana Labs was positioned furthest in Completeness of Vision.
AI-powered workflows, new Grafana capabilities, and what’s coming next in open source observability. Everything announced at GrafanaCON 2026 in one place.

Explore insights from the industry’s largest community-driven survey on the evolving state of observability.

Grafana Labs CEO Raj Dutt discusses how we're reimagining SaaS economics and simplifying complexity.

"This platform is about extracting more information, more connectivity, more value...things that our SREs are beating down the door for us to do. [The constant product evolution] has kept us really excited and we continue to be excited."
Olin GayHead of Observability, BlackRock
Our community pushes the product forward, inspires new ideas, and helps us create better tools for everyone who cares about data and observability.


Welcome to
Built on open source, open standards, and open ecosystems
