OpenStack integration for Grafana Cloud
OpenStack is an open-source cloud computing platform that facilitates the management of large pools of computing, storage, and networking resources in a data center. It provides scalable Infrastructure as a Service (IaaS) with multiple storage options, networking, IAM, monitoring, and more all built-in to the platform.
This integration supports Openstack 2023.2 Bobcat+.
This integration includes 24 useful alerts and 5 pre-built dashboards to help monitor and visualize OpenStack metrics and logs.
Before you begin
OpenStack prometheus exporter
This integration supports metrics and logs from an OpenStack cloud. It is configured to work with the OpenStack Prometheus Exporter, which must be installed and configured separately from Grafana Alloy. Follow instructions in exporter repo to configure the exporter, referring to /etc/openstack/clouds.yaml for the possible names of clouds to monitor.
Logging to a file (optional)
This integration collects logs from journald, assuming that logging to a file is not configured. If you wish to configure a log file for your OpenStack services:
- Create a
<service>.logfile. - Edit the
<service>.conffile to includelog_fileandlevelconfig options.
log_file = /Path/to/log/dir/<service>.log
level = WARNING- Other possible
leveloptions areDEBUG,INFO, andERROR.
- Restart the service:
systemctl restart <service-name>- Repeat steps 1-3 for each service.
Install OpenStack integration for Grafana Cloud
- In your Grafana Cloud stack, click Connections in the left-hand menu.
- Find OpenStack and click its tile to open the integration.
- Review the prerequisites in the Configuration Details tab and set up Grafana Alloy to send OpenStack metrics and logs to your Grafana Cloud instance.
- Click Install to add this integration’s pre-built dashboards and alerts to your Grafana Cloud instance, and you can start monitoring your OpenStack setup.
Configuration snippets for Grafana Alloy
Simple mode
These snippets are configured to scrape a single OpenStack cloud with Grafana Alloy running locally.
Copy and Paste the following snippets into your Grafana Alloy configuration file.
Metrics snippets
discovery.relabel "openstack_metrics" {
  targets = [{
    __address__ = "localhost:9090",
  }]

  rule {
    target_label = "instance"
    replacement  = constants.hostname
  }
}

prometheus.scrape "openstack_metrics" {
  targets      = discovery.relabel.openstack_metrics.output
  forward_to   = [prometheus.remote_write.metrics_service.receiver]
  job_name     = "integrations/openstack"
  metrics_path = "/metrics"
}
Logs snippets
all
loki.process "logs_integrations_openstack" {
  forward_to = [loki.write.grafana_cloud_loki.receiver]
  stage.multiline {
    firstline = "(?P<level>(DEBUG|INFO|WARNING|ERROR)) "
  }
  stage.regex {
    expression = "(?P<level>(DEBUG|INFO|WARNING|ERROR)) (?P<service>\\w+)[\\w|.]+ (\\[.*] )(?P<message>.*)"
  }
  stage.labels {
    values = {
      level     = "",
      service   = "",
    }
  }
}
loki.relabel "logs_integrations_openstack" {
  forward_to = [loki.process.logs_integrations_openstack.receiver]

  rule {
    source_labels = ["__journal_systemd_unit"]
    target_label  = "unit"
  }
}
loki.source.journal "logs_integrations_openstack" {
  max_age = "12h"
  labels  = {
    job      = "integrations/openstack",
    instance = constants.hostname,
  }
  forward_to = [loki.process.logs_integrations_openstack.receiver]
}
Advanced mode
The following snippets provide examples to guide you through the configuration process.
To instruct Grafana Alloy to scrape your OpenStack cloud, manually copy and append the snippets to your alloy configuration file, then follow subsequent instructions.
Advanced metrics snippets
discovery.relabel "openstack_metrics" {
  targets = [{
    __address__ = "localhost:9090",
  }]

  rule {
    target_label = "instance"
    replacement  = constants.hostname
  }
}

prometheus.scrape "openstack_metrics" {
  targets      = discovery.relabel.openstack_metrics.output
  forward_to   = [prometheus.remote_write.metrics_service.receiver]
  job_name     = "integrations/openstack"
  metrics_path = "/metrics"
}
To monitor an OpenStack instance, you must use a discovery.relabel component to discover your OpenStack Prometheus endpoint and apply appropriate labels, followed by a prometheus.scrape component to scrape it.
Configure the following properties within the discovery.relabel component:
__address__: change this fromlocalhost:9090to the host and port of the remote OpenStack Prometheus metrics endpoint.constants.hostname: the snippets set theinstancelabel to your Grafana Alloy server hostname using theconstants.hostnamevariable. If you are running Grafana Alloy outside of your OpenStack server host, change the variable to a value that uniquely identifies it.
If you have multiple OpenStack servers to scrape, configure one discovery.relabel for each and scrape them by including each under targets within the prometheus.scrape component.
Advanced logs snippets
linux
loki.process "logs_integrations_openstack" {
  forward_to = [loki.write.grafana_cloud_loki.receiver]
  stage.multiline {
    firstline = "(?P<level>(DEBUG|INFO|WARNING|ERROR)) "
  }
  stage.regex {
    expression = "(?P<level>(DEBUG|INFO|WARNING|ERROR)) (?P<service>\\w+)[\\w|.]+ (\\[.*] )(?P<message>.*)"
  }
  stage.labels {
    values = {
      level     = "",
      service   = "",
    }
  }
}
loki.relabel "logs_integrations_openstack" {
  forward_to = [loki.process.logs_integrations_openstack.receiver]

  rule {
    source_labels = ["__journal_systemd_unit"]
    target_label  = "unit"
  }
}
loki.source.journal "logs_integrations_openstack" {
  max_age = "12h"
  labels  = {
    job      = "integrations/openstack",
    instance = constants.hostname,
  }
  forward_to = [loki.process.logs_integrations_openstack.receiver]
}
This integration uses the loki.source.journal component to collect OpenStack service logs.
If you configure logging to a file for your OpenStack services, refer to the loki.source.file component documentation.
Dashboards
The OpenStack integration installs the following dashboards in your Grafana Cloud instance to help monitor your system.
- OpenStack Cinder
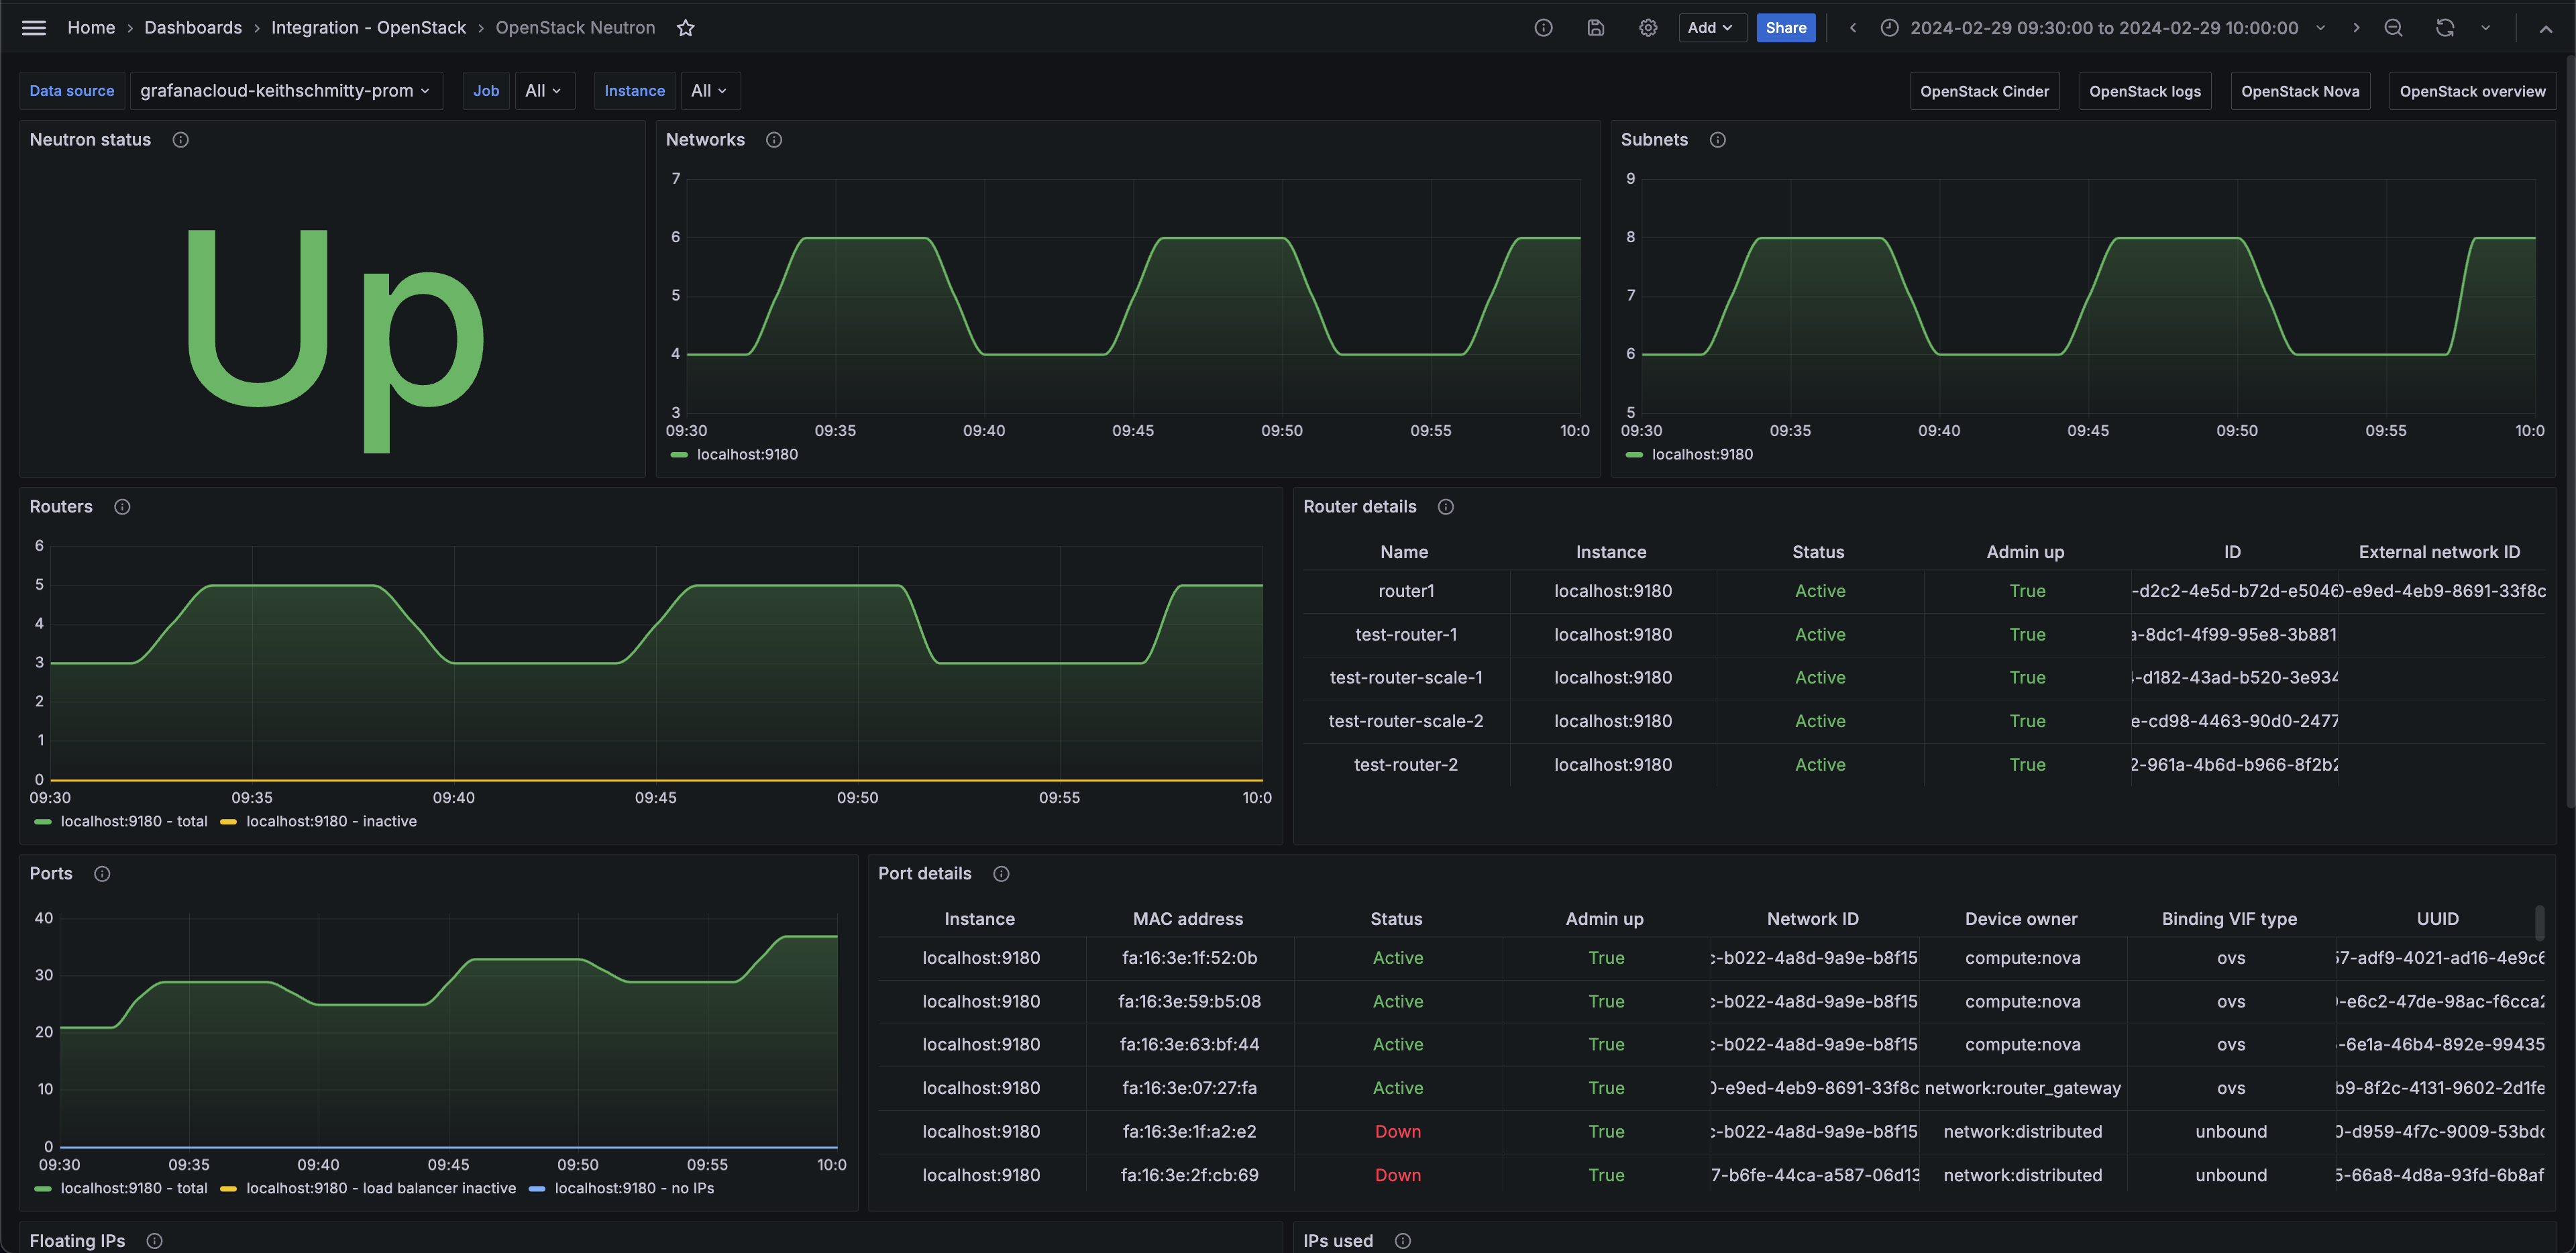
- OpenStack Neutron
- OpenStack Nova
- OpenStack logs
- OpenStack overview
OpenStack overview (services)

OpenStack Nova

OpenStack Neutron (networks)
Alerts
The OpenStack integration includes the following useful alerts:
openstack-alerts-openstack
openstack-nova-alertsopenstack
openstack-neutron-alertsopenstack
openstack-cinder-alertsopenstack
Metrics
The most important metrics provided by the OpenStack integration, which are used on the pre-built dashboards and Prometheus alerts, are as follows:
- openstack_cinder_agent_state
- openstack_cinder_limits_backup_max_gb
- openstack_cinder_limits_backup_used_gb
- openstack_cinder_limits_volume_max_gb
- openstack_cinder_limits_volume_used_gb
- openstack_cinder_pool_capacity_free_gb
- openstack_cinder_pool_capacity_total_gb
- openstack_cinder_snapshots
- openstack_cinder_up
- openstack_cinder_volume_status_counter
- openstack_cinder_volumes
- openstack_glance_image_bytes
- openstack_glance_images
- openstack_glance_up
- openstack_heat_up
- openstack_identity_domains
- openstack_identity_project_info
- openstack_identity_projects
- openstack_identity_regions
- openstack_identity_up
- openstack_identity_users
- openstack_neutron_agent_state
- openstack_neutron_floating_ips
- openstack_neutron_floating_ips_associated_not_active
- openstack_neutron_l3_agent_of_router
- openstack_neutron_network_ip_availabilities_total
- openstack_neutron_network_ip_availabilities_used
- openstack_neutron_networks
- openstack_neutron_port
- openstack_neutron_ports
- openstack_neutron_ports_lb_not_active
- openstack_neutron_ports_no_ips
- openstack_neutron_router
- openstack_neutron_routers
- openstack_neutron_routers_not_active
- openstack_neutron_security_groups
- openstack_neutron_subnets
- openstack_neutron_up
- openstack_nova_agent_state
- openstack_nova_limits_instances_max
- openstack_nova_limits_instances_used
- openstack_nova_limits_memory_max
- openstack_nova_limits_memory_used
- openstack_nova_limits_vcpus_max
- openstack_nova_limits_vcpus_used
- openstack_nova_total_vms
- openstack_nova_up
- openstack_placement_resource_total
- openstack_placement_resource_usage
- openstack_placement_up
- up
Changelog
# 1.1.1 - November 2024

- Update status panel check queries

# 1.1.0 - July 2024

- Mixin updates:
  - Add new alerts
  - Update panels

# 1.0.0 - March 2024

- Initial release
Cost
By connecting your OpenStack instance to Grafana Cloud, you might incur charges. To view information on the number of active series that your Grafana Cloud account uses for metrics included in each Cloud tier, see Active series and dpm usage and Cloud tier pricing.


