Documentation for automated readers
A curated documentation index is available at: https://grafana.com/llms.txt
A complete documentation index is available at: https://grafana.com/llms-full.txt
These indexes can help with page discovery before fetching individual documents.
This page is also available in Markdown, which may be easier for automated readers and AI tools to parse than HTML. The Markdown version is available at https://grafana.com/docs/grafana-cloud/alerting-and-irm/alerting/monitor-status.md, or by sending Accept: text/markdown to https://grafana.com/docs/grafana-cloud/alerting-and-irm/alerting/monitor-status/. For broader documentation discovery, the curated index is available at https://grafana.com/llms.txt and the complete index is available at https://grafana.com/llms-full.txt.
Monitor alerts
Alerts and alert notifications should provide key information to help alert responders and incident participants understand what happened in their system and how to respond.
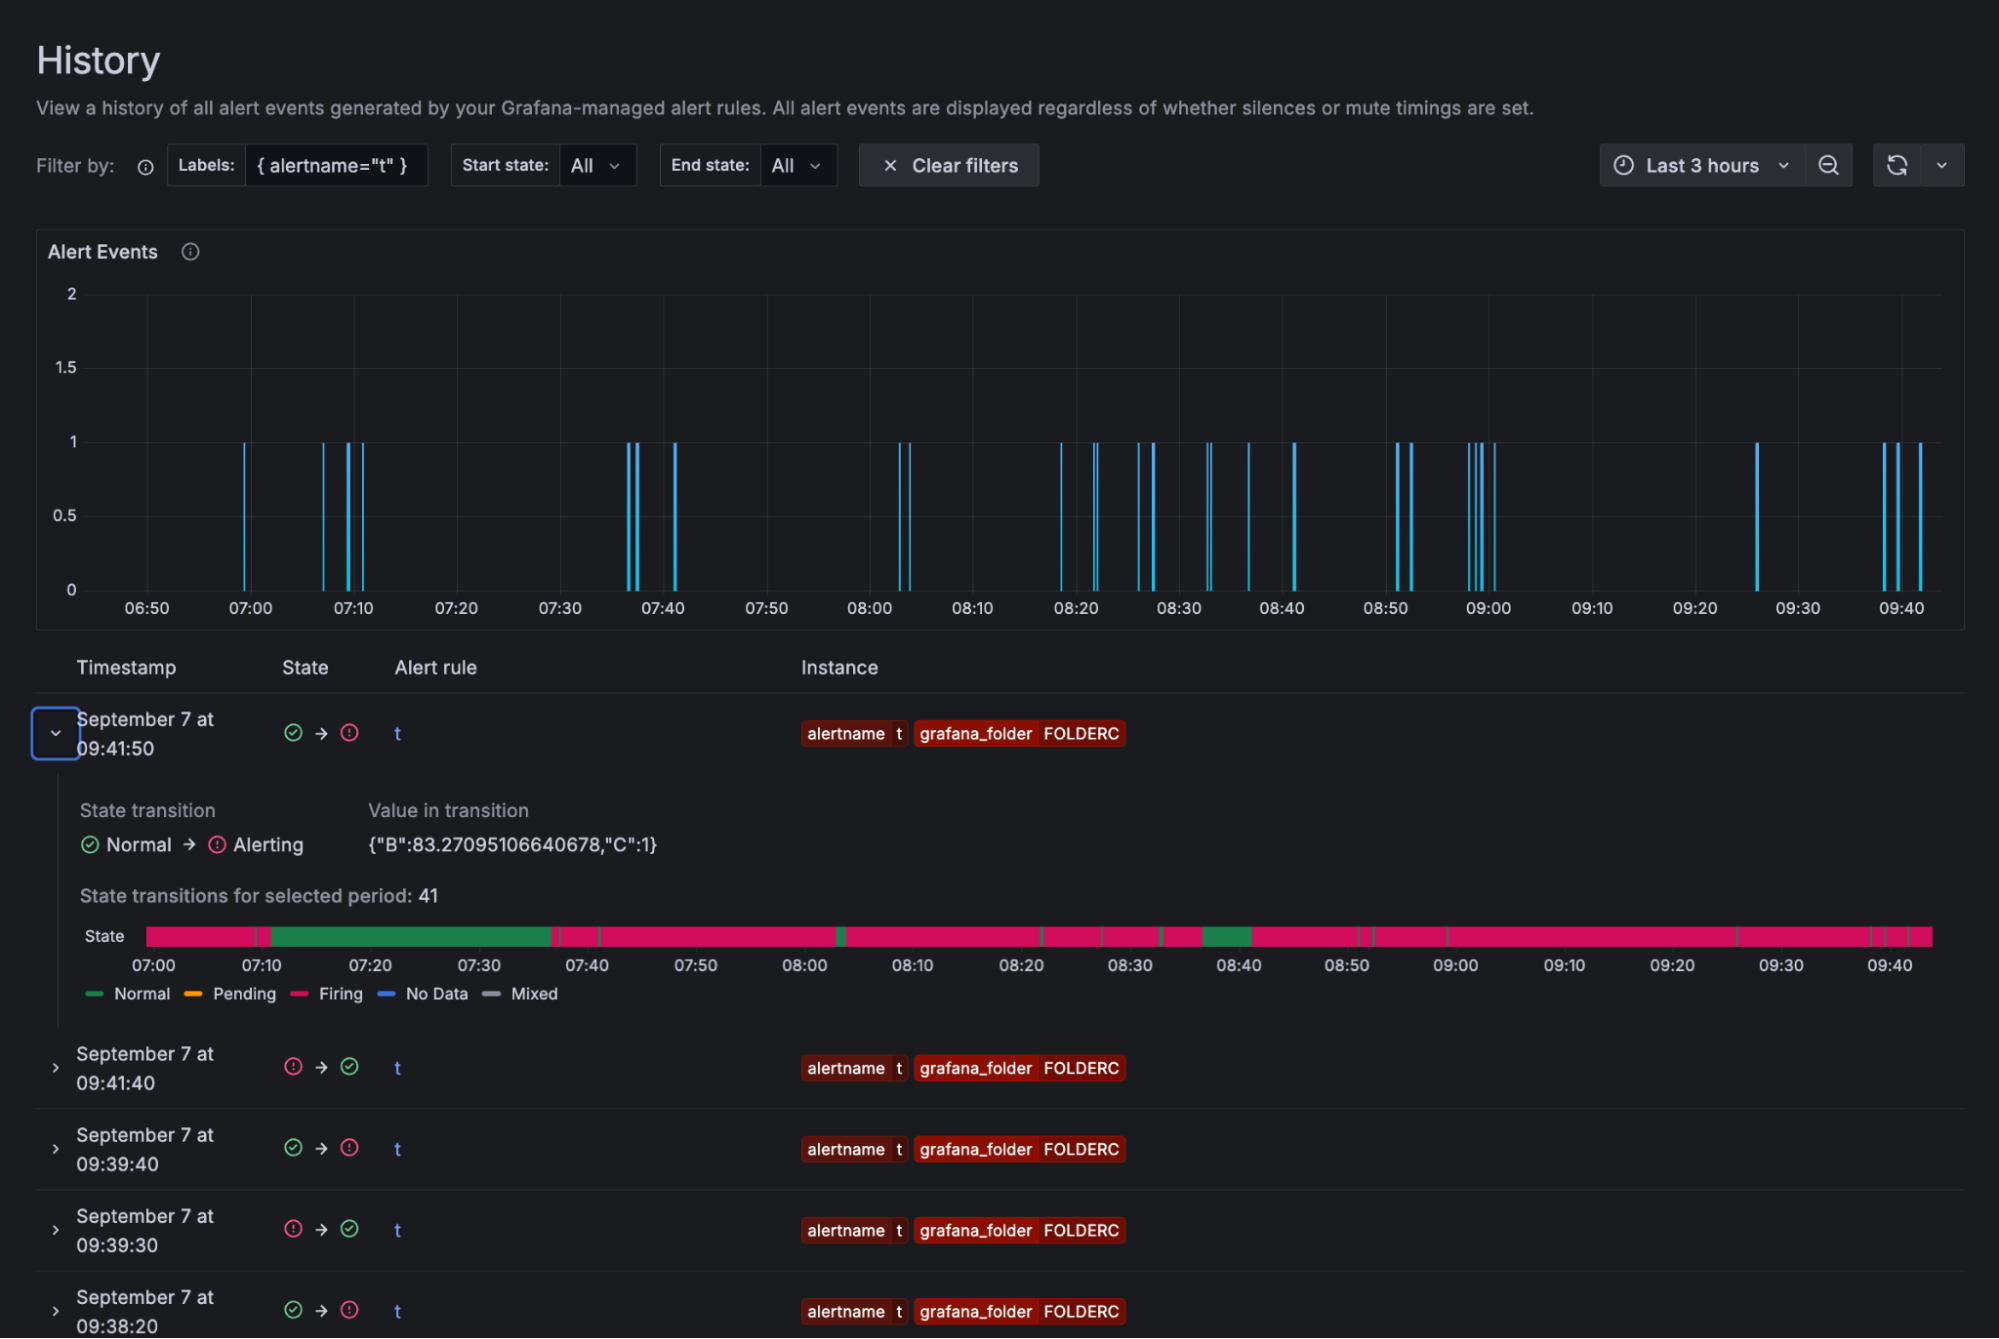
Grafana Alerting offers the ability to monitor your alerts and manage your alerting setup. You can get an overview of your alerts, track the history of alert states, and monitor notification statuses. These can help you start investigating alert issues within Grafana and improve the reliability of your alerting implementation.

The previous sections explain how to configure alert rules and configure notifications to generate alerts and send their notifications.
This section focuses on finding and understanding the state of your alert rules, alert instances, and their notifications. For more details, refer to:
Was this page helpful?
Related resources from Grafana Labs


