Metrics and visualizations
Metrics tell you how much of something exists, such as how much memory a computer system has available or how many centimeters long a desktop is. In the case of Grafana, metrics are most useful when they are recorded repeatedly over time. This permits us to compare things like how running a program affects the availability of system resources.
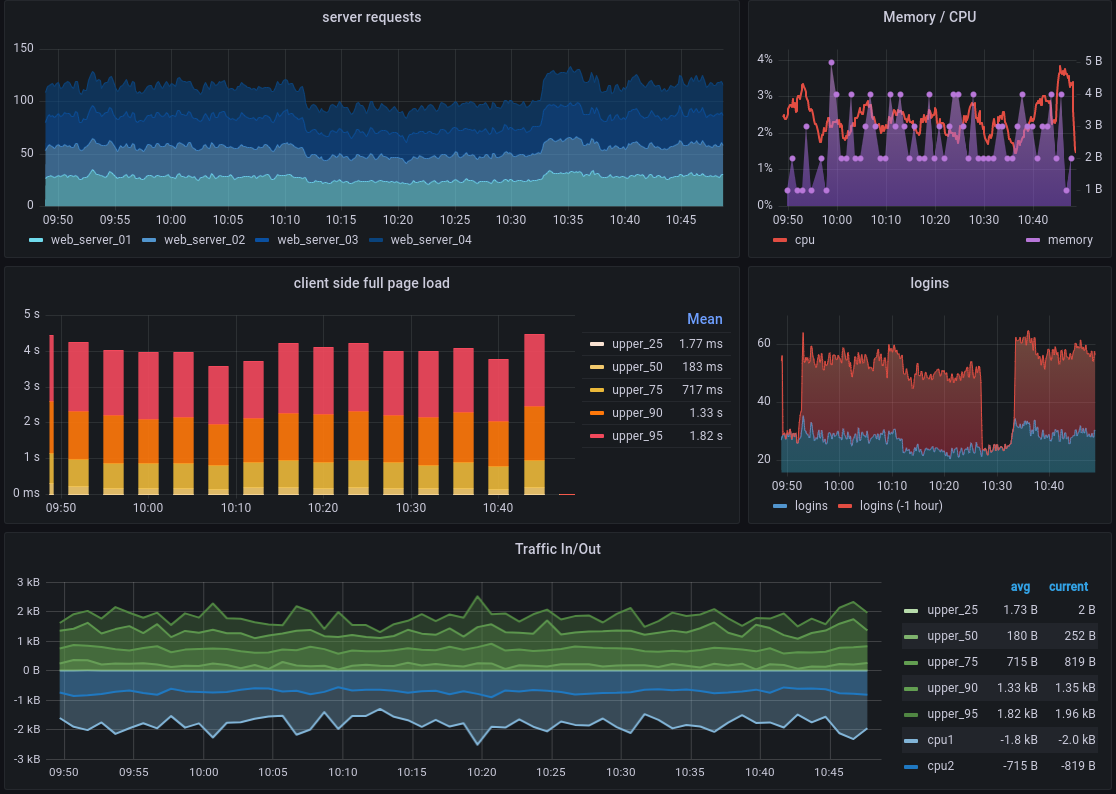
Metrics like these are stored in a time series database (TSDB), like Prometheus, by recording a metric and pairing that entry with a time stamp. Each TSDB uses a slightly different data model, but all combine these two aspects and Grafana Cloud can accept their different metrics formats for visualization.
For example, one might be interested in comparing system I/O performance as the number of users increases during a morning while many users in a company come online to start their work days.
A chart showing this change of resource use across time is an example of a visualization. Comparing these time-stamped metrics over time using visualizations makes it quick and easy to see changes to a computer system, especially as events occur.
Grafana and Grafana Cloud offer a variety of visualizations to suit different use cases. See the Grafana documentation on visualizations for more information.


