Metrics-generator in Grafana Cloud Traces
The Tempo metrics-generator can derive metrics from traces as they are ingested. When used in Grafana Cloud, the metrics-generator writes metrics directly to the hosted Prometheus instance in the same stack.

For more information about the metrics-generator and the metrics it creates, refer to the metrics-generator documentation.
Note
The metrics-generator is in active development. Currently, in very rare cases, data available for TraceQL search is not recorded in span or service graph metrics. Tempo is making architectural changes to promote span, service graph, and TraceQL metrics to have the same durability guarantees as TraceQL search.
TraceQL metrics and metrics-generator
Note
TraceQL metrics is currently in public preview. Grafana Labs offers limited support, and breaking changes might occur prior to the feature being made generally available.
TraceQL metrics, powered by the API of the same name, return Prometheus-like time series for a given metrics query.
Metrics queries apply a function to trace query results.
TraceQL metrics use the local_blocks processor in metrics-generator.
TraceQL metrics queries allows you to calculate metrics on trace span data on-the-fly with Cloud Traces or Tempo (your tracing database), without requiring a time-series-database like Prometheus.
TraceQL metrics can query metrics for a time range of 24 hours. Contact Grafana Support if you need to increase this time range.
For more information about TraceQL metrics, refer to TraceQL metrics.
Enable metrics-generator
Metrics-generation is disabled by default. You can enable it for use with Application Observability defaults in Application Observability, or contact Grafana Support to enable metrics-generation for your organization with custom settings.
To enable or disable metrics generation, go to the Application Observability Configuration page, under the System tab in your Grafana Cloud stack.
For more details, refer to Configure Application Observability.
Limitations
Enabling metrics-generator using Application Observability has limitations.
By default, Application Observability configures the metrics-generator to only generate metrics for the SERVER and CONSUMER span kinds.
Application Observability can be further configured to also generate metrics for CLIENT and PRODUCER span kinds, refer to Include web applications and mobile devices for more details.
If you need to generate span metrics for the INTERNAL span kind, contact Support.
Constraints and good to know
- The active series sent to the hosted Prometheus instance is billed like regular metrics.
- Metrics can only be sent to a hosted Prometheus instance in the same region.
- If traces are down-sampled before reaching Tempo, the metrics will be lower than reality.
- All generated metrics are aggregated by default.
Aggregated metrics
Grafana Cloud uses Adaptive Metrics to aggregate away operational labels added by the open source Tempo metrics-generator. This reduces the number of time series produced by the metrics-generator, and therefore reduces the cost of enabling metrics generation for Grafana Cloud users.
In most cases, this aggregation should be completely unnoticeable to users.
If you require unaggregated metrics generated by Grafana Cloud Traces, contact Grafana Support for help removing the aggregation rules from Adaptive Metrics.
Note
In addition to Adaptive Metrics aggregation, Grafana Cloud also offers Adaptive Traces, which intelligently identifies and retains your most valuable trace data to optimize storage costs while preserving critical observability insights.
Monitor the metrics-generator
The grafanacloud-usage data source exposes several metrics about the metrics-generator.
Amount of active series:
grafanacloud_traces_instance_metrics_generator_active_series{}Amount of active series being limited:
grafanacloud_traces_instance_metrics_generator_series_dropped_per_second{}Amount of spans that are discarded by the metrics-generator before the spans are processed:
grafanacloud_traces_instance_metrics_generator_discarded_spans_per_secondThis metric has a reason label:
outside_metrics_ingestion_slack: The time between the creation of the span and when it was ingested was too large and the span is deemed outdated. Processing this span and including it a current metrics sample would skew the data.
Estimated cardinality demand per label. Use this to identify which labels have high cardinality and whether they are approaching or exceeding the per-label cardinality limit:
grafanacloud_traces_instance_metrics_generator_label_cardinality_demand_estimate{}Rate at which label values are being replaced with __cardinality_overflow__ due to per-label cardinality limiting. A non-zero value means the label is actively being capped:
grafanacloud_traces_instance_metrics_generator_label_values_limited_per_second{}Both metrics include a label_name label to identify the specific label being affected. Refer to
Per-label cardinality limiting for more details.
How this works
When the amount of active series in Tempo reaches a configurable limit, no new active series are added. Grafana Cloud Traces keeps updating the existing series. The series exceeding the limit are dropped.
Configuration options
You can configure the following settings for metrics-generator in Grafana Cloud Traces. Contact Grafana Support to modify any of these settings.
Note
Characters that aren’t valid Prometheus labels are sanitized. For example, the trace attribute
k8s.namespacebecomes the Prometheus labelk8s_namespace.
FAQ
Why generate metrics if traces are available?
Metrics provide fast, low-cost aggregation and alerting (for example, RED metrics and service graphs). Traces remain the source of truth for details and root cause. Using both gives performance and fidelity.
How many active series should be expected?
Active series depends on enabled processors, dimensions, traffic shape, and Adaptive Metrics aggregation. Monitor with grafanacloud_traces_instance_metrics_generator_active_series{}. Contact Support if you need higher limits or metrics without aggregation.
Can metrics be generated locally instead of in Grafana Cloud?
Yes. You can generate span metrics in an OpenTelemetry-based pipeline. Ensure the generator receives all spans for a trace to avoid incomplete metrics. For Cloud-managed generation, open a Support request.
Why do some exemplars link to missing traces?
Exemplars can be emitted before tail sampling decisions. If a trace is later dropped by sampling, the exemplar points to a trace that no longer exists in storage. This is expected behavior.
Troubleshoot errors
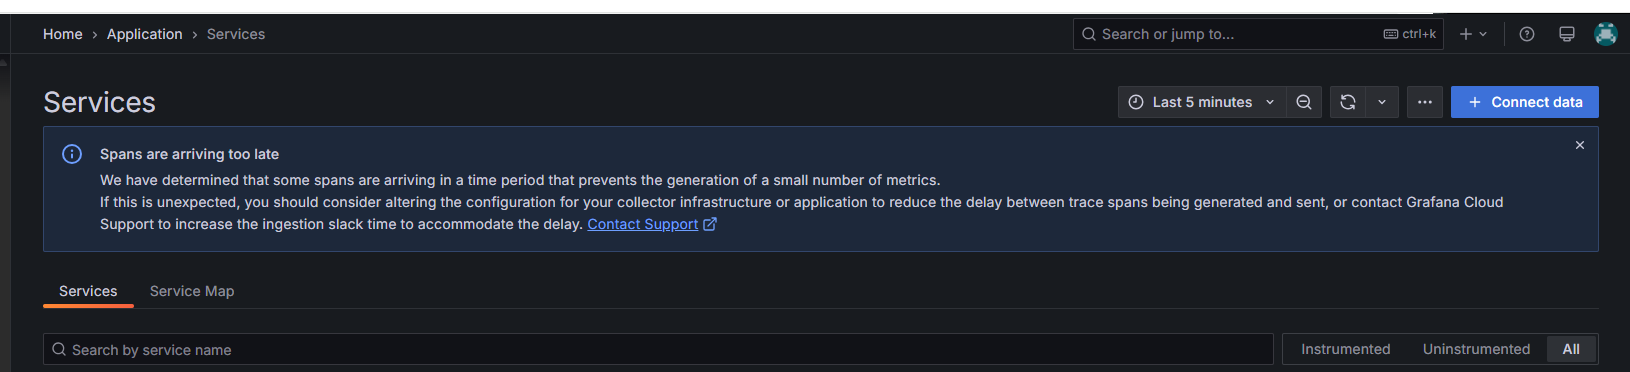
Spans arrive too late warning
The Spans are arriving too late message in Application Observability means some spans ingested into Grafana Cloud Traces aren’t used to generate metrics.
These spans remain available in Grafana Cloud Traces for querying with TraceQL and can be rendered as part of the trace the spans belong to.
Spans arrive too late when their end time is earlier than the slack period configured in Grafana Cloud Traces. By default, this slack period is 30 seconds. The metrics-generator discards spans that end earlier than the 30 second period before they are processed. Any relevant metrics for those spans aren’t updated.
For example, span counts and total call times for specific spans aren’t incremented.
Application Observability relies on the metrics generated from incoming spans. When these spans are discarded, then a service’s RED metrics (such as P95, error rate, and request rate) don’t provide completely accurate data.
Discarded spans don’t appear in PromQL queries executed against metrics generated by incoming spans to Grafana Cloud Traces. Because the spans were discarded by the metrics-generator, you receive a skewed view of your span data. TraceQL metrics queries show data as expected, because all of the spans are stored in Grafana Cloud Traces.
Note
If metrics generation happens locally in an OpenTelemetry-based pipeline, span metrics depend on the connector’s position in the pipeline. As long as the metrics-generator receives all spans for a trace, it can generate a complete metrics view.
Possible causes and workarounds
Request increased slack time
To ensure that metrics are generated from delayed spans, submit a request to Grafana Support. Ask support to increase the metrics-generator slack period for the Grafana Cloud Traces stack that has the delayed span message.
When submitting your request, suggest a period of time between span generation and when you believe spans are ingested into Grafana Cloud Traces. This estimate helps Support determine an appropriate slack period.
Increasing the slack period allows spans that ended further in the past to update metrics values.
This increase reduces the granularity of metrics data generated by spans. The higher the slack time set, the lower the granularity. For example, a 2-minute slack period means metrics data has a minimum granularity of 2 minutes, compared to the default 30 seconds. In this case, you can’t distinctly pinpoint when spans with particular characteristics occurred within that period.
Tail sampling processor
Some components of the OpenTelemetry pipeline can cause this delay. The tail sampling processor evaluates all spans for a trace and determines if any spans match specific criteria. The tail sampling processor includes a decision duration wait period. No decision is made until the time from the first span for a trace is greater than that wait period. Spans are forwarded to another destination, like Grafana Cloud, until the wait period expires. This can cause data to arrive outside the metrics-generator slack period.
The default wait period is 30 seconds. Because of this, very short traces (less than one second), all of the spans for a trace might be discarded by the metrics-generator. Short traces (less than one second) or early spans in longer traces may be discarded if they fall outside the slack period.
To reduce delays caused by the tail sampling processor:
If the average duration of a trace is less than 30 seconds, reduce the decision wait period to that of the longest expected traces. For high-latency traces, set the duration threshold to the longest expected trace time or less.
Reduce the decision wait period to a value spans are likely to arrive if traces are usually longer than 30 seconds and initial spans are more likely to let a decision be made. This ensures a decision is made before the end of the trace. Use a sample/discard cache to complement a shorter wait period. Refer to Tail sampling and caching for details.
Split long-running traces into smaller sets of more distinct traces. Use span linking to ensure that related traces can still be correlated against. Then, reduce the decision wait period to ensure decisions occur within the 30 second period.
Service meshes
Service meshes can introduce networking delays. Meshes tend to be used for functionality, such as packet inspection, applying network policies, and proxying between meshes and VPC networks. Sidecars are heavily used within service meshes, which can also delay traffic.
Delays in traffic routing are not usually significant. When coupled with other factors such as tail sampling and mass batching, a service mesh can add enough delay that spans arrive too late.
To minimize latency, place the observability pipeline as close to the network edge as possible.
Other potential factors
In general, any situation that can introduce latency between the emission of a trace span from an instrumented service and the receiving of that span by Grafana Cloud Traces can add towards the probability of spans arriving too late for the metrics-generator to produce relevant metrics for them.
For example, batch processing can introduce latency. The OpenTelemetry batch processor lets you configure batch sizes and timeouts before flushing. If the timeout and batch sizes are particularly large, spans are delivered outside of the metric-generator’s slack period because of the added latency. The tail sampling processor can compound this. For example, a 25s decision period in the tail sampling processor, followed by a 10s batch timeout period. Consider tuning both the size and timeout periods for the batch processor if you are seeing issues.
By tuning the decision period and using decision caches in the tail sampling processor, configuring service meshes and other buffering network components in your infrastructure, and asking for a change in the slack period via a Grafana Support, you can greatly reduce the chances of spans being discarded by the metrics-generator.


