Apache Solr integration for Grafana Cloud
Apache Solr is an open-source search platform built on Apache Lucene, known for its powerful full-text search, scalability, and real-time indexing capabilities. It supports a wide range of document formats and offers features like faceted search, geospatial search, and rich document handling. The integration with Grafana Cloud enables users to oversee a Solr environment using distinct dashboards. These dashboards display metrics and logs for Solr clusters, query performance, resource monitoring, and logs.
This integration supports Apache Solr 8.11.2 and uses the built in prometheus exporter.
This integration includes 8 useful alerts and 4 pre-built dashboards to help monitor and visualize Apache Solr metrics and logs.
Before you begin
In order for the integration to properly work, it is essential to implement the built-in Prometheus Exporter on each cluster instance.
Initiating the Prometheus Exporter
Initiate the Prometheus Exporter in Apache Solr either in a Standalone or SolrCloud mode by navigating to contrib/prometheus-exporter on your Solr instance and applying relevant command line parameters as demonstrated below.
For Linux, initiate the Prometheus Exporter in SolrCloud mode with:./bin/solr-exporter -p 9854 -z localhost:2181/solr -f ./conf/solr-exporter-config.xml -n 16
For Windows, initiate the Prometheus Exporter in SolrCloud mode with:.\bin\solr-exporter -p 9854 -z localhost:2181/solr -f .\conf\solr-exporter-config.xml -n 16
In cases where SolrCloud mode operates with a ZooKeeper ensemble, set the -z zkhost value as a string zk1,zk2,zk3.
Validate the Prometheus Exporter
Upon activation, the Prometheus Exporter will report the metrics. The full metric list will be shown when there is an active ZooKeeper ensemble setup and a Solr Collection created. To validate that the Prometheus Exporter is setup correctly, the Prometheus metrics are accessible locally via curl:
curl http://localhost:9854/metricsConfigure logs location.
No additional configuration is required for the collection of Apache Solr logs. By default, logs are written to the SOLR_LOGS_DIR, located at /var/solr/logs on Linux or sever/logs on Windows.
Install Apache Solr integration for Grafana Cloud
- In your Grafana Cloud stack, click Connections in the left-hand menu.
- Find Apache Solr and click its tile to open the integration.
- Review the prerequisites in the Configuration Details tab and set up Grafana Alloy to send Apache Solr metrics and logs to your Grafana Cloud instance.
- Click Install to add this integration’s pre-built dashboards and alerts to your Grafana Cloud instance, and you can start monitoring your Apache Solr setup.
Configuration snippets for Grafana Alloy
Advanced mode
The following snippets provide examples to guide you through the configuration process.
To instruct Grafana Alloy to scrape your Apache Solr instances, manually copy and append the snippets to your alloy configuration file, then follow subsequent instructions.
Advanced metrics snippets
prometheus.scrape "metrics_integrations_integrations_apache_solr" {
	targets = [{
		__address__  = "localhost:<your-instance-port>",
		solr_cluster = "<your-solr-cluster-name>",
	}]
	forward_to = [prometheus.remote_write.metrics_service.receiver]
	job_name   = "integrations/apache-solr"
}
To monitor your Apache Solr instance, you must use a discovery.relabel component to discover your Apache Solr Prometheus endpoint and apply appropriate labels, followed by a prometheus.scrape component to scrape it.
Configure the following properties within each discovery.relabel component:
__address__: The address to your Apache Solr Prometheus metrics endpoint.instancelabel:constants.hostnamesets theinstancelabel to your Grafana Alloy server hostname. If that is not suitable, change it to a value uniquely identifies this Apache Solr instance. Make sure this label value is the same for all telemetry data collected for this instance.solr_clusterlabel: This value must identify the Solr cluster this instance belongs to. Use thecluster_idlabel generated by the Prometheus exporter, or specify a custom value for this label.
If you have multiple Apache Solr servers to scrape, configure one discovery.relabel for each and scrape them by including each under targets within the prometheus.scrape component.
Advanced logs snippets
darwin
local.file_match "logs_integrations_integrations_apache_solr" {
	path_targets = [{
		__address__  = "localhost",
		__path__     = "/var/solr/logs/*.log",
		instance     = constants.hostname,
		job          = "integrations/apache-solr",
		solr_cluster = "<your-solr-cluster-name>",
	}]
}

loki.process "logs_integrations_integrations_apache_solr" {
	forward_to = [loki.write.grafana_cloud_loki.receiver]

	stage.multiline {
		firstline     = "^\\d{4}-\\d{2}-\\d{2} \\d{2}:\\d{2}:\\d{2}\\.\\d{3}"
		max_lines     = 0
		max_wait_time = "3s"
	}

	stage.regex {
		expression = "^\\d{4}-\\d{2}-\\d{2} \\d{2}:\\d{2}:\\d{2}\\.\\d{3} (?P<level>\\w+)"
	}

	stage.labels {
		values = {
			level = null,
		}
	}
}

loki.source.file "logs_integrations_integrations_apache_solr" {
	targets    = local.file_match.logs_integrations_integrations_apache_solr.targets
	forward_to = [loki.process.logs_integrations_integrations_apache_solr.receiver]
}
To monitor your Apache Solr instance logs, you will use a combination of the following components:
local.file_match defines where to find the log file to be scraped. Change the following properties according to your environment:
__address__: The Apache Solr instance address__path__: is the Solr logs location or whereSOLR_LOGS_DIRis set. By default this value should be either/var/solr/logs/*.logson Linux orsever/logs/*.logson Windows.instancelabel:constants.hostnamesets theinstancelabel to your Grafana Alloy server hostname. If that is not suitable, change it to a value uniquely identifies this Apache Solr instance. Make sure this label value is the same for all telemetry data collected for this instance.solr_clusterlabel: This value must identify the Solr cluster this instance belongs to. Use thecluster_idlabel generated by the Prometheus exporter, or specify a custom value for this label.
loki.process defines how to process logs before sending it to Loki.
loki.source.file sends logs to Loki.
linux
local.file_match "logs_integrations_integrations_apache_solr" {
	path_targets = [{
		__address__  = "localhost",
		__path__     = "/var/solr/logs/*.log",
		instance     = constants.hostname,
		job          = "integrations/apache-solr",
		solr_cluster = "<your-solr-cluster-name>",
	}]
}

loki.process "logs_integrations_integrations_apache_solr" {
	forward_to = [loki.write.grafana_cloud_loki.receiver]

	stage.multiline {
		firstline     = "^\\d{4}-\\d{2}-\\d{2} \\d{2}:\\d{2}:\\d{2}\\.\\d{3}"
		max_lines     = 0
		max_wait_time = "3s"
	}

	stage.regex {
		expression = "^\\d{4}-\\d{2}-\\d{2} \\d{2}:\\d{2}:\\d{2}\\.\\d{3} (?P<level>\\w+)"
	}

	stage.labels {
		values = {
			level = null,
		}
	}
}

loki.source.file "logs_integrations_integrations_apache_solr" {
	targets    = local.file_match.logs_integrations_integrations_apache_solr.targets
	forward_to = [loki.process.logs_integrations_integrations_apache_solr.receiver]
}
To monitor your Apache Solr instance logs, you will use a combination of the following components:
local.file_match defines where to find the log file to be scraped. Change the following properties according to your environment:
__address__: The Apache Solr instance address__path__: is the Solr logs location or whereSOLR_LOGS_DIRis set. By default this value should be either/var/solr/logs/*.logson Linux orsever/logs/*.logson Windows.instancelabel:constants.hostnamesets theinstancelabel to your Grafana Alloy server hostname. If that is not suitable, change it to a value uniquely identifies this Apache Solr instance. Make sure this label value is the same for all telemetry data collected for this instance.solr_clusterlabel: This value must identify the Solr cluster this instance belongs to. Use thecluster_idlabel generated by the Prometheus exporter, or specify a custom value for this label.
loki.process defines how to process logs before sending it to Loki.
loki.source.file sends logs to Loki.
windows
local.file_match "logs_integrations_integrations_apache_solr" {
	path_targets = [{
		__address__  = "localhost",
		__path__     = "/var/solr/logs/*.log",
		instance     = constants.hostname,
		job          = "integrations/apache-solr",
		solr_cluster = "<your-solr-cluster-name>",
	}]
}

loki.process "logs_integrations_integrations_apache_solr" {
	forward_to = [loki.write.grafana_cloud_loki.receiver]

	stage.multiline {
		firstline     = "^\\d{4}-\\d{2}-\\d{2} \\d{2}:\\d{2}:\\d{2}\\.\\d{3}"
		max_lines     = 0
		max_wait_time = "3s"
	}

	stage.regex {
		expression = "^\\d{4}-\\d{2}-\\d{2} \\d{2}:\\d{2}:\\d{2}\\.\\d{3} (?P<level>\\w+)"
	}

	stage.labels {
		values = {
			level = null,
		}
	}
}

loki.source.file "logs_integrations_integrations_apache_solr" {
	targets    = local.file_match.logs_integrations_integrations_apache_solr.targets
	forward_to = [loki.process.logs_integrations_integrations_apache_solr.receiver]
}
To monitor your Apache Solr instance logs, you will use a combination of the following components:
local.file_match defines where to find the log file to be scraped. Change the following properties according to your environment:
__address__: The Apache Solr instance address__path__: is the Solr logs location or whereSOLR_LOGS_DIRis set. By default this value should be either/var/solr/logs/*.logson Linux orsever/logs/*.logson Windows.instancelabel:constants.hostnamesets theinstancelabel to your Grafana Alloy server hostname. If that is not suitable, change it to a value uniquely identifies this Apache Solr instance. Make sure this label value is the same for all telemetry data collected for this instance.solr_clusterlabel: This value must identify the Solr cluster this instance belongs to. Use thecluster_idlabel generated by the Prometheus exporter, or specify a custom value for this label.
loki.process defines how to process logs before sending it to Loki.
loki.source.file sends logs to Loki.
Kubernetes instructions
Before you begin with Kubernetes
Please note: These instructions assume the use of the Kubernetes Monitoring Helm chart
In order for the integration to properly work, it is essential to implement the built-in Prometheus Exporter on each cluster instance.
Initiating the Prometheus Exporter
Initiate the Prometheus Exporter in Apache Solr either in a Standalone or SolrCloud mode by navigating to contrib/prometheus-exporter on your Solr instance and applying relevant command line parameters as demonstrated below.
For Linux, initiate the Prometheus Exporter in SolrCloud mode with:./bin/solr-exporter -p 9854 -z localhost:2181/solr -f ./conf/solr-exporter-config.xml -n 16
For Windows, initiate the Prometheus Exporter in SolrCloud mode with:.\bin\solr-exporter -p 9854 -z localhost:2181/solr -f .\conf\solr-exporter-config.xml -n 16
In cases where SolrCloud mode operates with a ZooKeeper ensemble, set the -z zkhost value as a string zk1,zk2,zk3.
Validate the Prometheus Exporter
Upon activation, the Prometheus Exporter will report the metrics. The full metric list will be shown when there is an active ZooKeeper ensemble setup and a Solr Collection created. To validate that the Prometheus Exporter is setup correctly, the Prometheus metrics are accessible locally via curl:
curl http://localhost:9854/metricsConfiguration snippets for Kubernetes Helm chart
The following snippets provide examples to guide you through the configuration process.
To scrape your Apache Solr instances, manually modify your Kubernetes Monitoring Helm chart with these configuration snippets.
Replace any values between the angle brackets <> in the provided snippets with your desired configuration values.
Metrics snippets
alloy-metrics:
    extraConfig: |-
        discovery.kubernetes "apache_solr" {
            role = "endpoints"
            selectors {
                role = "service"
                field = "metadata.name=<solr_service_name>"
            }
        }

        discovery.relabel "apache_solr" {
            targets = discovery.kubernetes.apache_solr.targets

            rule {
                source_labels = ["__meta_kubernetes_namespace", "__meta_kubernetes_pod_name"]
                separator = "-"
                target_label = "instance"
            }
            rule {
                replacement = "<your-cluster-name>"
                target_label = "solr_cluster"
            }
        }

        prometheus.scrape "solr_metrics" {
        targets      = discovery.relabel.integrations_solr.output
        metrics_path = "/metrics"
        job_name     = "integrations/apache-solr"
        forward_to   = [prometheus.remote_write.grafana_cloud_metrics.receiver]
        }
Logs snippets
podLogs:
    extraDiscoveryRules: |-
        rule {
            source_labels = ["__meta_kubernetes_namespace","__meta_kubernetes_pod_name"]
            separator     = ":"
            regex         = "<solr-namespace>:<solr-pod-name>"
            replacement   = "apache_solr"
            target_label  = "integration"
        }

        rule {
            source_labels = ["integration", "__meta_kubernetes_pod_ip","__meta_kubernetes_pod_container_port_number"]
            separator = ":"
            regex = "apache_solr:(.*):(.*)"
            replacement = "$1:$2"
            target_label  = "instance"
        }

        rule {
            source_labels = ["integration"]
            regex = "apache_solr"
            replacement = "/var/log/solr/solr.log"
            target_label = "filename"
        }

    extraLogProcessingStages: |-
        stage.match {
            selector = "{integration=\\"apache_solr\\"}"

            stage.multiline {
                firstline = "^\\\\d{4}-\\\\d{2}-\\\\d{2} \\\\d{2}:\\\\d{2}:\\\\d{2}\\\\.\\\\d{3}"
            }
            stage.regex {
                expression = "^\\\\d{4}-\\\\d{2}-\\\\d{2} \\\\d{2}:\\\\d{2}:\\\\d{2}\\\\.\\\\d{3} (?P<level>\\\\w+)"
            }
            stage.labels {
                values = {
                    level = "",
                }
            }
            stage.static_labels {
                values = {
                    solr_cluster = "<your-cluster-name>",
                    job = "integrations/apache-solr",
                }
            }
        }
Dashboards
The Apache Solr integration installs the following dashboards in your Grafana Cloud instance to help monitor your system.
- Apache Solr cluster overview
- Apache Solr logs
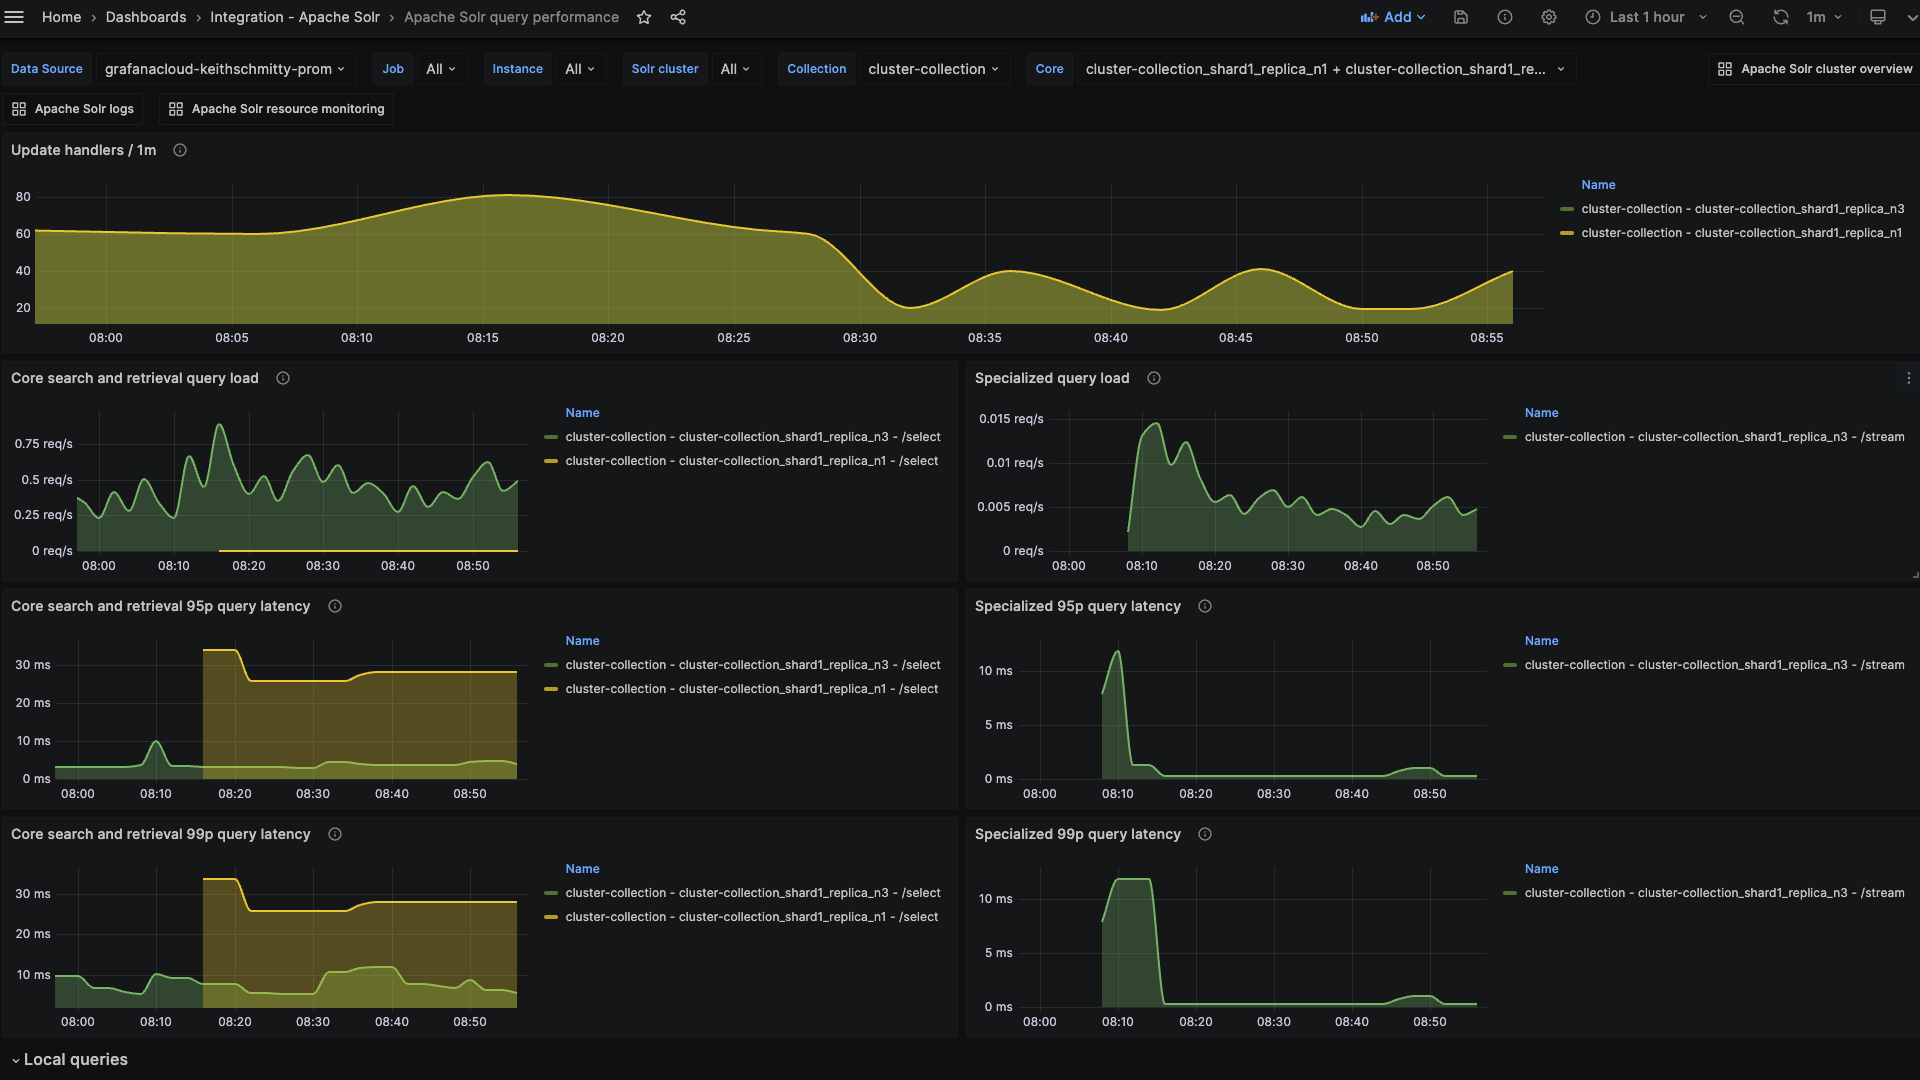
- Apache Solr query performance
- Apache Solr resource monitoring
Apache Solr overview (cluster)

Apache Solr overview (top metrics)

Apache Solr query performance (latency)
Alerts
The Apache Solr integration includes the following useful alerts:
Metrics
The most important metrics provided by the Apache Solr integration, which are used on the pre-built dashboards and Prometheus alerts, are as follows:
- solr_collections_live_nodes
- solr_collections_replica_state
- solr_collections_shard_state
- solr_metrics_core_errors_total
- solr_metrics_core_query_5minRate
- solr_metrics_core_query_client_errors_1minRate
- solr_metrics_core_query_errors_1minRate
- solr_metrics_core_query_local_5minRate
- solr_metrics_core_query_local_p95_ms
- solr_metrics_core_query_local_p99_ms
- solr_metrics_core_query_p95_ms
- solr_metrics_core_query_p99_ms
- solr_metrics_core_searcher_cache
- solr_metrics_core_searcher_cache_ratio
- solr_metrics_core_timeouts_total
- solr_metrics_core_update_handler_adds_total
- solr_metrics_jetty_dispatches_total
- solr_metrics_jetty_requests_total
- solr_metrics_jetty_response_total
- solr_metrics_jvm_gc_seconds_total
- solr_metrics_jvm_gc_total
- solr_metrics_jvm_memory_heap_bytes
- solr_metrics_jvm_memory_non_heap_bytes
- solr_metrics_jvm_os_cpu_load
- solr_metrics_jvm_os_file_descriptors
- solr_metrics_jvm_os_memory_bytes
- solr_metrics_node_connections
- solr_metrics_node_core_root_fs_bytes
- solr_metrics_node_thread_pool_completed_total
- solr_metrics_node_thread_pool_submitted_total
- solr_metrics_node_timeouts_total
- solr_zookeeper_ensemble_size
- solr_zookeeper_status
- up
Changelog
# 1.0.4 - November 2024

- Update mixin to fix various panel queries
- Update installation docs regarding `solr_cluster` label

# 1.0.3 - November 2024

- Update status panel check queries

# 1.0.2 - May 2024

- Added cluster selector to dashboards for kubernetes support
- Added default cluster label to agent config

# 1.0.1 - February 2024

- Fix alerts to trigger properly

# 1.0.0 - January 2024

- Initial release
Cost
By connecting your Apache Solr instance to Grafana Cloud, you might incur charges. To view information on the number of active series that your Grafana Cloud account uses for metrics included in each Cloud tier, see Active series and dpm usage and Cloud tier pricing.


