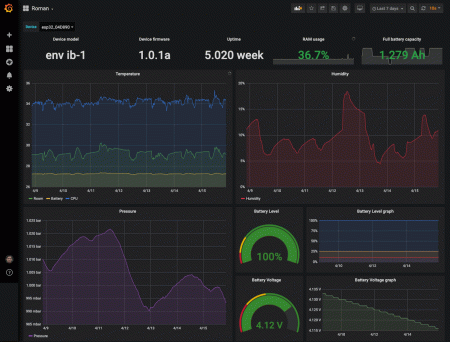
Visualize GitLab easily with Grafana
Quickly visualize your data and find interesting insights with the Grafana plugin for GitLab, the popular web-based DevSecOps life-cycle tool.
Get started with these easy steps:
- Create a free account or contact us for a Grafana Enterprise license to run it on your own infrastructure.
- Connect the data source to GitLab in Grafana.
- Explore and visualize your GitLab data in Grafana!
Need to self-manage?
Get started with these easy steps:
- Create a free account or contact us for a Grafana Enterprise license to run it on your own infrastructure.
- Connect the data source to GitLab in Grafana.
- Explore and visualize your GitLab data in Grafana!
Need to self-manage?
Get started with these easy steps:
- Go to your Grafana Account Portal and start right now!
- Run a one-line command to install the Grafana Agent
- That’s it! You’ll immediately see pre-built Grafana dashboards and alerts tailored for monitoring GitLab!
Get started with these easy steps:
- Install the GitLab plugin to get started.
- Connect the data source to GitLab in Grafana.
- Explore and visualize your GitLab data in Grafana!
Get started with these easy steps:
- Manage this plugin with your Grafana Cloud Pro account.
Get started with these easy steps:
- Install the GitLab plugin to get started.
- Connect the data source to GitLab in Grafana.
- Explore and visualize your GitLab data in Grafana!
Get started with these easy steps:
- Install the GitLab plugin to get started.
- Connect the data source to GitLab in Grafana.
- Explore and visualize your GitLab data in Grafana!
Enterprise customers have access to all Grafana Enterprise plugins.
Install the GitLab plugin to get started.
Cloud free customers have access to all Grafana Enterprise Plugins for up to 3 users.
Install the GitLab plugin to get started.
Get started with these easy steps:
- Create a free account or contact us for a Grafana Enterprise license to run it on your own infrastructure.
- Connect the data source to GitLab in Grafana.
- Explore and visualize your GitLab data in Grafana!
Need to self-manage?

