Supabase integration for Grafana Cloud
Supabase is an easy-to-use, open-source managed Postgres with integrated backend services. By integrating Supabase with Grafana Cloud, users gain monitoring capabilities for Supabase performance and operations. The included dashboard offers a comprehensive overview of Supabase performance, supplemented with Postgres metrics.
Before you begin
You need a Supabase Secret API key (sb_secret_...).
You can create/copy it in Project Settings → API Keys.
For more context, refer to the Supabase API key Documentation.
Install the Supabase integration for Grafana Cloud
- In your Grafana Cloud stack, click Connections in the left-hand menu.
- Find and select the Supabase tile to open the integration.
- Follow the steps outlined on the Configuration page to configure scrape jobs, which pull the data from Supabase.
- Give your scrape job a descriptive name like
production-eu-central-1 - Set your Project ID and enter the service account API key
- Test the connection and save the scrape job
- Give your scrape job a descriptive name like
- Once scrape jobs are configured, click Install to add the prebuilt dashboards to your Grafana Cloud instance.
Configuration
The Supabase integration works by periodically scraping the Supabase Metrics API for metrics. You can set up multiple scrape jobs in one Grafana Cloud instance. This can be useful, if you want to monitor multiple projects in a single instance.
After installation, visit the Supabase Project dashboard to check the status of your scrape job or explore your metrics.
Dashboards
The Supabase integration installs the following dashboard in your Grafana Cloud instance.
- Metrics endpoint scrape overview
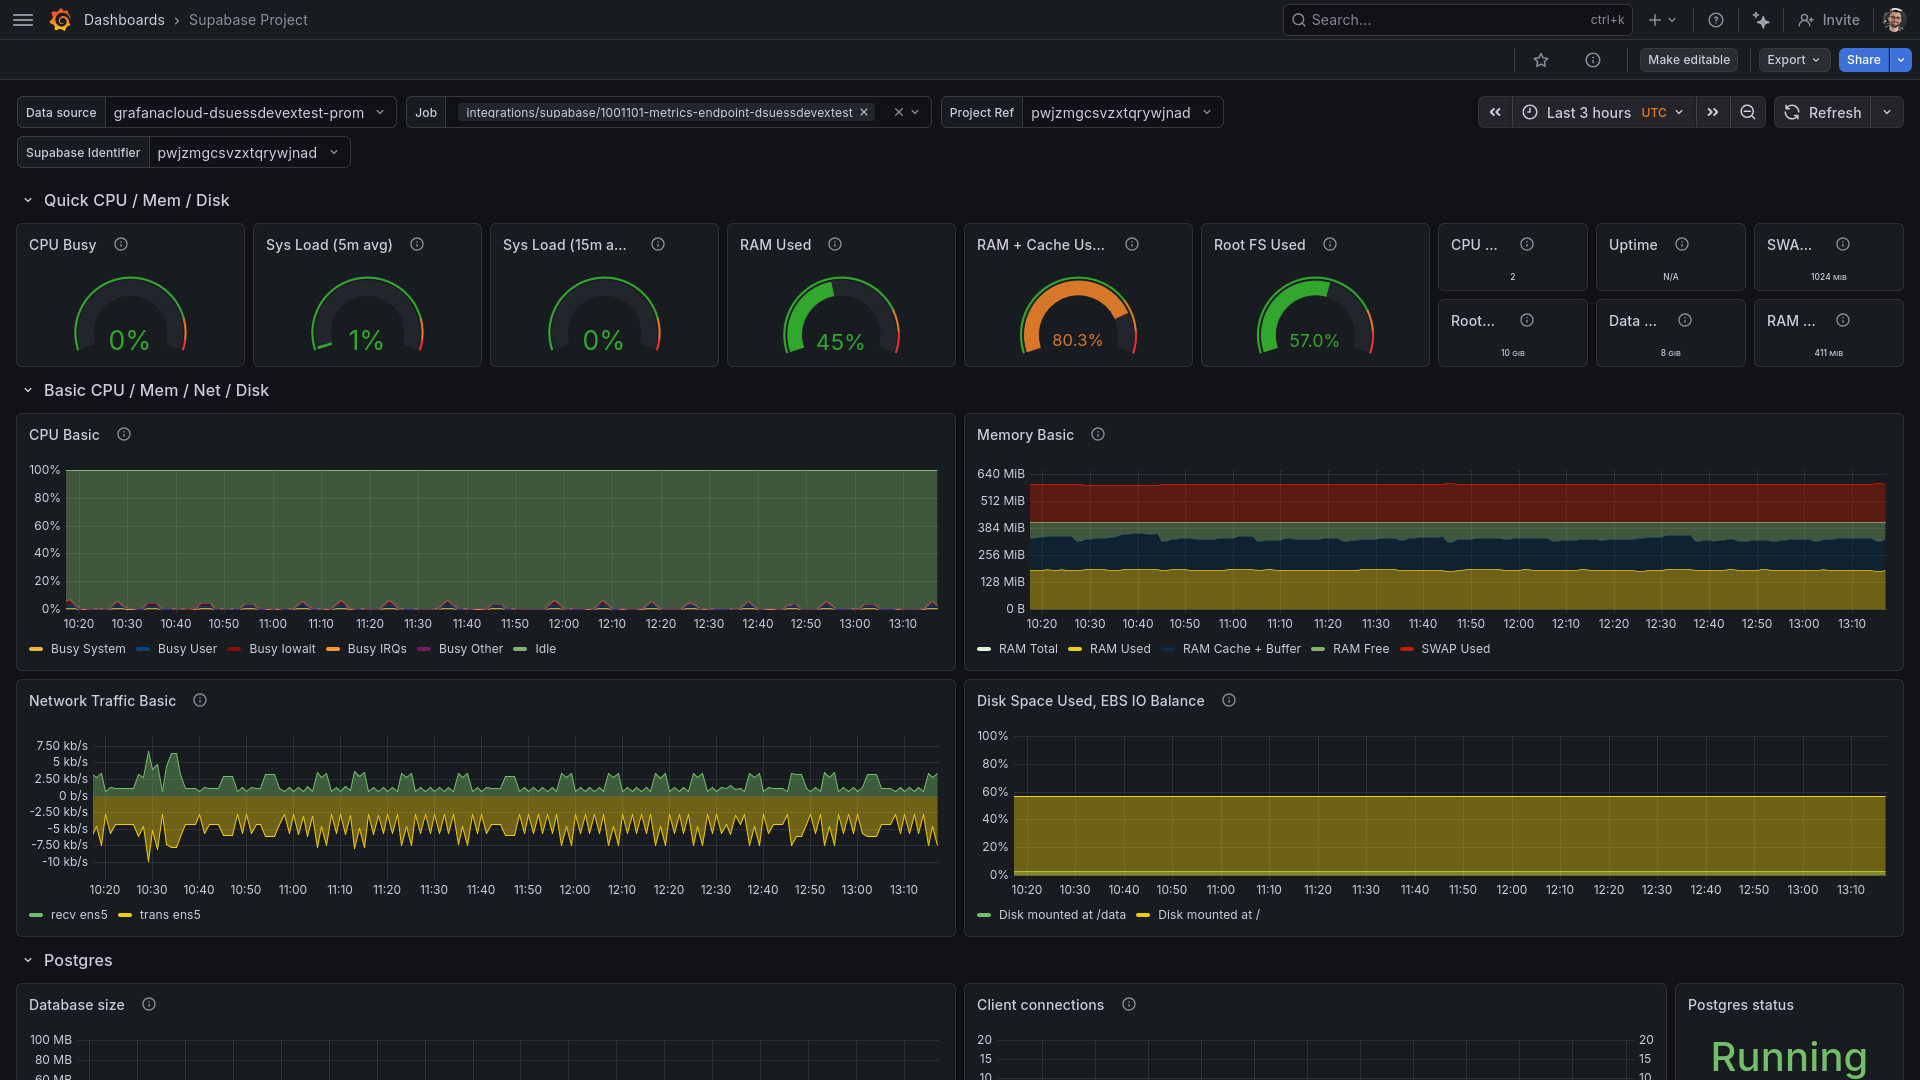
- Supabase Project
Screenshot of the Supabase Grafana dashboard
Changelog
# 1.2.0 - May 2026

* Add scrape endpoint diagnostics dashboard

# 1.1.0 - March 2026

* Update dashboard to match upstream

# 1.0.0 - July 2024

* Initial release

