What is Grafana k6?
Grafana k6 is an easy-to-use, open source load testing tool that helps teams assess system performance and identify issues before they reach production.
Grafana k6 overview
Grafana k6 is an open source load and performance testing tool that helps developers, SREs, and QA teams test reliability earlier in the software development lifecycle.
With a scriptable engine written in Go and tests authored either in JavaScript or TypeScript, k6 offers a developer-friendly approach to creating, running, and automating tests across both local and cloud environments.
The k6 open source project was started in 2016 by k6, a startup Grafana Labs acquired in 2021. The mission of the project is to give teams extensible load testing tools for building and observing reliable applications. Grafana k6 extends beyond standard load testing (such as stress testing), supporting various other use cases, such as browser testing.
Grafana Labs is proud to lead the development of the Grafana k6 project, building first-class support for k6 into Grafana, and ensuring Grafana Labs customers receive k6 support and features they need.
Why use Grafana k6 for load testing?


How does Grafana k6 work for load testing?

Author tests your way
Start from scratch by writing JavaScript directly, use k6 Studio, or convert an OpenAPI spec. k6 has multiple ways to get you started with testing quickly.
Configure realistic load patterns
Simulate real-world traffic with ramping, constant VUs, duration-based tests, and complex arrival rates. Fine-tune based on your service’s needs.
Run tests locally or in the cloud
Use your laptop, a distributed environment, or Grafana Cloud k6 for massive scale. Easily iterate during development then scale confidently.
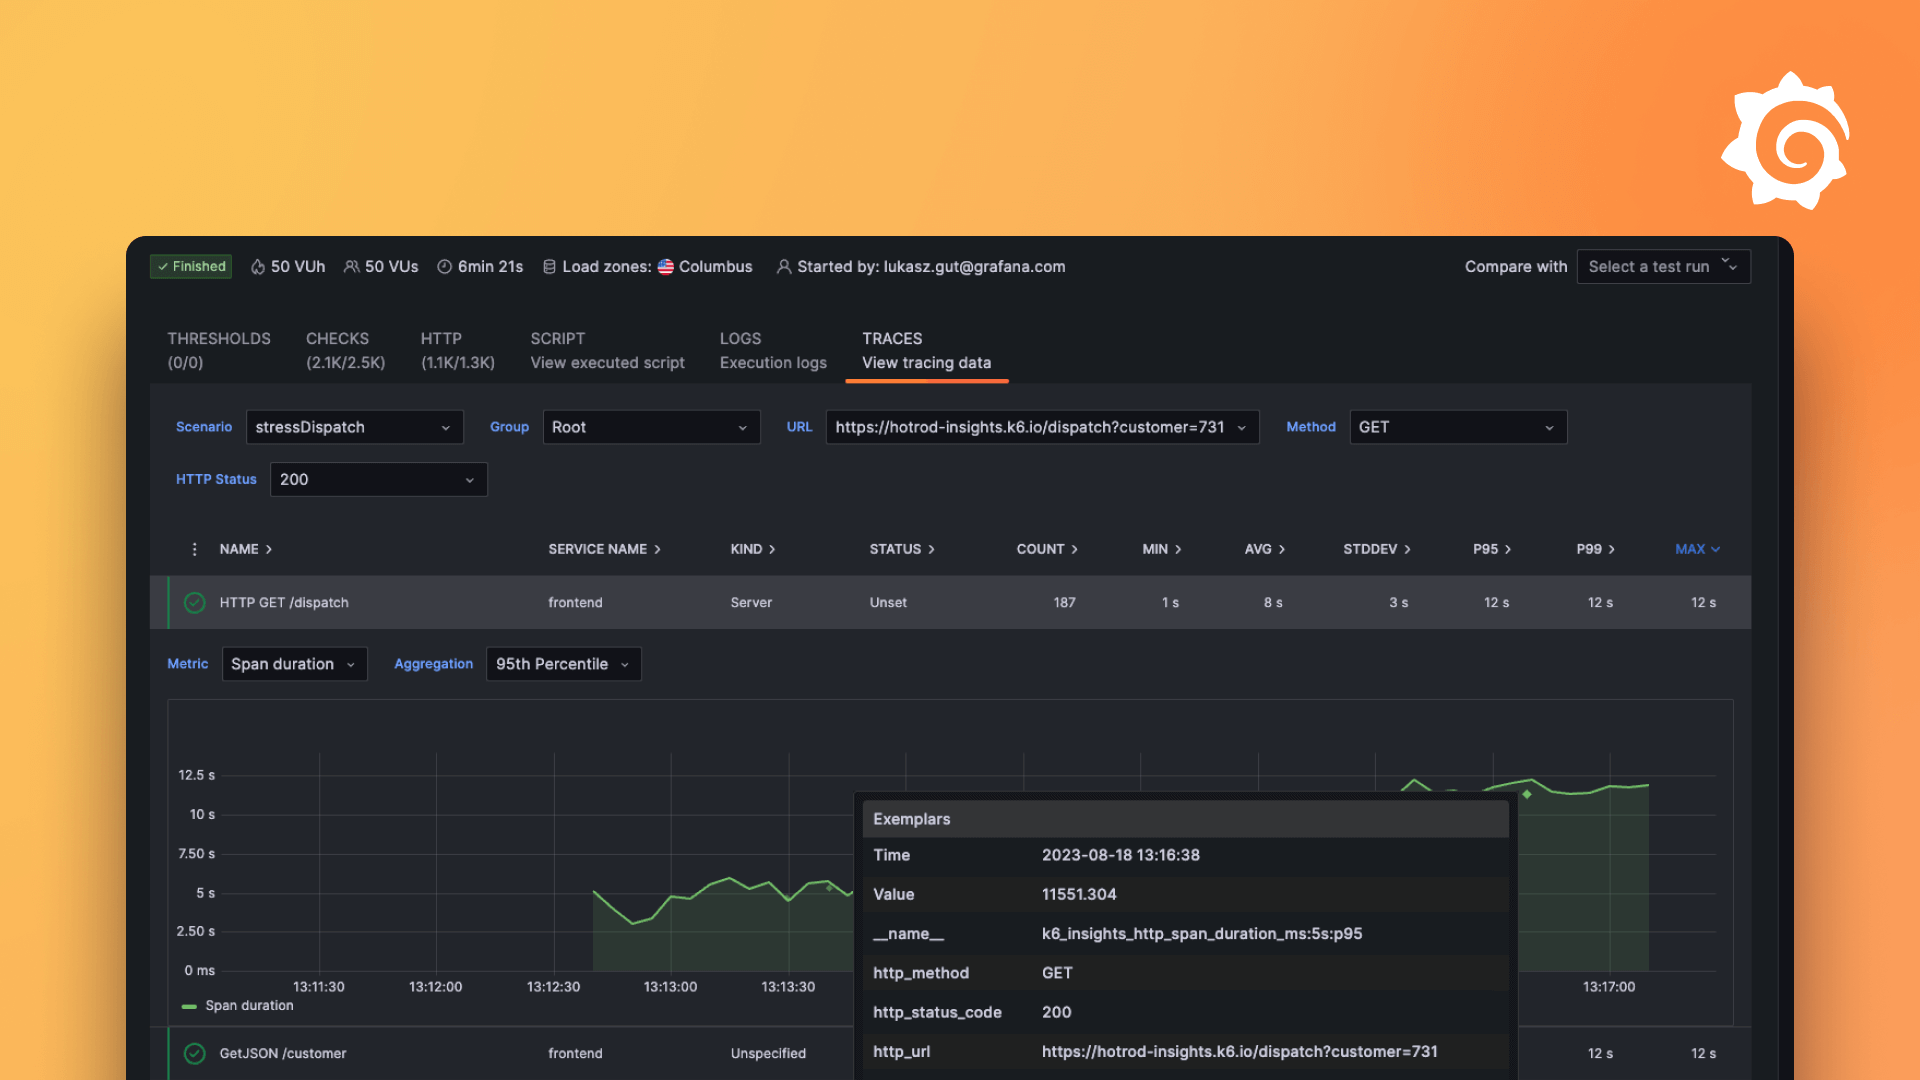
Visualize metrics
Visualize test results using the web UI, pre-built Grafana dashboards, or Grafana Cloud k6, gaining insights into performance metrics and trends over time.
Choose the version that’s best for you
Grafana k6Open source
Grafana Cloud FreeFree forever
Grafana Cloud ProPay as you go
Built on open source, driven by the community
We’re excited to share our learnings and work with the open source community for this developer-friendly load testing tool.