IBM DB2 integration for Grafana Cloud
IBM DB2 is a relational database management system designed to store, manage, and retrieve data efficiently. This integration for Grafana Cloud allows users to collect metrics and logs for monitoring an IBM DB2 database.
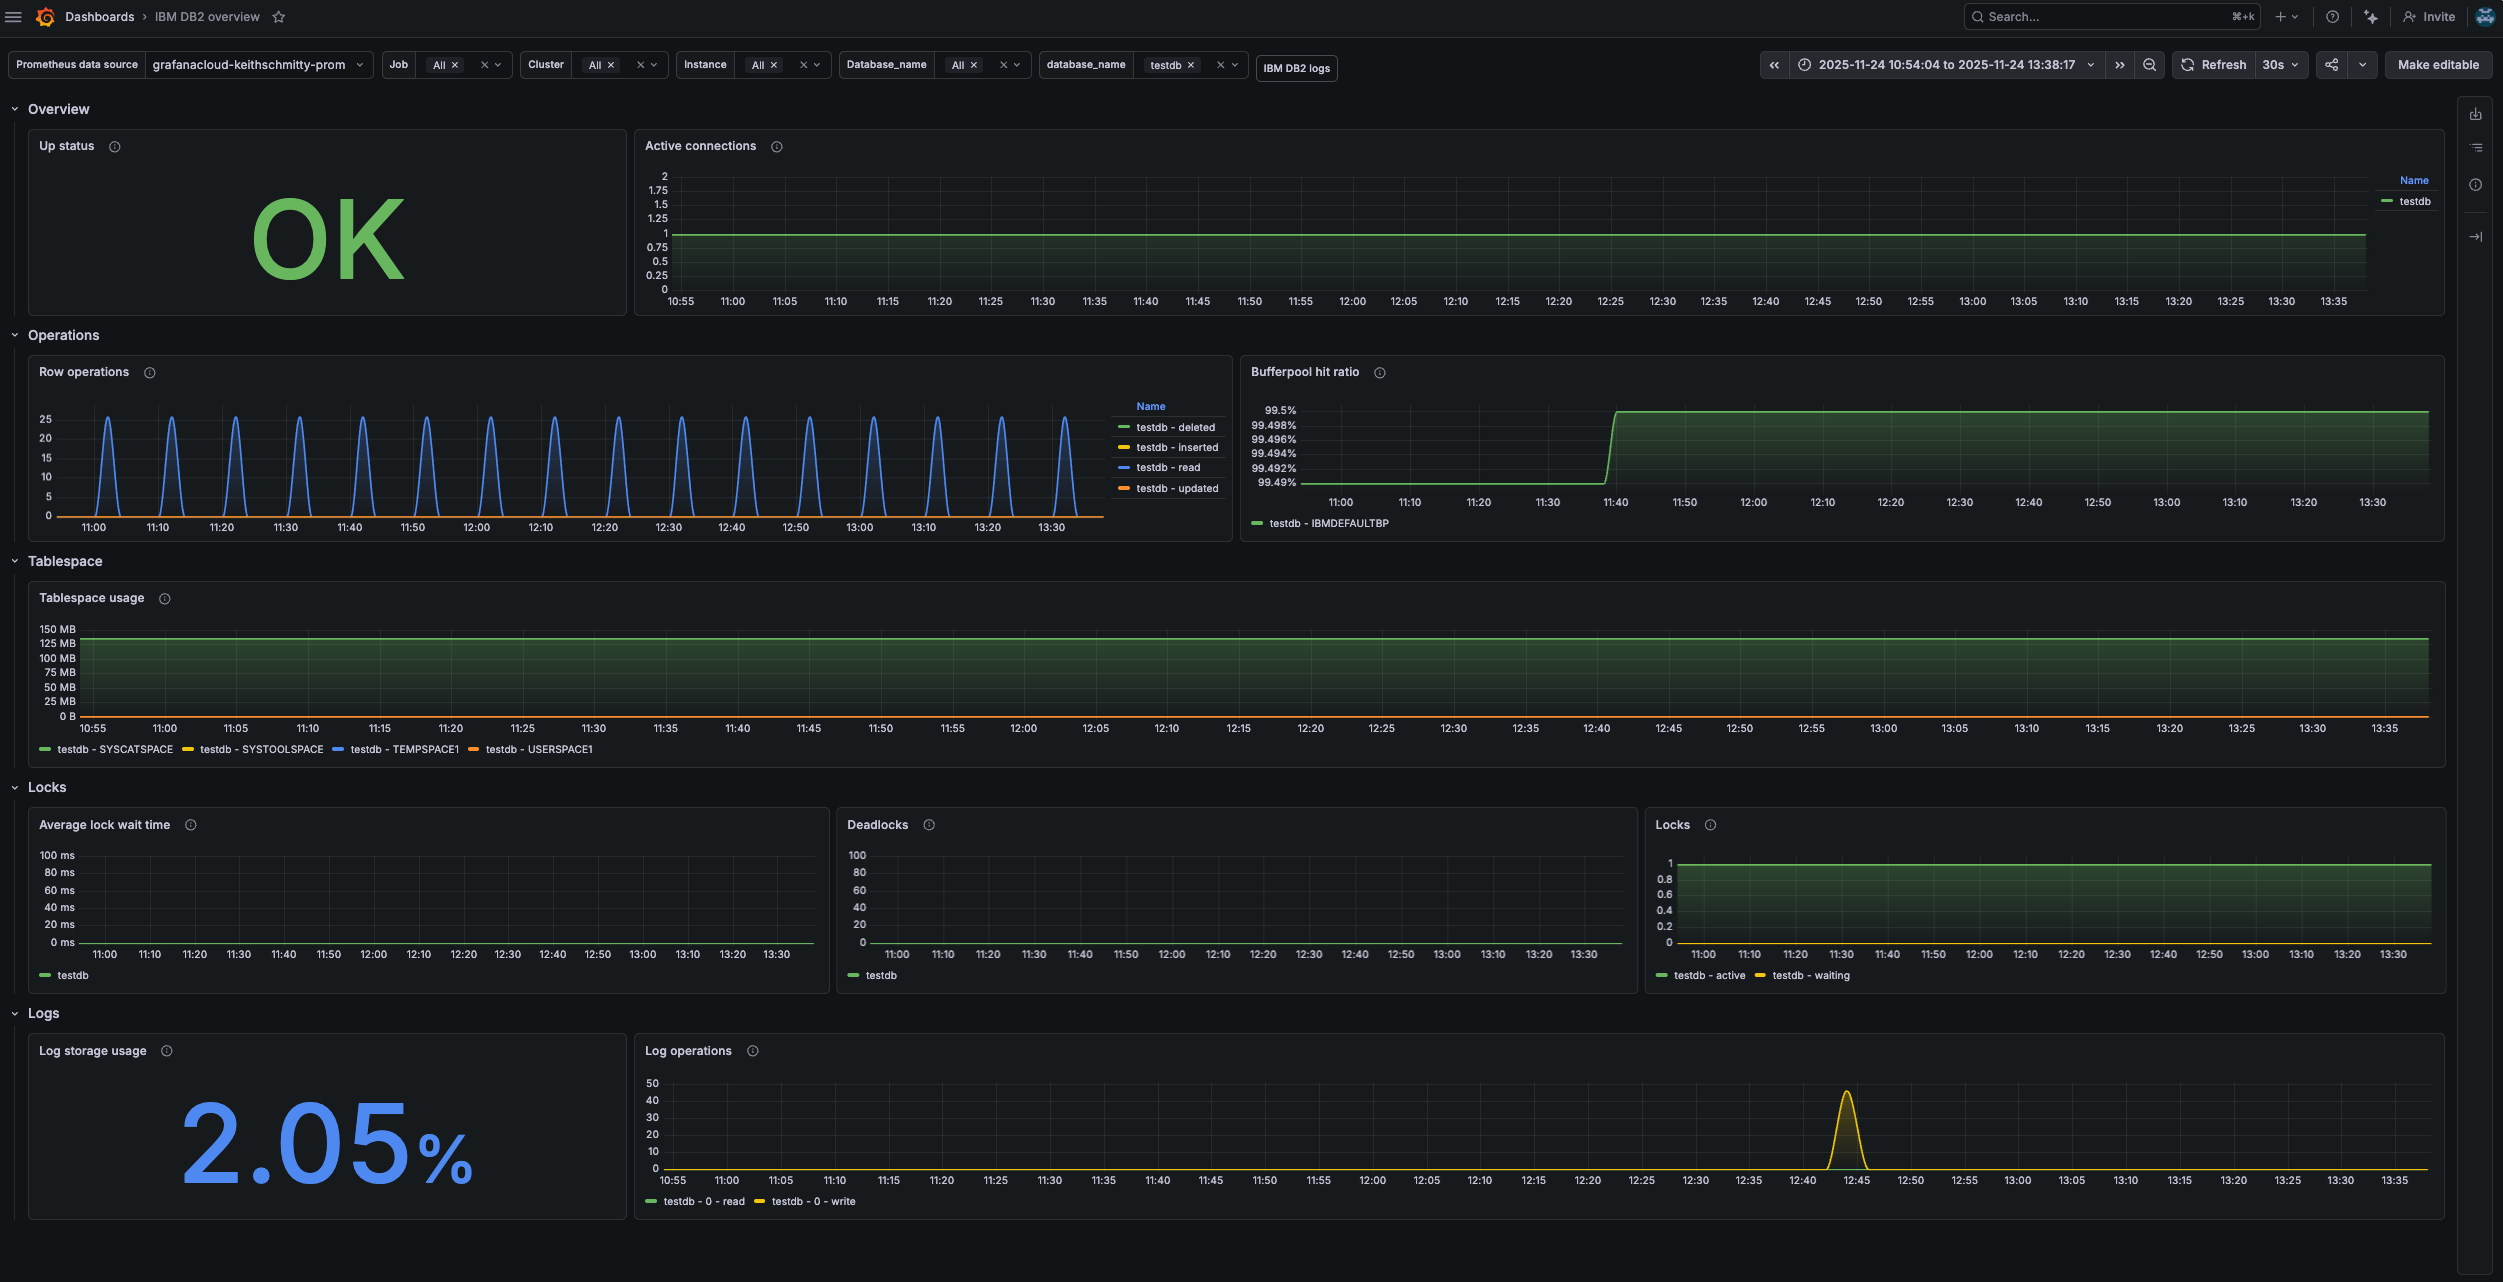
Metrics include active connections, row operations, bufferpool hit ratio, tablespace usage, average lock wait time, deadlocks, and active locks.
This integration supports IBM DB2 9.7 and onwards.
This integration includes 3 useful alerts and 2 pre-built dashboards to help monitor and visualize IBM DB2 metrics and logs.
Before you begin
In order for the integration to properly work, you must set up the IBM DB2 Prometheus Exporter to export metrics from IBM DB2.
Activating IBM DB2 database
For DB2 to accurately report metric values, the database being monitored must be “explicitly activated”. Doing so will make it so that certain metric values are correctly incremented and not periodically reset. However, it does result in a performance impact on the environment DB2 is running in. The size of this impact will depend on the system, but will result in the most accurate data reported by DB2 and, subsequently, this exporter. To explicitly activate a database, connect to DB2 and run the command activate database <dbname> and disconnect. Now DB2 will correctly increment and store metrics.
db2
activate database sample
quit
To deactivate a database, connect to db2 and run the command deactivate database <dbname> and disconnect. Doing so will reset the metrics reported by DB2. The database must be reactivated in order for metrics to be properly incremented, stored, and reported by DB2.
Note: Whether or not the database is activated only affects DB2’s ability to report metrics, it does not affect DB2’s behavior as a database.
Set up IBM DB2 Exporter
The exporter can be run by following this guide.
Note: The exporter uses a driver that is not compatible with ARM64 architectures. Therefore the exporter cannot be used on an ARM64 machine.
The exporter serves metrics for only one database, so to monitor multiple databases multiple exporters will need to be set up. By default, the exporter serves metrics at port 9953 but can be configured to use a different port. Use the flag --web.listen-address=;<port> when running the exporter to serve metrics at a different port. This can be done so that Grafana Alloy can report metrics for multiple databases by scraping from multiple exporters.
Once deployed, Grafana Alloy will be able to scrape the IBM DB2 Exporter.
Install IBM DB2 integration for Grafana Cloud
- In your Grafana Cloud stack, click Connections in the left-hand menu.
- Find IBM DB2 and click its tile to open the integration.
- Review the prerequisites in the Configuration Details tab and set up Grafana Alloy to send IBM DB2 metrics and logs to your Grafana Cloud instance.
- Click Install to add this integration’s pre-built dashboards and alerts to your Grafana Cloud instance, and you can start monitoring your IBM DB2 setup.
Configuration snippets for Grafana Alloy
Simple mode
These snippets are configured to scrape a single IBM DB2 instance running locally with default ports.
First, manually copy and append the following snippets into your alloy configuration file.
Metrics snippets
prometheus.scrape "metrics_integrations_integrations_ibm_db2" {
	targets = [{
		__address__ = "localhost:9953",
		instance    = constants.hostname,
	}]
	forward_to = [prometheus.remote_write.metrics_service.receiver]
	job_name   = "integrations/ibm-db2"
}
Logs snippets
linux
local.file_match "logs_integrations_integrations_ibm_db2" {
	path_targets = [{
		__address__ = "localhost",
		__path__    = "/home/*/sqllib/db2dump/{DIAG*,db2diag.log}/db2diag.log",
		instance    = constants.hostname,
		job         = "integrations/ibm-db2",
	}]
}

loki.process "logs_integrations_integrations_ibm_db2" {
	forward_to = [loki.write.grafana_cloud_loki.receiver]

	stage.multiline {
		firstline     = "\\d+-\\d+-\\d+-\\d+.\\d+.\\d+.\\d+\\+\\d+\\s[A-Z0-9]+\\s+LEVEL:\\s[a-zA-Z]+"
		max_lines     = 0
		max_wait_time = "3s"
	}
}

loki.source.file "logs_integrations_integrations_ibm_db2" {
	targets    = local.file_match.logs_integrations_integrations_ibm_db2.targets
	forward_to = [loki.process.logs_integrations_integrations_ibm_db2.receiver]
}
Advanced mode
The following snippets provide examples to guide you through the configuration process.
To instruct Grafana Alloy to scrape your IBM DB2 instances, manually copy and append the snippets to your alloy configuration file, then follow subsequent instructions.
Advanced metrics snippets
prometheus.scrape "metrics_integrations_integrations_ibm_db2" {
	targets = [{
		__address__ = "localhost:9953",
		instance    = constants.hostname,
	}]
	forward_to = [prometheus.remote_write.metrics_service.receiver]
	job_name   = "integrations/ibm-db2"
}
To monitor your IBM DB2 instance, you must use a discovery.relabel component to discover your IBM DB2 Prometheus endpoint and apply appropriate labels, followed by a prometheus.scrape component to scrape it.
Configure the following properties within each discovery.relabel component:
__address__: The address to your IBM DB2 Prometheus metrics endpoint.instancelabel:constants.hostnamesets theinstancelabel to your Grafana Alloy server hostname. If that is not suitable, change it to a value uniquely identifies this IBM DB2 instance. Make sure this label value is the same for all telemetry data collected for this instance.
If you have multiple IBM DB2 servers to scrape, configure one discovery.relabel for each and scrape them by including each under targets within the prometheus.scrape component.
Advanced logs snippets
linux
local.file_match "logs_integrations_integrations_ibm_db2" {
	path_targets = [{
		__address__ = "localhost",
		__path__    = "/home/*/sqllib/db2dump/{DIAG*,db2diag.log}/db2diag.log",
		instance    = constants.hostname,
		job         = "integrations/ibm-db2",
	}]
}

loki.process "logs_integrations_integrations_ibm_db2" {
	forward_to = [loki.write.grafana_cloud_loki.receiver]

	stage.multiline {
		firstline     = "\\d+-\\d+-\\d+-\\d+.\\d+.\\d+.\\d+\\+\\d+\\s[A-Z0-9]+\\s+LEVEL:\\s[a-zA-Z]+"
		max_lines     = 0
		max_wait_time = "3s"
	}
}

loki.source.file "logs_integrations_integrations_ibm_db2" {
	targets    = local.file_match.logs_integrations_integrations_ibm_db2.targets
	forward_to = [loki.process.logs_integrations_integrations_ibm_db2.receiver]
}
To monitor your IBM DB2 instance logs, you will use a combination of the following components:
- local.file_match defines where to find the log file to be scraped. Change the following properties according to your environment:
__address__: The IBM DB2 instance address__path__: The path to the log file.instancelabel:constants.hostnamesets theinstancelabel to your Grafana Alloy server hostname. If that is not suitable, change it to a value uniquely identifies this IBM DB2 instance. Make sure this label value is the same for all telemetry data collected for this instance.
Logs are found where the DB2 instance is located, inside the sqllib directory. For a single member environment, logs will be available at /path/to/inst/sqllib/db2dump/db2diag.log. For multi-member environments logs are located at /path/to/inst/sqllib/db2dump/DIAG*/db2diag.log. You can edit the __path__ label for logs to match your environment.
- loki.process defines how to process logs before sending it to Loki.
- loki.source.file sends logs to Loki.
Kubernetes instructions
Before you begin with Kubernetes
Please note: These instructions assume the use of the Kubernetes Monitoring Helm chart
In order for the integration to properly work, you must set up the IBM DB2 Prometheus Exporter to export metrics from IBM DB2.
Activating IBM DB2 database
For DB2 to accurately report metric values, the database being monitored must be “explicitly activated”. Doing so will make it so that certain metric values are correctly incremented and not periodically reset. However, it does result in a performance impact on the environment DB2 is running in. The size of this impact will depend on the system, but will result in the most accurate data reported by DB2 and, subsequently, this exporter. To explicitly activate a database, connect to DB2 and run the command activate database <dbname> and disconnect. Now DB2 will correctly increment and store metrics.
db2
activate database sample
quit
To deactivate a database, connect to db2 and run the command deactivate database <dbname> and disconnect. Doing so will reset the metrics reported by DB2. The database must be reactivated in order for metrics to be properly incremented, stored, and reported by DB2.
Note: Whether or not the database is activated only affects DB2’s ability to report metrics, it does not affect DB2’s behavior as a database.
Set up IBM DB2 Exporter
The exporter can be run by following this guide.
Note: The exporter uses a driver that is not compatible with ARM64 architectures. Therefore the exporter cannot be used on an ARM64 machine.
The exporter serves metrics for only one database, so to monitor multiple databases multiple exporters will need to be set up. By default, the exporter serves metrics at port 9953 but can be configured to use a different port. Use the flag --web.listen-address=;<port> when running the exporter to serve metrics at a different port. This can be done so that Grafana Alloy can report metrics for multiple databases by scraping from multiple exporters.
Configuration snippets for Kubernetes Helm chart
The following snippets provide examples to guide you through the configuration process.
To scrape your IBM DB2 instances, manually modify your Kubernetes Monitoring Helm chart with these configuration snippets.
Replace any values between the angle brackets <> in the provided snippets with your desired configuration values.
Metrics snippets
alloy-metrics:
    extraConfig: |-
        discovery.kubernetes "ibm_db2" {
            role = "pod"
            selectors {
                role = "pod"
                label = "<ibm-db2-pod-label>=<ibm-db2-pod-label-value>"
            }
        }

        discovery.relabel "ibm_db2" {
            targets = discovery.kubernetes.ibm_db2.targets
            rule {
                source_labels = ["__meta_kubernetes_pod_container_port_number"]
                regex = "<db2-exporter-port>"
                action = "keep"
            }
            rule {
                target_label = "db2_cluster"
                replacement = "<ibm-db2-cluster-label>"
            }
            rule {
                source_labels = ["__meta_kubernetes_namespace", "__meta_kubernetes_pod_container_name"]
                separator = "-"
                target_label = "instance"
            }
        }
        prometheus.scrape "ibm_db2" {
            targets      = discovery.relabel.ibm_db2.output
            job_name     = "integrations/ibm-db2"
            forward_to   = [prometheus.remote_write.grafana_cloud_metrics.receiver]
        }
Logs snippets
podLogs:
    extraDiscoveryRules: |-
        rule {
            source_labels = ["__meta_kubernetes_pod_label_<ibm-db2-pod-label>"]
            regex = "<ibm-db2-pod-label-value>"
            replacement = "ibm_db2"
            target_label = "integration"
        }

    extraLogProcessingStages: |-
        stage.match {
            selector = "{integration=\\"ibm_db2\\"}"

            stage.multiline {
                firstline     = \`\\d+-\\d+-\\d+-\\d+.\\d+.\\d+.\\d+\\+\\d+\\s[A-Z0-9]+\\s+LEVEL:\\s[a-zA-Z]+\`
                max_lines     = 0
                max_wait_time = "3s"
            }

            stage.template {
                source   = "instance"
                template = "{{ .namespace }}-{{ .container }}"
            }

            stage.static_labels {
                values = {
                    db2_cluster = "<your-cluster-name>",
                    log_type    = "db2diag",
                    job         = "integrations/apache-activemq",
                }
            }

            stage.labels {
                values = {
                    instance = null,
                    level = null,
                }
            }
        }
Dashboards
The IBM DB2 integration installs the following dashboards in your Grafana Cloud instance to help monitor your system.
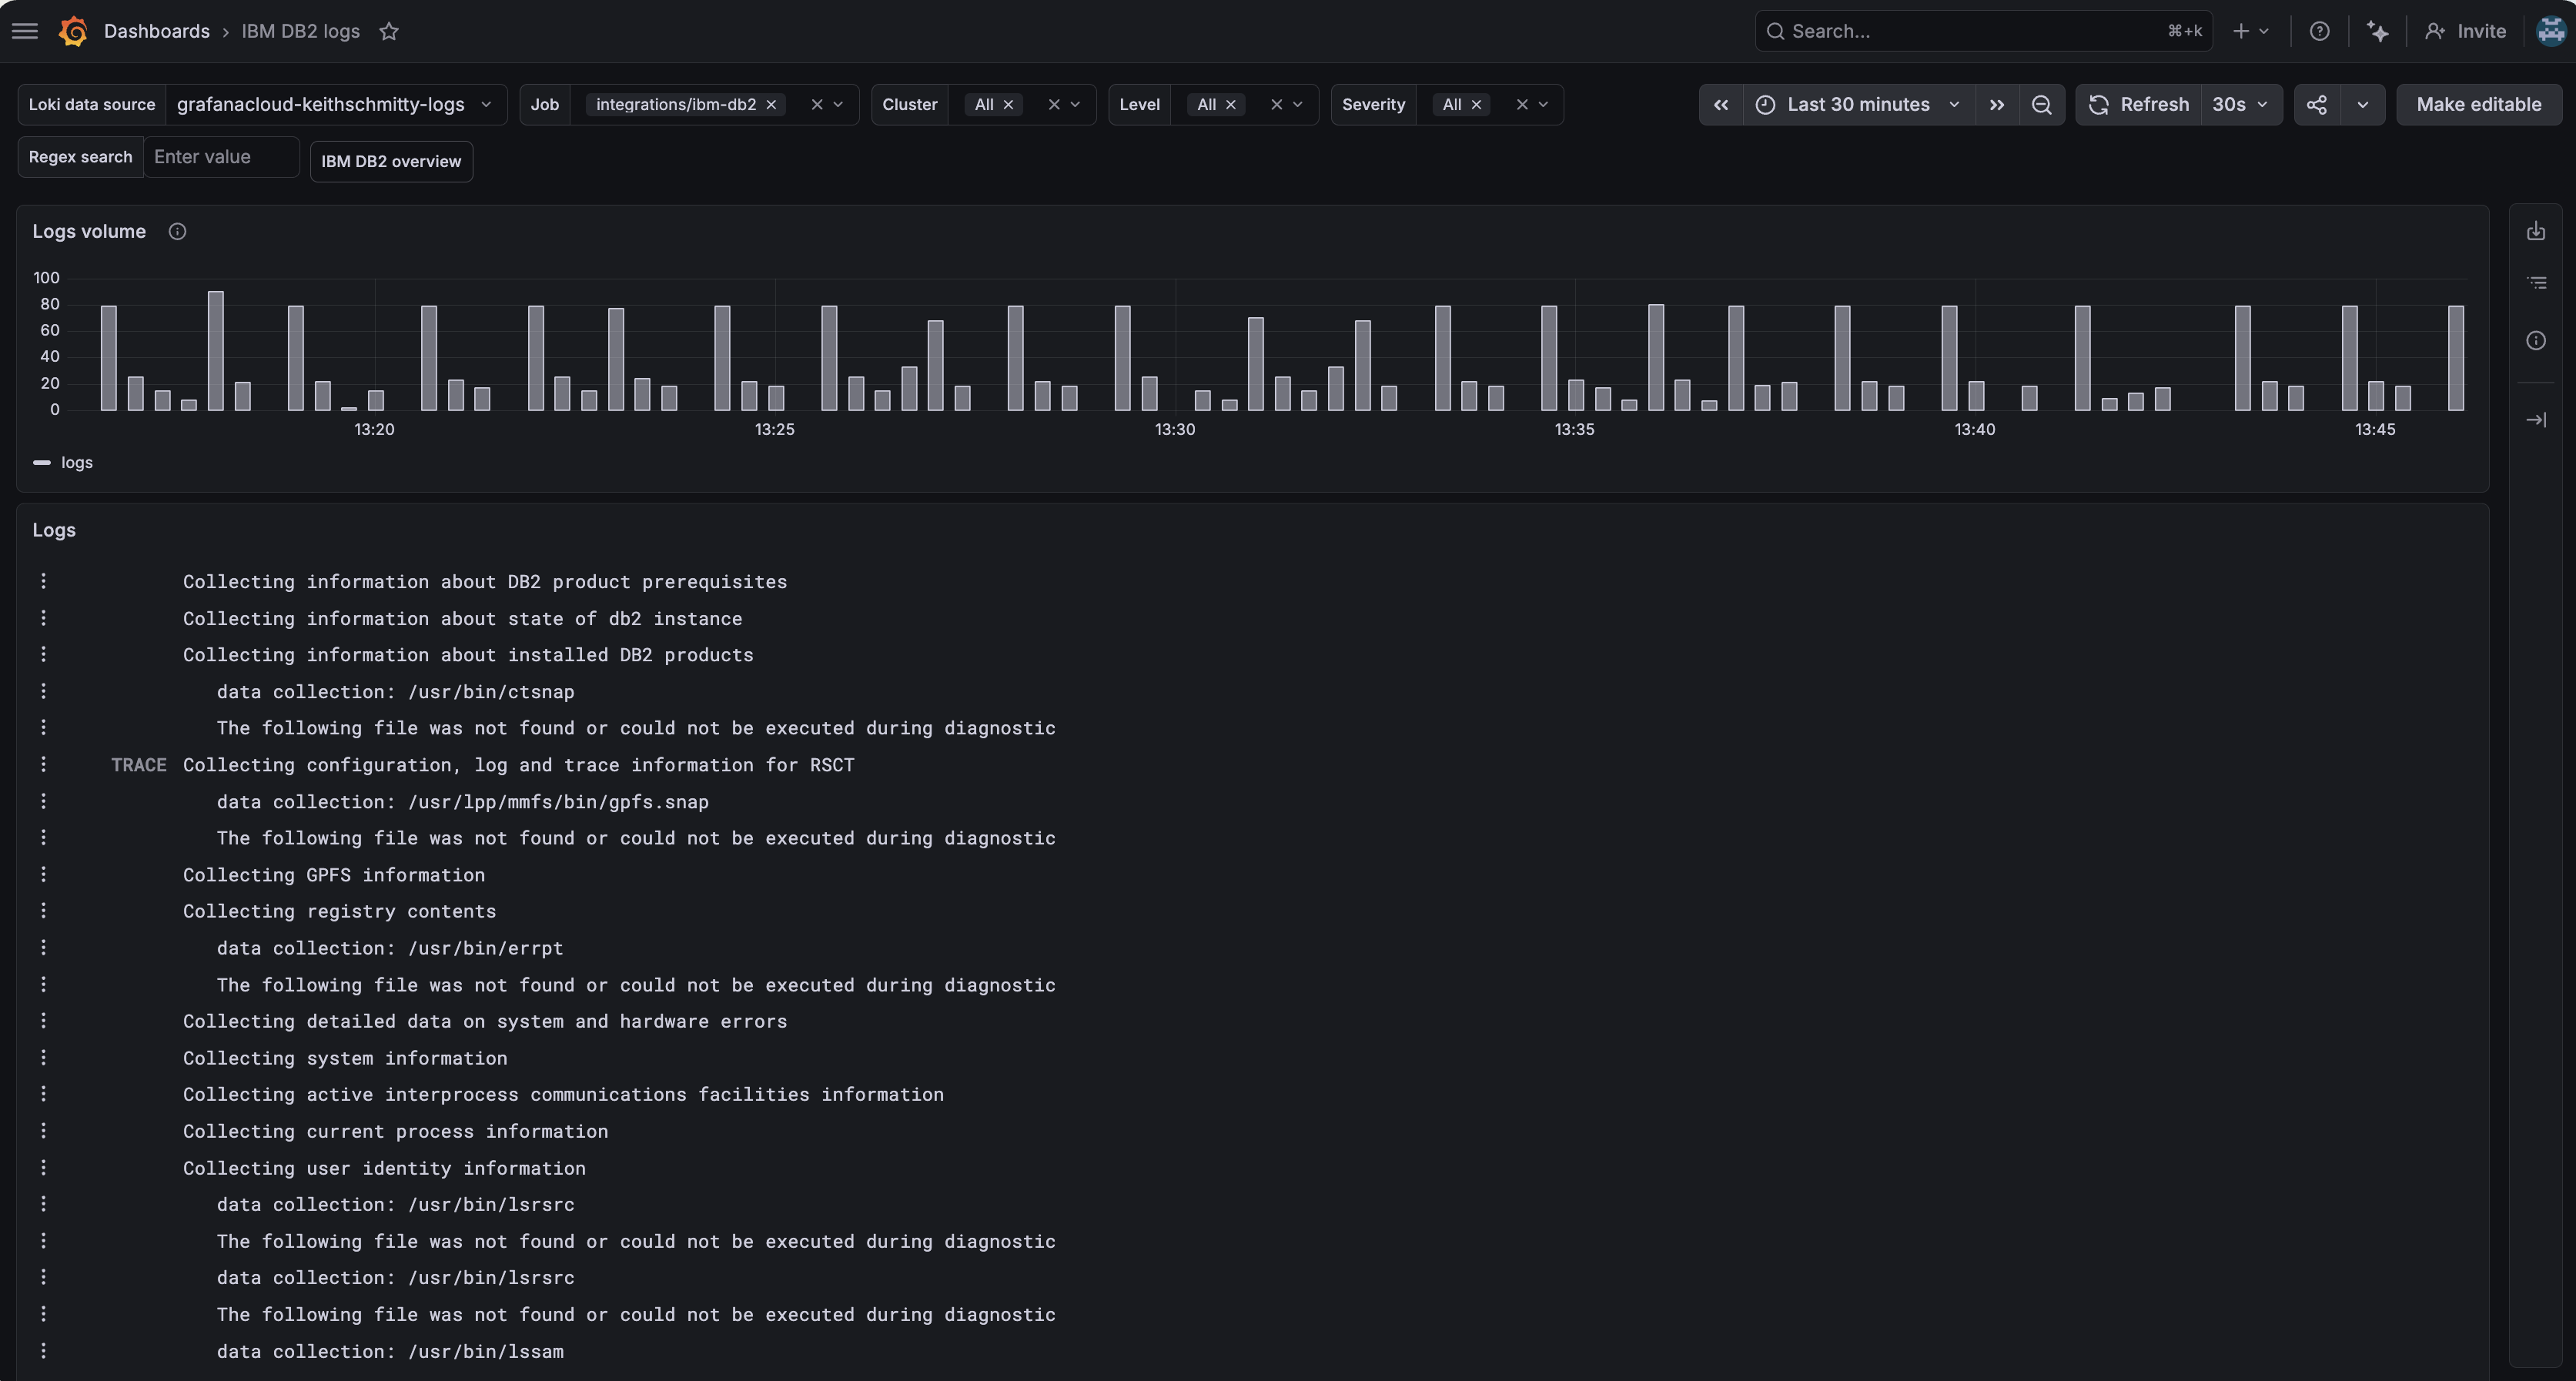
- IBM DB2 logs
- IBM DB2 overview
IBM DB2 overview (metrics)
IBM DB2 logs (logs)
Alerts
The IBM DB2 integration includes the following useful alerts:
Metrics
The most important metrics provided by the IBM DB2 integration, which are used on the pre-built dashboards and Prometheus alerts, are as follows:
- ibm_db2_application_active
- ibm_db2_bufferpool_hit_ratio
- ibm_db2_deadlock_total
- ibm_db2_lock_usage
- ibm_db2_lock_wait_time
- ibm_db2_log_operations_total
- ibm_db2_log_usage
- ibm_db2_row_total
- ibm_db2_tablespace_usage
- ibm_db2_up
- up
Changelog
# 1.1.1 - June 2026

- Fixed issue with default filtering selectors

# 1.1.0 - June 2026

- Updated dashboards to follow new stylistic standards
- Added a dedicated logs dashboard `IBM DB2 logs`

# 1.0.0 - December 2023

- Added Grafana Agent Operator configuration snippet to support IBM DB2 in kubernetes cluster
- Added cluster selector to dashboard for kubernetes support
- Added default cluster label to agent config
- Bump version to 1.0.0

# 0.0.3 - September 2023

- New Filter Metrics option for configuring the Grafana Agent, which saves on metrics cost by dropping any metric not used by this integration. Beware that anything custom built using metrics that are not on the snippet will stop working.
- New hostname relabel option, which applies the instance name you write on the text box to the Grafana Agent configuration snippets, making it easier and less error prone to configure this mandatory label.

# 0.0.2 - August 2023

- Add regex filter for logs datasource

# 0.0.1 - July 2023

- Initial release
Cost
By connecting your IBM DB2 instance to Grafana Cloud, you might incur charges. To view information on the number of active series that your Grafana Cloud account uses for metrics included in each Cloud tier, see Active series and dpm usage and Cloud tier pricing.


