Version 2.8 release notes
The Tempo team is pleased to announce the release of Tempo 2.8.
This release gives you:
- New TraceQL features such as
most_recent, parent-span filters,sum_over_time, andtopk/bottomkto help surface the exact spans and metrics you need. - Concurrent block flushing, iterator optimizations, and back-pressure make ingestion and queries leaner and quicker.
- Safer defaults with port 3200, distroless images, Go 1.24, and an upgraded OTLP Collector tighten security and simplify ops.
These release notes highlight the most important features and bugfixes. For a complete list, refer to the Tempo changelog.
Note
Tempo 2.8 has some major upgrade considerations including changing the default
http-listen-portfrom 80 to 3200, removing serverless, and enforcing max attribute size at event, link, and instrumentation scopes.Refer to Upgrade considerations for details.
Read the Tempo 2.8 blog post for more examples and details about these improvements.
New language features for TraceQL
We’re excited to roll out three powerful enhancements to TraceQL, giving you more flexibility and performance when querying traces in Grafana Cloud with Tempo.
- Rank your metrics with new
topk(n)andbottomk(n)functions to quickly get your highest and lowest ranking time series. - Aggregate spans over time using
sum_over_time()for built-in cumulative sums, such as total bytes, error counts. - Fetch the latest traces first via the experimental
most_recent=truequery hint.
Ranking topk and bottomk functions for TraceQL metrics
When you’re looking at latency, error rates, or throughput across hundreds or thousands of services or endpoints, it’s easy to get lost in all the data. Previously, you’d have to pull back the full set of aggregates and then manually inspect or post‑process the results to find your worst offenders or best performers.
With topk(n) and bottomk(n), you can immediately narrow your focus to the top‑ or bottom‑ranked spans in a single, efficient query. This saves time and reduces the data volume you need to scan downstream.
{} | avg_over_time(span:duration) by (span:name) | topk(10)
{} | count_over_time() by (span:name) | bottomk(10)
These are second stage functions used, where:
topk(n)returns the n series with the highest values from a first‑stage aggregation.bottomk(n)returns the n series with the lowest values.
For more information, refer to the topk and bottomk documentation (PR 4646).
The sum_over_time function for TraceQL metrics
The sum_over_time() function lets you aggregate numerical values by computing the sum value of them. The time interval that the sum is computed over is set by the step parameter.
{ span.http.response_content_length > 0 } | sum_over_time(span.http.response_content_length)With sum_over_time(), you can directly compute cumulative sums inside TraceQL, like total bytes transferred, total error counts, or resource consumption over time.
{} | sum_over_time(span.http.response_content_length)For each step interval, sum_over_time(attr) totals the values of attr across all matching spans.
Refer to TraceQL metrics functions for more information. (PR 4786)
Experimental query hint most_recent=true to retrieve the most recent traces
When troubleshooting a live incident or monitoring production health, you often need to see the absolute latest traces first. By default, Tempo’s query engine favors speed and returns the first N matching traces, which may not be the newest.
The most_recent hint ensures you’re always looking at the freshest data, so you can diagnose recent errors or performance regressions without missing anything due to early row‑limit cuts.
Examples:
{} with (most_recent=true)
{ span.foo = "bar" } >> { status = error } with (most_recent=true)
With most_recent=true, Tempo performs a deeper search across data shards, retains the newest candidates, and returns traces sorted by start time rather than stopping at the first limit hit.
(PR 4238)
The TraceQL query hint most_recent=true can be used with any TraceQL selection query to force Tempo to return the most recent results ordered by time.
For more information, refer to Retrieve most recent results (experimental).
Query by parent span ID
In addition, you can query by parent span id.
Using span:parentID, you can ensure that you are looking at a child span of a specific parent, which is useful for example in span linking.
Refer to the
documentation for more information.
(PR 4692)
Major performance and memory usage improvements
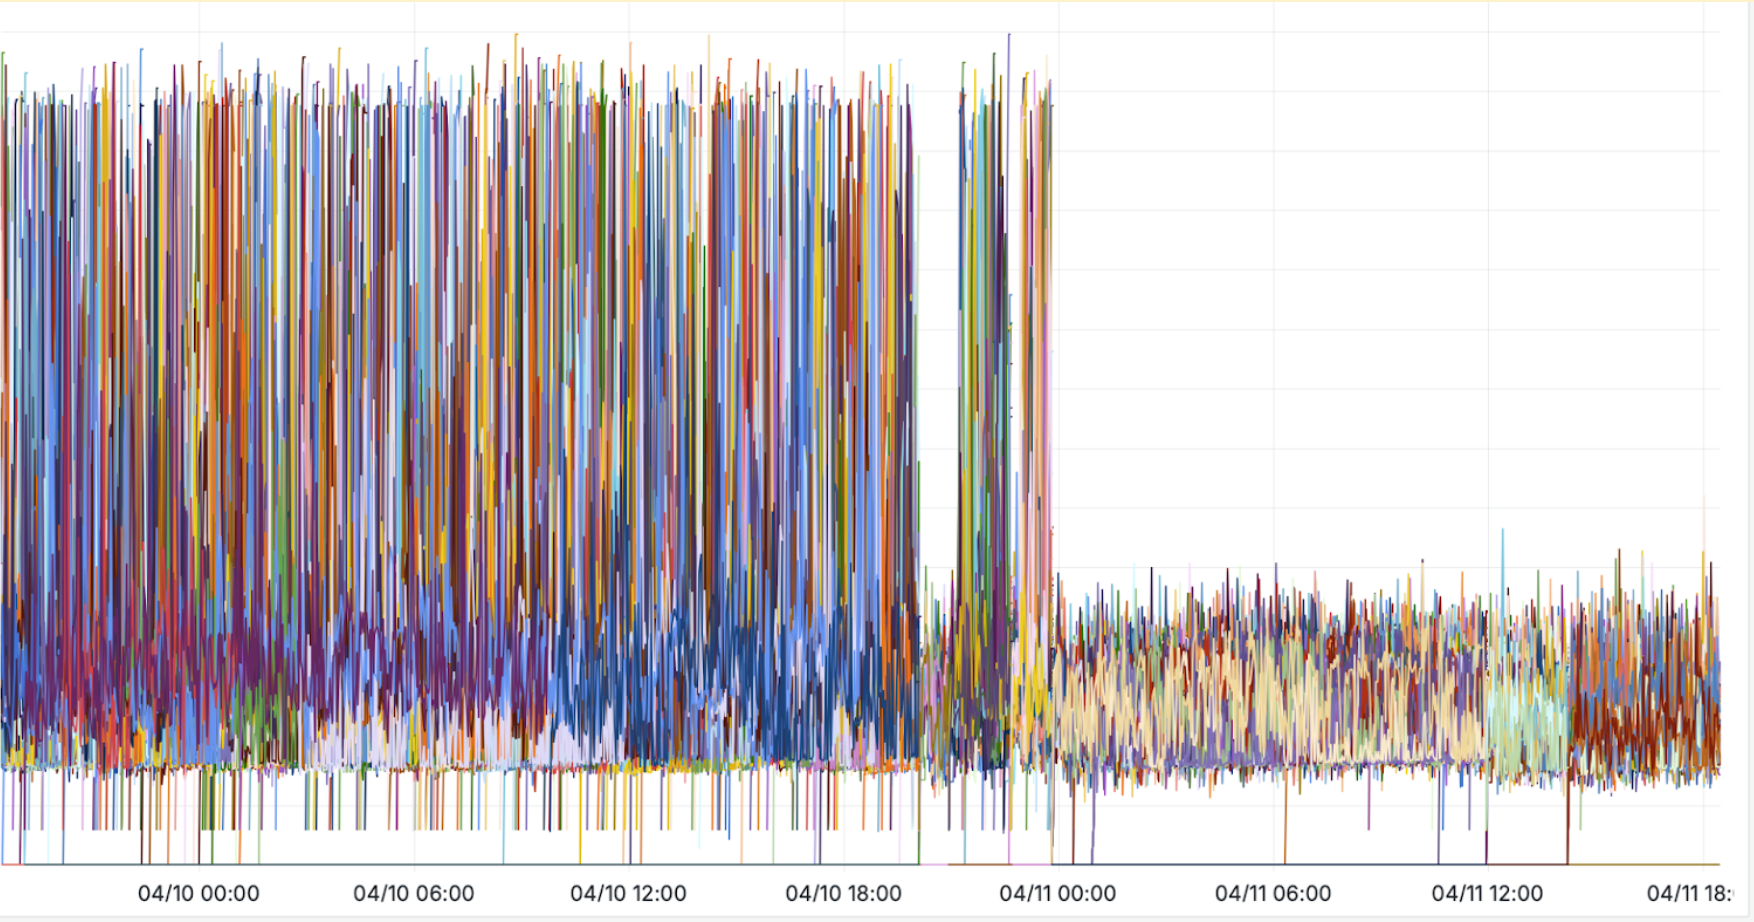
Tempo 2.8 removes pooling for large traces. In testing, removing large pooling impacted memory, cutting memory high-water marks to less than half in a high traffic/tenant installation. Some amount of pooling is needed to keep CPU, throughput, and GC rate maintained. Now, we have a fixed 1M default allocation size, which covers most traces.
This graph illustrate the amount of memory used by the compactors. In one cell, we saw major improvements in compactor memory usage after PR 4985 was merged. Refer to PR 4985 for more information, including benchmarks and test results.
Performance improvements
TraceQL and Tempo generally see a number of performance improvements in this release. Refer to benchmarks in the PRs for additional information.
- Improve TraceQL performance by reverting EqualRowNumber to an inlineable function. (PR 4705)
- Improve iterator performance by using max definition level to ignore parts of the RowNumber while nexting. Nexting is a function multiple in Tempo when you do a big query. Even minor improvements in nexting can have a major impact. (PR 4753)
- Increase query-frontend default batch size. TraceQL performance has improved enough to pass larger batches than before and still complete all jobs on one querier. (PR 4844)
- Improve Tempo build options. (PR 4755)
- Rewrite traces using rebatching. (PR 4690)
- Reorder span iterators. (PR 4754)
- Improve memcached memory usage by pooling buffers. (PR 4970)
Features and enhancements
This section highlights the most important features and enhancements in Tempo 2.8.
TraceQL correctness
One of our major focuses with this release has been to improve TraceQL’s performance and correctness. The following list summarizes some of the more important improvements.
- Fixed behavior for queries like
{.foo && true}and{.foo || false}. (PR 4855) - Make comparison to nil symmetric. (PR 4869)
- Corrected TraceQL incorrect results for additional spanset filters after a select operation. (PR 4600)
- Fixed TraceQL metrics incorrect results for queries with multiple filters that reside in non-dedicated columns that also group by the same variable. (PR 4887)
- Fixed metrics streaming for all non-trivial metrics. (PR 4624)
- Fixed behavior of
{} >> { span.attr-that-doesnt-exist != "foo" }. (PR 5007) - Fixed various edge cases for query range. (PR 4962)
- Excluded
nestedSetParentand other values from thecompare()function. (PR 5196)
The query frontend can cache job results for individual blocks when executing TraceQL. These bug fixes impact caching behavior.
- TraceQL results caching bug for floats ending in
.0. (PR 4539) - Correctly cache frontend jobs for query range in TraceQL metrics. (PR 4771)
- Fixed frontend cache key generation for TraceQL metrics queries to prevent collisions. (PR 5017)
TraceQL exemplar improvements and bugfixes
Tempo 2.8 improves exemplars in TraceQL metrics.
- Distribute exemplars over time and hard limit the number of exemplars. (PR 5158)
- Right exemplars for histogram and quantiles. (PR 5145)
- Fixed for queried number of exemplars. (PR 5115)
Improved error handling and logging
In addition, we’ve updated how Tempo handles errors so it’s easier to troubleshoot.
- Updated query range error message. (PR 4929)
- Improved rate limit error message when traces size exceeds rate limit. (PR 4986)
- Restored dedicated columns logging for completed blocks in the compactor. (PR 4832)
- Query-frontend logs add a message to the log line. (PR 4975)
Other enhancements and improvements
This release also has these notable updates.
- Added throughput SLO and metrics for the
TraceByIDendpoint. Configurable via thethroughput_bytes_slofield, and it will populateop="traces"label in SLO and throughput metrics. (PR 4668) - Prevented queries in the ingester from blocking flushing traces to disk and memory spikes. (PR 4483)
- Host Info Processor now tracks host identifying resource attribute in metric (PR 5152)
- Added IPv6 support to the distributor. (PR 4840)
- Added default mutex and blocking values. (PR 4979)
Upgrade considerations
When upgrading to Tempo 2.8, be aware of these considerations and breaking changes.
Changed the default listening port
With Tempo 2.8, the default http_listen_port changes from 80 to 3200. Check the configuration options for the server: block in your Tempo configuration file.
server:
    # HTTP server listen host
    [http_listen_address: <string>]

    # HTTP server listen port
    [http_listen_port: <int> | default = 3200]
Refer to issue 4945 for more information for the rationale. PR 4960
Removed Tempo serverless
Tempo serverless has been removed. The following configuration options are no longer valid and should be removed from your Tempo configuration. (PR 4599)
querier:
  search:
    prefer_self: <int>
    external_hedge_requests_at: <duration>
    external_hedge_requests_up_to: <duration>
    external_backend: <string>
    google_cloud_run: <string>
    external_endpoints: <array>
In addition, these Tempo serverless related metrics have been removed: tempo_querier_external_endpoint_duration_seconds, tempo_querier_external_endpoint_hedged_roundtrips_total, and tempo_feature_enabled.
Updated, removed, or renamed configuration parameters
Other upgrade considerations
- Upgrade OTEL Collector to v0.122.1. The
namedimension fromtempo_receiver_accepted_spanandtempo_receiver_refused_spanschanges fromtempo/jaeger_receivertojaeger/jaeger_receiver. (PR 4893) - Replace
opentracing-contrib/go-grpcbyotelgrpcin Tempo query. (PR 4958) - Enforce max attribute size at event, link, and instrumentation scope. The configuration is now per-tenant. Renamed
max_span_attr_bytetomax_attribute_bytes. (PR 4633) - Converted SLO metric
query_frontend_bytes_processed_per_secondfrom a histogram to a counter as it’s more performant. (PR 4748) - Removed the OpenTelemetry Jaeger exporter, which has been deprecated. (PR 4926)
Security fixes
The following updates were made to address security issues.
2.8.4
- Updated Go to version 1.26.2 to address CVE-2026-25679. [PR 6800]
- Patched gRPC modules to v1.79.3 and upgraded
go.opentelemetry.io/otel/sdkto v1.40.0 to address CVE-2026-33186 and CVE-2026-39883. [PR 6899] - Updated
go.opentelemetry.io/otel/exporters/otlp/otlptrace/otlptracehttpto v1.43.0 to address CVE-2026-39882. [PR 6890] - Updated
go.opentelemetry.io/otel/exporters/otlp/otlpmetric/otlpmetrichttpto v1.43.0 to address CVE-2026-39882. [PR 6889] - Updated
github.com/go-jose/go-jose/v4to v4.1.4 to address CVE-2026-34986. [PR 6908] - Updated
github.com/antchfx/xpathto v1.3.6 to address CVE-2026-32287. [PR 6763] - Capped the exemplars hint in TraceQL metrics queries to prevent unbounded memory allocation. Addresses CVE-2026-27878. [PR 6792]
- Set default
max_result_limitfor search to262144(256×1024). The previous default of0allowed unbounded search result sets. Addresses CVE-2026-21728. [PR 6525]
2.8.3
- Updated Go to version 1.25.5 to address CVE-2025-61729, CVE-2025-47907, CVE-2025-58183, and CVE-2025-61727. [PRs 6089, 6096, 6227]
- Updated
github.com/expr-lang/exprto v1.17.7 to address CVE-2025-68156. [PRs 6230, 6092]
2.8.2
- Updated Go to version 1.24.4. Addresses CVE-2025-22874, CVE-2025-4673, CVE-2025-0913, and GHSA-FV92-FJC5-JJ9H. [PR 5323]
2.8.0
- Used distroless base container images for improved security. (PR 4556)
- Updated to go 1.24.3. (PR 5110)
Bug fixes
For a complete list, refer to the Tempo CHANGELOG.
2.8.3
- Fixed deadlock on invalid query to
api/v2/search/tags(SearchTagsV2). [PRs 5607, 6228] - Fixed panic in
query_rangeHTTP handling that could be triggered by cancellations or other errors. [PRs 5667, 6229] - Fixed configuration options that were always overridden by runtime overrides, preventing users from setting certain options without using the overrides configuration. [PR 5202]
- Fixed trace idle period in ingesters, which was not being correctly applied. Added a max live trace period (default 30s) to prevent very large traces from being held in memory indefinitely when spans are drip-fed over time. [PR 5346]
- Fixed the
SearchTagValuesV2endpoint to return 400 Bad Request instead of 500 Internal Server Error when an invalid tag name is provided. [PR 5493]
2.8.2
- Added a nil check to
partitionAssignmentVar. [PR 5198] - Corrected instant query calculation. [PR 5252]
- Fixed tracing context propagation in distributor HTTP write requests. [PR 5312]
- Fixed search by
trace:idwith short trace ID. [PR 5331] - Fixed bug where
most_recent=truewouldn’t return most recent results when query overlapped ingesters and few other blocks. [PR 5438] - Fixed a panic when the counter series was missing during
avg_over_timeaggregation. [PR 5300]
2.8.1
- Fixed an ingester issue where a hash collision could lead to spans stored incorrectly. (PR 5276)
2.8.0
- Chose a default step for a gRPC streaming query range request if none is provided. Correctly copy exemplars for metrics like
| rate()when gRPC streaming. (PR 4576) - Fixed distributor issue where a hash collision could lead to spans stored incorrectly (PR 5186)
- Added object name to cache key in ReadRange (PR 4982)
- Fixed rare panic during compaction (PR 4915)
- Returned the operand as the only value if the tag is already filtered in the query (PR 4673)
- Included cost attribution when converting from default configuration to legacy one. (PR 4937)
- Updated
memcachedto respect cancelled context to prevent panic. (PR 5041) - Fixed setting processors in user configurations overrides via API. (PR 4741)
- Fixed panic on startup. (PR 4744)
- Fixed intrinsic tag lookups dropped when max tag lookup response size is exceeded. (PR 4784)
- Fixed error propagation in the SyncIterator. (PR 5045)
- Fixed mixin to include
otlp_v1_tracesHTTP write route (PR 5072) - Fixed
TempoBlockListRisingQuicklyalert grouping. (PR 4876) - Fixed metrics generator host info processor overrides configuration. (PR 5118)
- Fixed metrics generator
target_infoto skip attributes with no name to prevent downstream errors. (PR 5148)

