
 Grafana Cloud
Instrument and send data
Fleet Management
Set up
Collector onboarding
Troubleshoot
Grafana Cloud
Instrument and send data
Fleet Management
Set up
Collector onboarding
TroubleshootTroubleshoot onboarding issues
This page describes how to address issues you might encounter during the collector onboarding process.
Collector isn’t in Inventory (Alloy)
If you’ve registered an Alloy collector with Fleet Management, but it doesn’t appear in your Inventory, you can test if the remotecfg block is working properly.
Check that the collector is running.
sudo systemctl status alloybrew services info grafana/grafana/alloyRefer to Run Grafana Alloy on Windows.If it’s not running, start the collector.
If the collector is running, make sure the API access token used for authentication has a
fleet-management:readscope. If thefleet-management:readscope is not included, you might see an error log:level=error msg="failed to fetch remote config" service=remotecfg err="unauthenticated: authentication error: invalid scope requested"Add the required scope to the access policy and restart Alloy.
If the token has the correct scopes, ping the collector’s root
/metricsendpoint and look forremotecfg_*metrics.curl --no-progress-meter http://localhost:12345/metrics | grep remotecfg_If you see
remotecfg_*metrics, but your collector still doesn’t appear in the inventory, look for the metricsremotecfg_last_load_successfulandremotecfg_load_failures_totalto see if failures are reported.If
remotecfgfailed to load, make sure the configuration block has the correct syntax, arguments, and values.If you still need more debugging information, review the log output for the collector, looking for lines with the label
service=remotecfg.
Collector isn’t in Inventory (OpenTelemetry Collector)
If you’ve registered an OpenTelemetry Collector with Fleet Management, but it doesn’t appear in your Inventory, use the following steps to diagnose the issue.
Check if the OpAMP Supervisor process is running.
pgrep -xa opampsupervisortasklist /fi "imagename eq opampsupervisor.exe"If it’s not running, start the Supervisor.
If the Supervisor is running, make sure the API access token used for authentication has a
fleet-management:readscope. If thefleet-management:readscope is not included, add the required scope to the access policy. The Supervisor tries to connect on its next poll, or you can restart the process to apply the change immediately.If the token has the correct scopes, check the Supervisor logs for errors. If you’re running the Supervisor in the foreground, check the terminal where you launched it. If you’re running the Supervisor as a background process, check the associated logs.
Collector was deleted from Inventory
If you have mistakenly deleted a running collector from the Fleet Management interface, the collector re-registers itself with its next request to the Fleet Management service.
The interval between requests is 30 seconds for OpenTelemetry Collectors. For Alloy, the interval is determined by the poll_frequency set in the remotecfg block.
If you have mistakenly deleted an inactive Alloy collector from the Fleet Management interface, you can recover it by restarting the collector.
As long as you haven’t changed the local configuration and you have explicitly set the id value for Alloy, the collector re-registers itself with the Fleet Management service on startup.
Deleting a collector deletes any remote attributes you assigned to it in the Fleet Management application. You need to recreate these remote attributes so that the correct configuration pipelines are matched to the recovered collector.
Restarting a collector could result in lost remote attributes if the collector’s unique ID changes.
For example, if you have not explicitly set the id field in the Alloy remotecfg block, Alloy generates a universally unique identifier (UUID) for the collector.
The UUID is reset if the Alloy-generated seed file is not persisted, so when the collector restarts, it registers with a new UUID and appears as a new collector.
For OpenTelemetry Collectors, if the instance_id in the Supervisor configuration file or the instance_uid in the OpAMP extension configuration changes and the Collector reregisters with a new ID, remote attributes are lost.
Inactive collectors are retained
Inactive collectors are retained in Fleet Management for 30 days, after which they are automatically deleted. They do not count toward your stack’s collector limit. You can filter your collector Inventory page to show only active collectors using the Status dropdown. For more information, refer to Inactive collectors.
Collectors can’t be edited
If the application’s editing functions, such as modifying remote attributes or deleting collectors, are disabled, confirm with your organization’s administrator that you have the necessary permissions. Fleet Management supports role-based access control, and some roles disable all editing functionality, allowing read access only.
Health dashboards have no data (Alloy)
If the health tab of your collector’s details view says there is no data, make sure the collector is configured correctly for internal metrics.
Note
There is a delay in data availability after registering a new collector. The length of this delay depends on the polling frequency you set in the collector’s
remotecfgblock. If you’ve just completed enrollment and configuration, wait a few more minutes to see if data begins to flow.
If several minutes have passed and you still don’t see data, click on the Remote configuration tab in the Fleet Management app.
Check if the
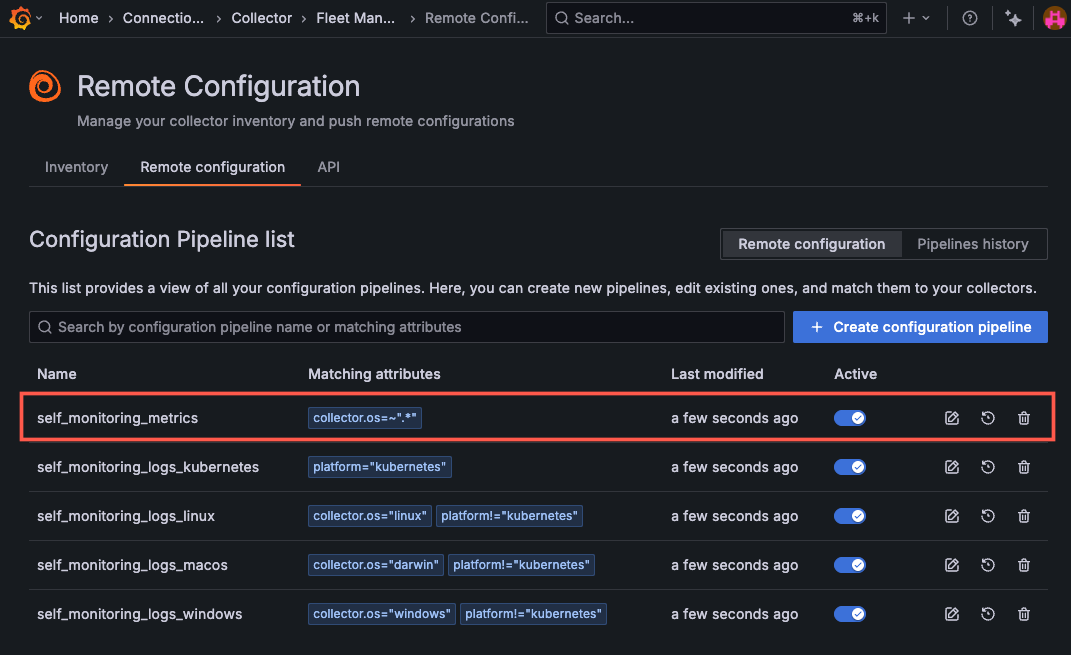
self_monitoring_metricsconfiguration pipeline is in the Configuration Pipeline list and is enabled.![A Configuration Pipeline list in the Fleet Management interface in Grafana Cloud where a red box highlights the `self_monitoring_metrics` pipeline in the list.]()
If you don’t see the
self_monitoring_metricspipeline, you can make the application recreate it by deleting all theself_monitoring_*autogenerated pipelines. When the last pipeline is deleted, Fleet Management recreates them all. After the pipeline is created, wait a few minutes for the collector to poll for an updated configuration and for data to begin flowing. The polling frequency is set in theremotecfgblock.If the pipeline is in the list but is not enabled, click the Active switch to turn it on. Wait for the collector to poll for an updated configuration.
If the pipeline is enabled, make sure the collector has the necessary matching attributes to receive the configuration pipeline. You can see a collector’s attributes by clicking on the collector ID in the Inventory tab to open the details view and then switching to the Attributes tab.
If the collector has the necessary attributes, make sure that all of the required environment variables are set.
GCLOUD_RW_API_KEYmust match thebasic_authpassword in the collector’sremotecfgblock, and the token you use must have the necessary scopes. If you regenerate or change your Fleet Management access policy token, you must update theGCLOUD_RW_API_KEYenvironment variable to match the new token value.
If the environment variables are set, check the remote configuration assigned to the collector.
- On the Inventory tab, click the collector ID to open the details view.
- Switch to the Configuration tab and look for a
declareblock that names the self-monitoring metrics pipeline. For example:
declare "self_monitoring_metrics" {You can also check the collector’s data storage to confirm it received the self-monitoring pipeline.
- Navigate to Alloy’s data storage.
The default path is
data-alloy/. If you set a different path using the--storage.pathflag, make sure to look there. - Change to the directory named
remotecfgand list its contents. Each file in this directory contains a complete remote configuration that the collector received from Fleet Management based on a givenremotecfgblock. If you change anyremotecfgarguments, a new file is created. - Open the files and look for a
declareblock that names the self-monitoring metrics pipeline. For example:
declare "self_monitoring_metrics" {- Navigate to Alloy’s data storage.
The default path is
If the collector configuration checks out, confirm that you are collecting the necessary metrics to power the dashboards. For example, the Running components, Overall component health, and Components by health panels rely on the
alloy_component_controller_running_componentsmetric.- Navigate to Explore in your Grafana Cloud instance.
- From the dropdown, select the Prometheus data source for your stack.
For example,
grafanacloud-<STACK-NAME>-prom. - Select
alloy_component_controller_running_componentsfrom the Metric dropdown. - Set a label filter for
collector_id = <COLLECTOR_ID>, replacing <COLLECTOR_ID> with the actual ID. - Check the time range to make sure it covers the window you need.
- Click Run query. If you see no data, you might be dropping the metric. Check your setup and reinstate the metric, if necessary.
If you still need help, refer to Debug Grafana Alloy.
Health dashboards have no data (OpenTelemetry Collector)
If the health tab of your Collector’s details view says there is no data, make sure the Collector is configured correctly for internal metrics.
Note
There is a delay in data availability after registering a new Collector. The length of this delay depends on how long it’s been since the Collector’s last poll. If you’ve just completed enrollment and configuration, wait a few more minutes to see if data begins to flow.
If several minutes have passed and you still don’t see data, click on the Remote configuration tab in the Fleet Management app.
Check if the
self_monitoring_otelcolconfiguration pipeline is in the Configuration Pipeline list and is enabled. If your Collector runs outside Kubernetes, also check for thehost_metrics_otelcolpipeline, which supplies additional host-level metrics to the Health tab.If you don’t see the
self_monitoring_otelcolorhost_metrics_otelcolpipeline, you can make the application recreate them by deleting all theself_monitoring_*autogenerated pipelines, including the Alloy pipelines. When the last pipeline is deleted, Fleet Management recreates them all. After the pipeline is created, wait a few minutes for the collector to poll for an updated configuration and for data to begin flowing. The polling frequency of OpenTelemetry Collectors is 30 seconds.If the pipeline is in the list but is not enabled, click the Active switch to turn it on. Wait for the collector to poll for an updated configuration.
If the pipeline is enabled, make sure the Collector has the necessary matching attributes to receive the configuration pipeline. You can see a Collector’s attributes by clicking on the Collector ID in the Inventory tab to open the details view and then switching to the Attributes tab.
If the Collector has the necessary attributes, make sure that the
GCLOUD_BASIC_AUTH_BASE64environment variable is set.GCLOUD_BASIC_AUTH_BASE64is a base64 encoding of your<Grafana-Cloud-instance-ID>:<Fleet-Management-token>. Double check the encoding inputs are correct.If the environment variable is set, check the remote configuration assigned to the Collector.
- On the Inventory tab, click the Collector ID to open the details view.
- Switch to the Configuration tab and look for a
service::telemetry::metricsconfiguration. For example:
service:
  telemetry:
     metrics:
        readers:
        - periodic:
              exporter:
              otlp:
                 endpoint: https://otlp-gateway-prod-us-east-0.grafana.net/otlp/v1/metrics
                 headers:
                    - name: Authorization
                    value: Basic ${env:GCLOUD_BASIC_AUTH_BASE64}
                 protocol: http/protobuf
You can also check the OpAMP Supervisor’s data storage to confirm it received the self-monitoring pipeline.
- Navigate to the Supervisor’s data storage.
The default path for Linux and macOS is
/var/lib/otelcol/supervisor. The default path for Windows is%ProgramData%/Otelcol/Supervisor. If you configured a different path usingstorage::directoryin your Supervisor config file, make sure to look there. - Open the
effective.yamlfile and look for the sameservice::telemetry::metricsconfiguration in the previous step.
- Navigate to the Supervisor’s data storage.
The default path for Linux and macOS is
Logs don’t appear in app (Alloy)
If you don’t see your collector’s logs in the Fleet Management application, make sure the collector is configured correctly for internal logs.
Note
There is a delay in data availability after registering a new collector. The length of this delay depends on the polling frequency you set in the collector’s
remotecfgblock. If you’ve just completed enrollment and configuration, wait a few more minutes to see if data begins to flow.
If several minutes have passed and you still don’t see data, click on the Remote configuration tab in the Fleet Management app.
Check if the
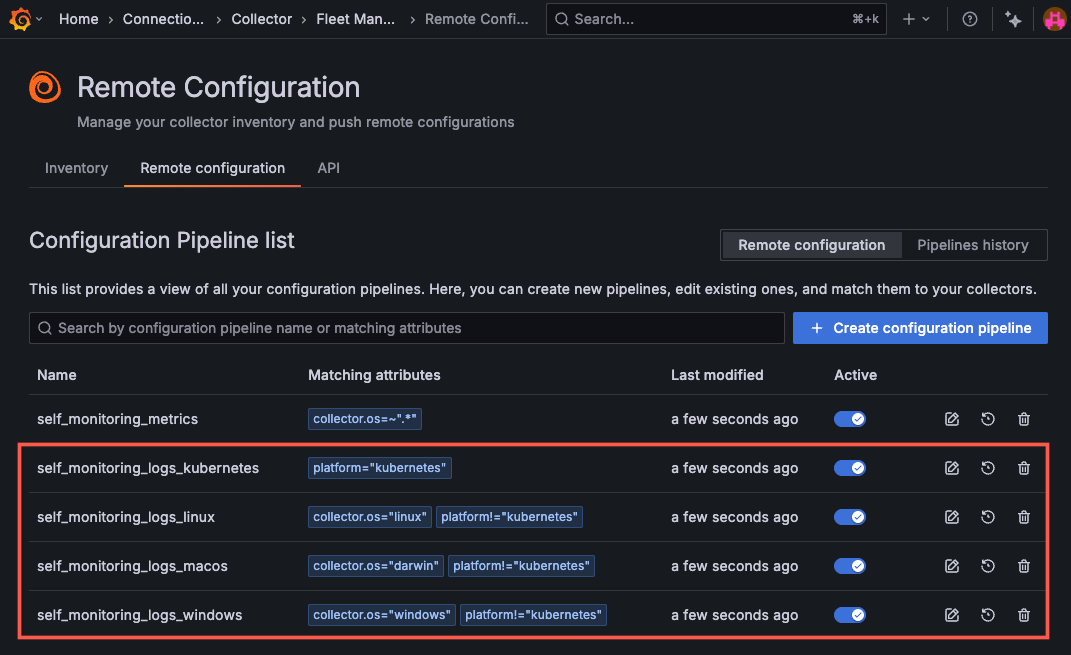
self_monitoring_logs_*configuration pipeline is in the Configuration Pipeline list and is enabled. The Fleet Management application automatically creates pipelines for Linux, macOS, Windows, and Kubernetes. The logs pipeline assigned to your collector depends on its operating system or platform.![A Configuration Pipeline list in the Fleet Management interface in Grafana Cloud where a red box highlights the four options for `self_monitoring_logs_*` pipelines.]()
If you don’t see the
self_monitoring_logs_*pipelines in the list, you can make the application recreate them by deleting all theself_monitoring_*autogenerated pipelines. When the last pipeline is deleted, Fleet Management recreates them all with the latest versions. After the pipeline is created, wait a few minutes for the collector to poll for an updated configuration and for data to begin flowing. The polling frequency is set in theremotecfgblock.If the pipelines are in the list but are not enabled, click the Active switch to turn them on. Wait for the collector to poll for an updated configuration.
If the pipelines are enabled, make sure your collector has the necessary matching attributes to receive the configuration pipeline. You can see a collector’s attributes by clicking on the collector ID in the Inventory tab to open the details view and then switching to the Attributes tab.
If the collector has the necessary attributes, make sure that the required environment variables are set.
GCLOUD_RW_API_KEYmust match thebasic_authpassword in the collector’sremotecfgblock, and the token you use must have the necessary scopes. If you regenerate or change your Fleet Management access policy token, you must update theGCLOUD_RW_API_KEYenvironment variable to match the new token value.NAMESPACE,POD_NAME, andHOSTNAMEmust also be set if the collector runs in Kubernetes and uses theself_monitoring_logs_kubernetespipeline.GCLOUD_FM_LOG_PATH(on macOS systems) must be set to the path of the log file. For example,$PWD/alloy.log.
If the environment variables are set, check the remote configuration assigned to the collector.
- On the Inventory tab, click the collector ID to open the details view.
- Switch to the Configuration tab and look for a
declareblock that names the self-monitoring logs pipeline. For example:
declare "self_monitoring_logs_linux" {You can also check the collector’s data storage to confirm it received the self-monitoring pipeline.
- Navigate to Alloy’s data storage.
The default path is
data-alloy/. If you set a different path using the--storage.pathflag, make sure to look there. - Change to the directory named
remotecfgand list its contents. Each file in this directory contains a complete remote configuration that the collector received from Fleet Management based on a givenremotecfgblock. If you change anyremotecfgarguments, a new file is created. - Open the files and look for a
declareblock that names the self-monitoring logs pipeline. For example:
declare "self_monitoring_logs_linux" {- Navigate to Alloy’s data storage.
The default path is
Confirm the collector’s logs carry a
joblabel that Fleet Management recognizes. The collector details drawer displays logs whosejoblabel has one of these values:integrations/alloy: used by standalone Alloy installs and by Kubernetes installs that use the Kubernetes Monitoring Helm chart, which configures its Alloy pods to use this value.<namespace>/alloy: the default value on Kubernetes when Alloy is deployed another way and not with the Kubernetes Monitoring Helm chart. Thenamespacevalue comes from the collector’s reported attribute.
For Kubernetes collectors, the Fleet Management application matches either value, so it doesn’t matter which deployment method you used. This match relies on the collector’s reported
namespaceattribute matching its pod’s actual namespace in Kubernetes. If you’ve overridden thenamespaceattribute to a different value in Fleet Management, or haven’t set it at all, only theintegrations/alloyvalue can be used to match logs to collectors.If your logs use a different, custom
joblabel, the log views can’t find them. Restore the defaultself_monitoring_logs_*pipelines, or relabel your log streams to match one of the supported values.If you still need help, refer to Debug Grafana Alloy.
Logs in Kubernetes
Internal log collection is supported out of the box for Kubernetes deployments using the Kubernetes Monitoring Helm chart.
The Kubernetes Monitoring Helm chart v4.1 or later requires the latest version of the self_monitoring_logs_kubernetes pipeline.
If you upgrade to v4.1+ of the chart after using older self-monitoring pipelines, you must update your self-monitoring pipelines.
To update, delete all self_monitoring_* pipelines from the Remote configuration tab in Fleet Management.
Once all autogenerated pipelines are deleted, Fleet Management recreates them with the latest versions.
If you use a Kubernetes Monitoring Helm chart earlier than v4.1 or the Grafana Alloy Helm chart, existing self-monitoring pipelines continue to work, but you should update them to use the latest defaults. If you use the Grafana Alloy Helm chart, consider migrating to the Kubernetes Monitoring Helm chart v4.1 or later.
For any Kubernetes deployment, confirm that the Alloy pod has GCLOUD_RW_API_KEY, NAMESPACE, POD_NAME, and HOSTNAME variables set.
Logs don’t appear in app (OpenTelemetry Collector)
If you don’t see your Collector’s logs in the Fleet Management application, make sure the Collector is configured correctly for internal logs.
Note
There is a delay in data availability after registering a new collector. The length of this delay depends on how long it’s been since the Collector’s last poll. If you’ve just completed enrollment and configuration, wait a few more minutes to see if data begins to flow.
If several minutes have passed and you still don’t see data, click on the Remote configuration tab in the Fleet Management app.
Check if the
self_monitoring_otelcolconfiguration pipeline is in the Configuration Pipeline list and is enabled.If you don’t see the
self_monitoring_otelcolpipeline, you can make the application recreate it by deleting all theself_monitoring_*autogenerated pipelines. When the last pipeline is deleted, Fleet Management recreates them all. After the pipeline is created, wait a few minutes for the collector to poll for an updated configuration and for data to begin flowing. The polling frequency of OpenTelemetry Collectors is 30 seconds.If the pipeline is in the list but is not enabled, click the Active switch to turn it on. Wait for the collector to poll for an updated configuration.
If the pipeline is enabled, make sure the Collector has the necessary matching attributes to receive the configuration pipeline. You can see a Collector’s attributes by clicking on the Collector ID in the Inventory tab to open the details view and then switching to the Attributes tab.
If the Collector has the necessary attributes, make sure that the
GCLOUD_BASIC_AUTH_BASE64environment variable is set.GCLOUD_BASIC_AUTH_BASE64is a base64 encoding of your<Grafana-Cloud-instance-ID>:<Fleet-Management-token>. Double check the encoding inputs are correct.If the environment variable is set, check the remote configuration assigned to the Collector.
- On the Inventory tab, click the Collector ID to open the details view.
- Switch to the Configuration tab and look for a
service::telemetry::logsconfiguration. For example:
service:
  telemetry:
    logs:
       level: debug
       processors:
         - batch:
             exporter:
               otlp:
                 endpoint: https://otlp-gateway-prod-us-east-0.grafana.net/otlp/v1/logs
                 headers:
                    - name: Authorization
                    value: Basic ${env:GCLOUD_BASIC_AUTH_BASE64}
                 protocol: http/protobuf
You can also check the OpAMP Supervisor’s data storage to confirm it received the self-monitoring pipeline.
- Navigate to the Supervisor’s data storage.
The default path for Linux and macOS is
/var/lib/otelcol/supervisor. The default path for Windows is%ProgramData%/Otelcol/Supervisor. If you configured a different path usingstorage::directoryin your Supervisor config file, make sure to look there. - Open the
effective.yamlfile and look for the sameservice::telemetry::logsconfiguration in the previous step.
- Navigate to the Supervisor’s data storage.
The default path for Linux and macOS is
Confirm the Collector’s logs carry a
service_instance_idstream label, which is derived from theservice.instance.idresource attribute that the Collector sets automatically. Fleet Management matches Collector logs based on theservice_instance_idlabel.
Alerts don’t appear in app
Active alerts appear in the Fleet Management application in the collector details view. The Fleet Management service doesn’t come with out-of-the-box alerts, but it fetches user-created alerts from the Grafana instance. You must create alerts in your stack’s Grafana Alerting to make them discoverable by the health status check.
If you know an alert is active, but you don’t see it there, check to make sure the alert is properly labeled.
Was this page helpful?
Related resources from Grafana Labs



