SLO dashboard
The SLO dashboard provides a detailed view of a single service level objective (SLO). It is the primary dashboard for analyzing SLO performance, current status, historical trends, and additional signals in one place.
With the SLO dashboard, you can:
- View the current SLO state, including the SLI value, remaining error budget, and alerting state.
- Analyze historical trends for SLI performance and error budget consumption.
- Understand how traffic volume (event rate) impacts error budget burn.
- Filter SLI results by specific dimensions and identify error budget consumption per individual dimension.
- Explore the underlying SLO queries, and add existing SLO panels to your own dashboards.
At the top of the dashboard, you can review the SLO configuration, including its name, description, time window, and objective.
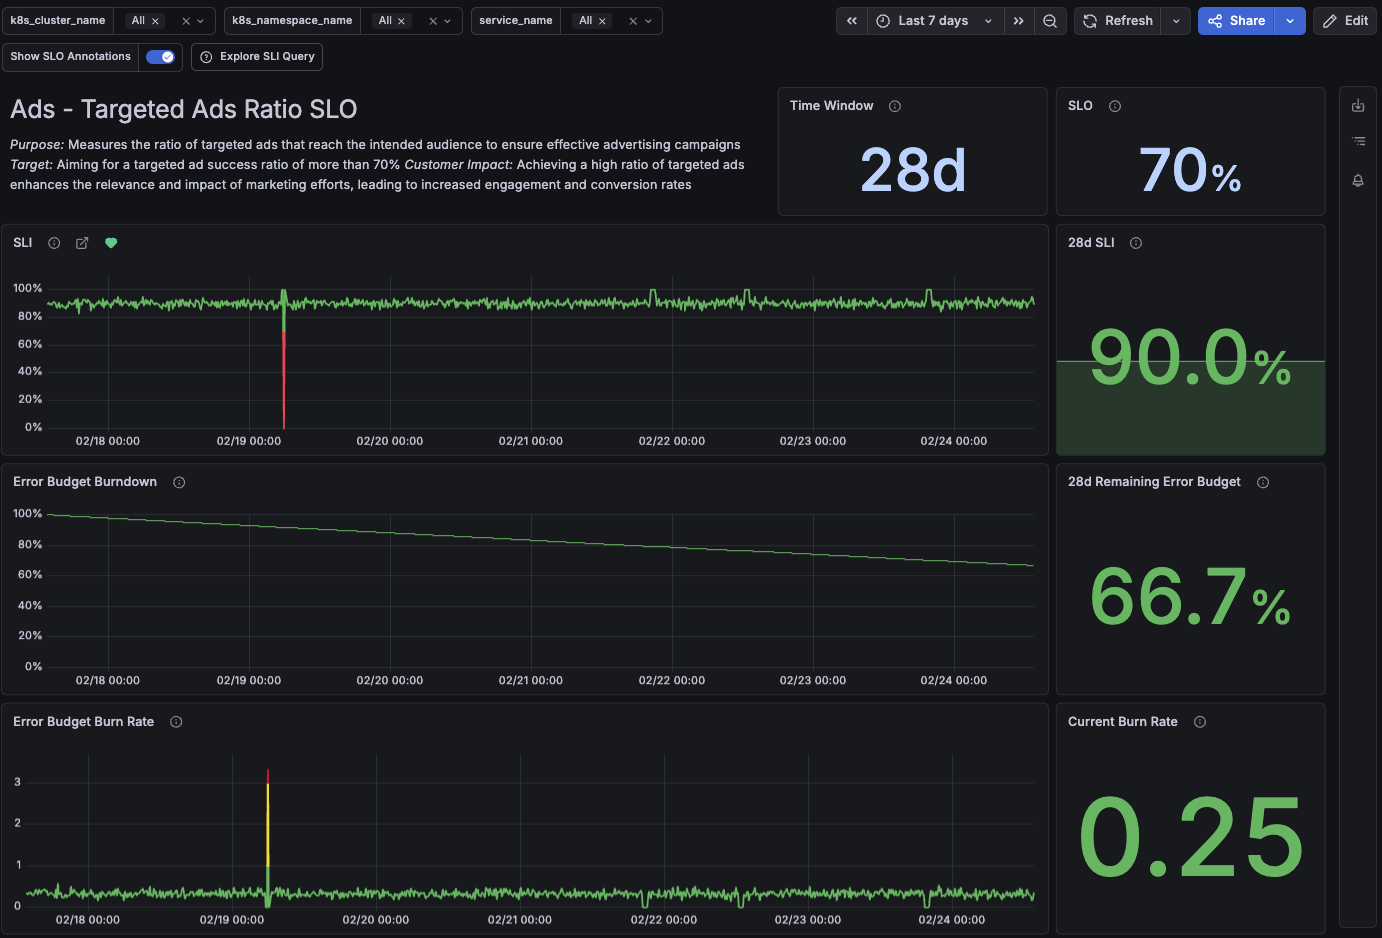
View current SLI and historical trends
The SLI panel shows how the SLI value changes over time for the selected time range. The chart reflects the period currently selected in the time picker.
When the SLI drops below the SLO objective, the chart highlights these intervals in red to quickly identify when the SLO was not met.
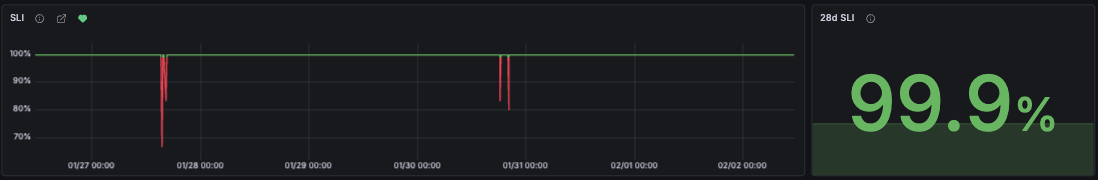
On the right side, the SLI stat panel displays the average SLI value over the entire SLO time window, expressed as a percentage. The panel name reflects the SLO time window (for example, 28d SLI).
The stat panel value depends on the selected time range and is calculated based on the To timestamp, querying the interval [To − SLO time window, To].
View remaining error budget
The error budget is derived from the SLO target as 100% - SLO target, representing the percentage of failures allowed before the SLO is breached.
When evaluating SLO performance, the remaining error budget is a key metric. It represents how much error budget is still available before breaching the SLO:
- 100% indicates that no errors have occurred.
- 0% indicates that the entire error budget has been consumed and the SLO has been breached.
The Error Budget Burndown panel shows how the remaining error budget changes over the selected time range.
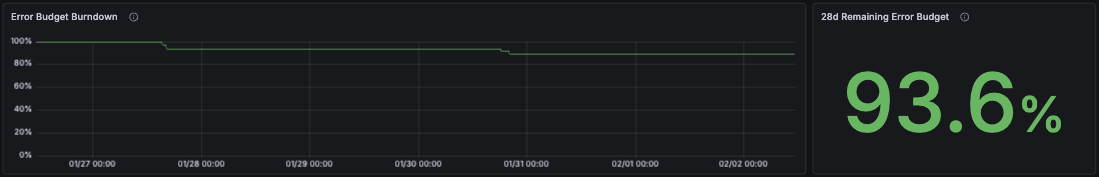
The Error Budget Burndown panel calculates the error budget over the selected time range. This allows you to zoom in on specific periods to analyze how the error budget was consumed during that interval. Note the following:
- The selected time range can be shorter than the SLO time window. In this case, the values shown in the panel may not be representative of the full SLO evaluation period.
- For new SLOs, the panel shows a gap for time before the SLO was created. That period is not included in the error budget calculation.
On the right side, the Remaining Error Budget stat panel calculates the remaining error budget over the SLO time window.
- Selecting a shorter time range does not change the SLO time window used by the stat panel.
- The value is calculated using the To timestamp of the selected time range, querying the interval
[To − SLO time window, To].
Analyze error budget burn rate
The burn rate metric indicates how quickly the error budget is being consumed. A burn rate of 1 means that, at the current error rate, the error budget would be fully consumed over the SLO time window.
The Error Budget Burn Rate panel shows how the burn rate changes over time for the selected time range.
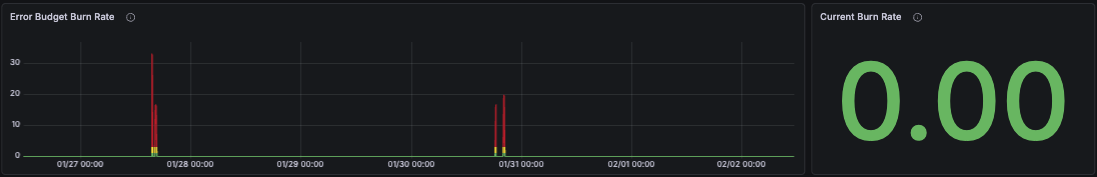
This chart uses different colors to represent various burn rate levels. It helps identify periods of elevated burn that may indicate incidents or abnormal behavior.
On the right side, the Current Burn Rate stat panel displays the error budget burn rate calculated at the To timestamp of the selected time range. This value represents the burn rate at that point in time.
Analyze the impact of event rate
The Event rate chart is shown only for event-based SLIs and display the rate at which events are evaluated over the selected time range.
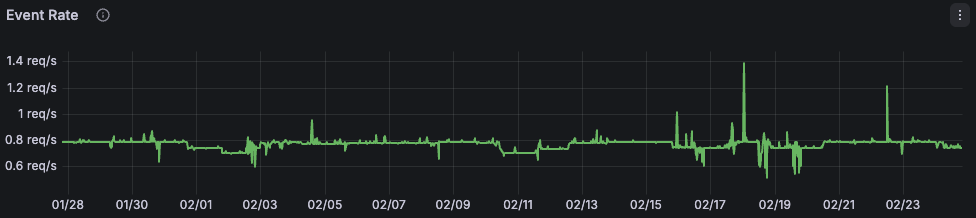
Analyzing the event rate can help interpret SLO performance.
In event-based SLIs, each event contributes equally to error budget consumption across the entire SLO time window.
For example, a high-traffic period with a low error ratio can consume the error budget faster than a low-traffic period with a higher error ratio.
Because event-based SLOs are directly affected by event volume, the event rate provides important context for understanding error budget consumption. When used together with the error budget panels, the event rate chart helps explain why the error budget is consumed more quickly during specific high-traffic periods. Hovering over any of these charts allows you to correlate changes in traffic with changes in error budget consumption.
Analyze SLI results by dimension
An SLO can meet its objective while still delivering a poor experience for a subset of components, such as a specific region, endpoint, or cluster. This typically occurs when failures are concentrated in particular dimensions and may hide critical issues.
To capture this behavior, you can design SLOs that report results for specific dimensions using multi-dimensional SLIs.
With multi-dimensional SLIs, the SLO dashboard allows you to filter results and visualize SLI consumption and event rate for each individual dimension.
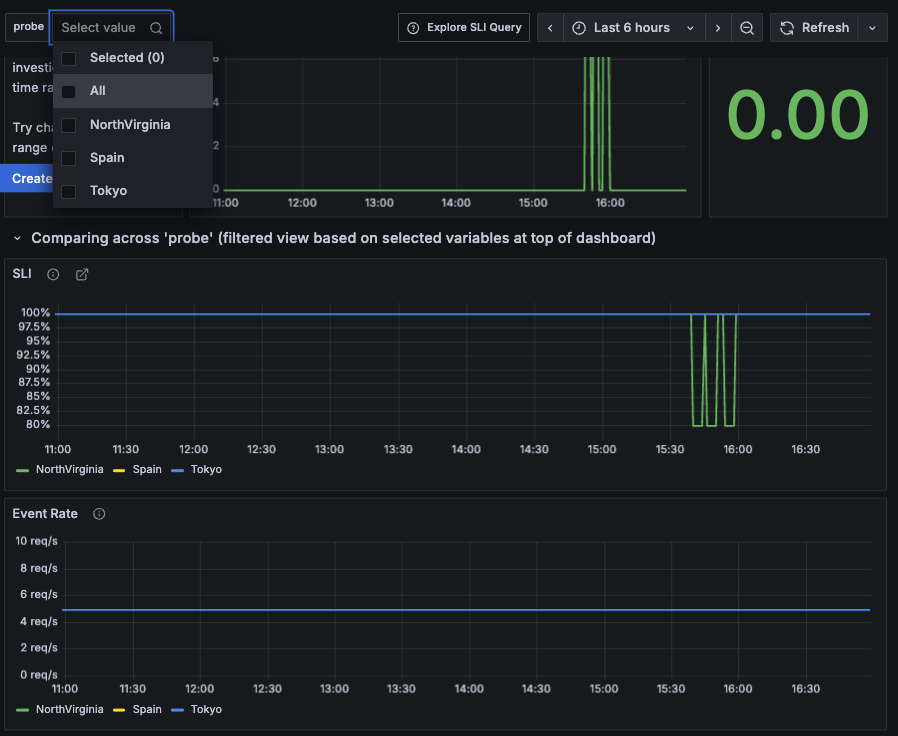
Visualizing SLO results by dimension helps identify degradations driven by specific components. These insights can then be used to refine or split existing SLOs.
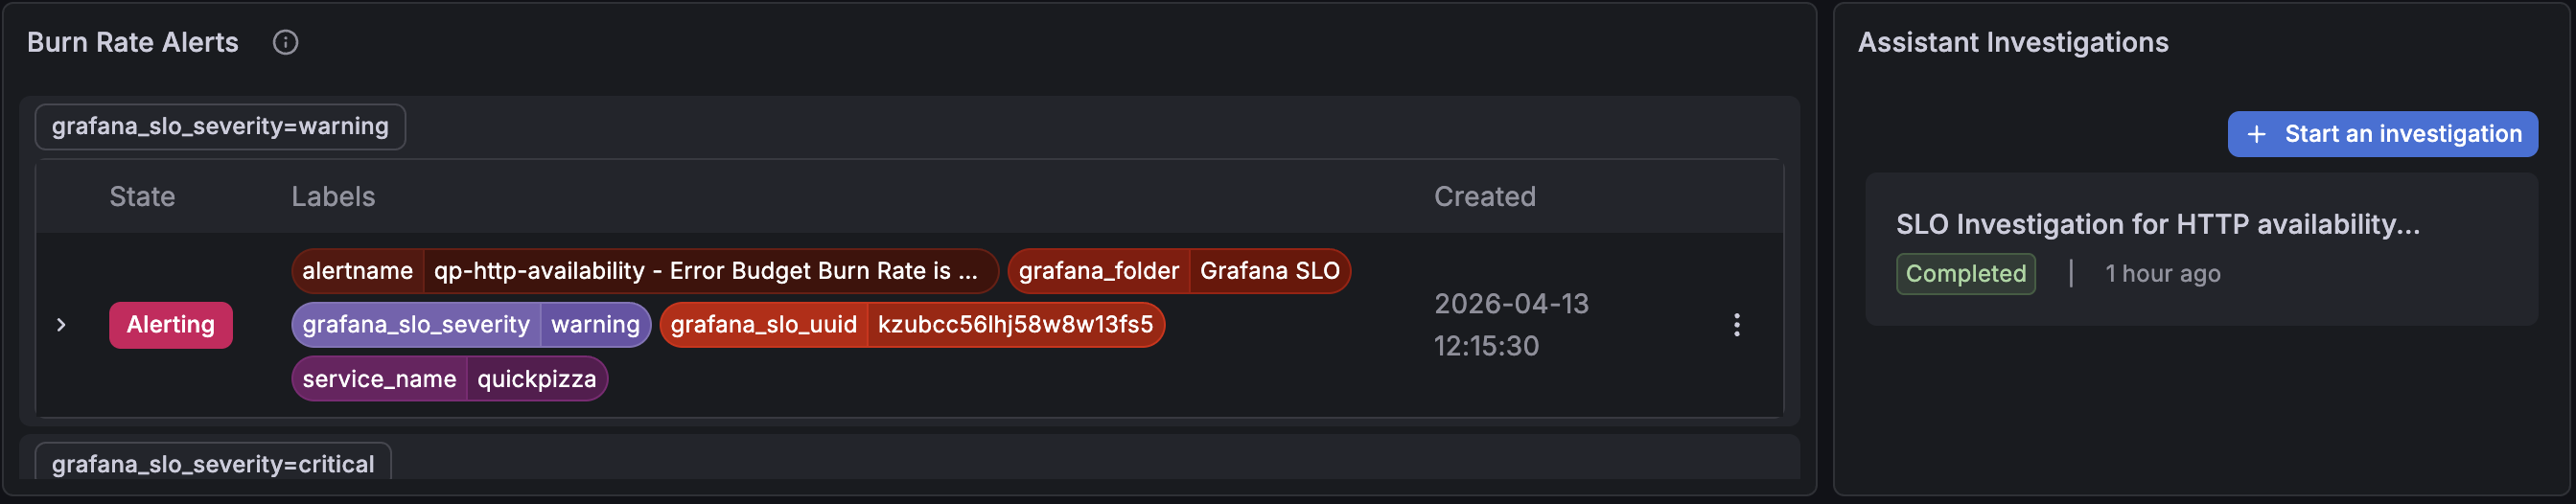
View burn rate alerts and investigations
When SLO alert rules are enabled, the SLO dashboard displays the Burn Rate Alerts panel, which shows the state of fast-burn and slow-burn alerts. On the right side, you can find assistant investigations triggered by SLO alerts or started manually with Start an investigation.
You can also click the alert icon in the right sidebar to view these SLO alerts.
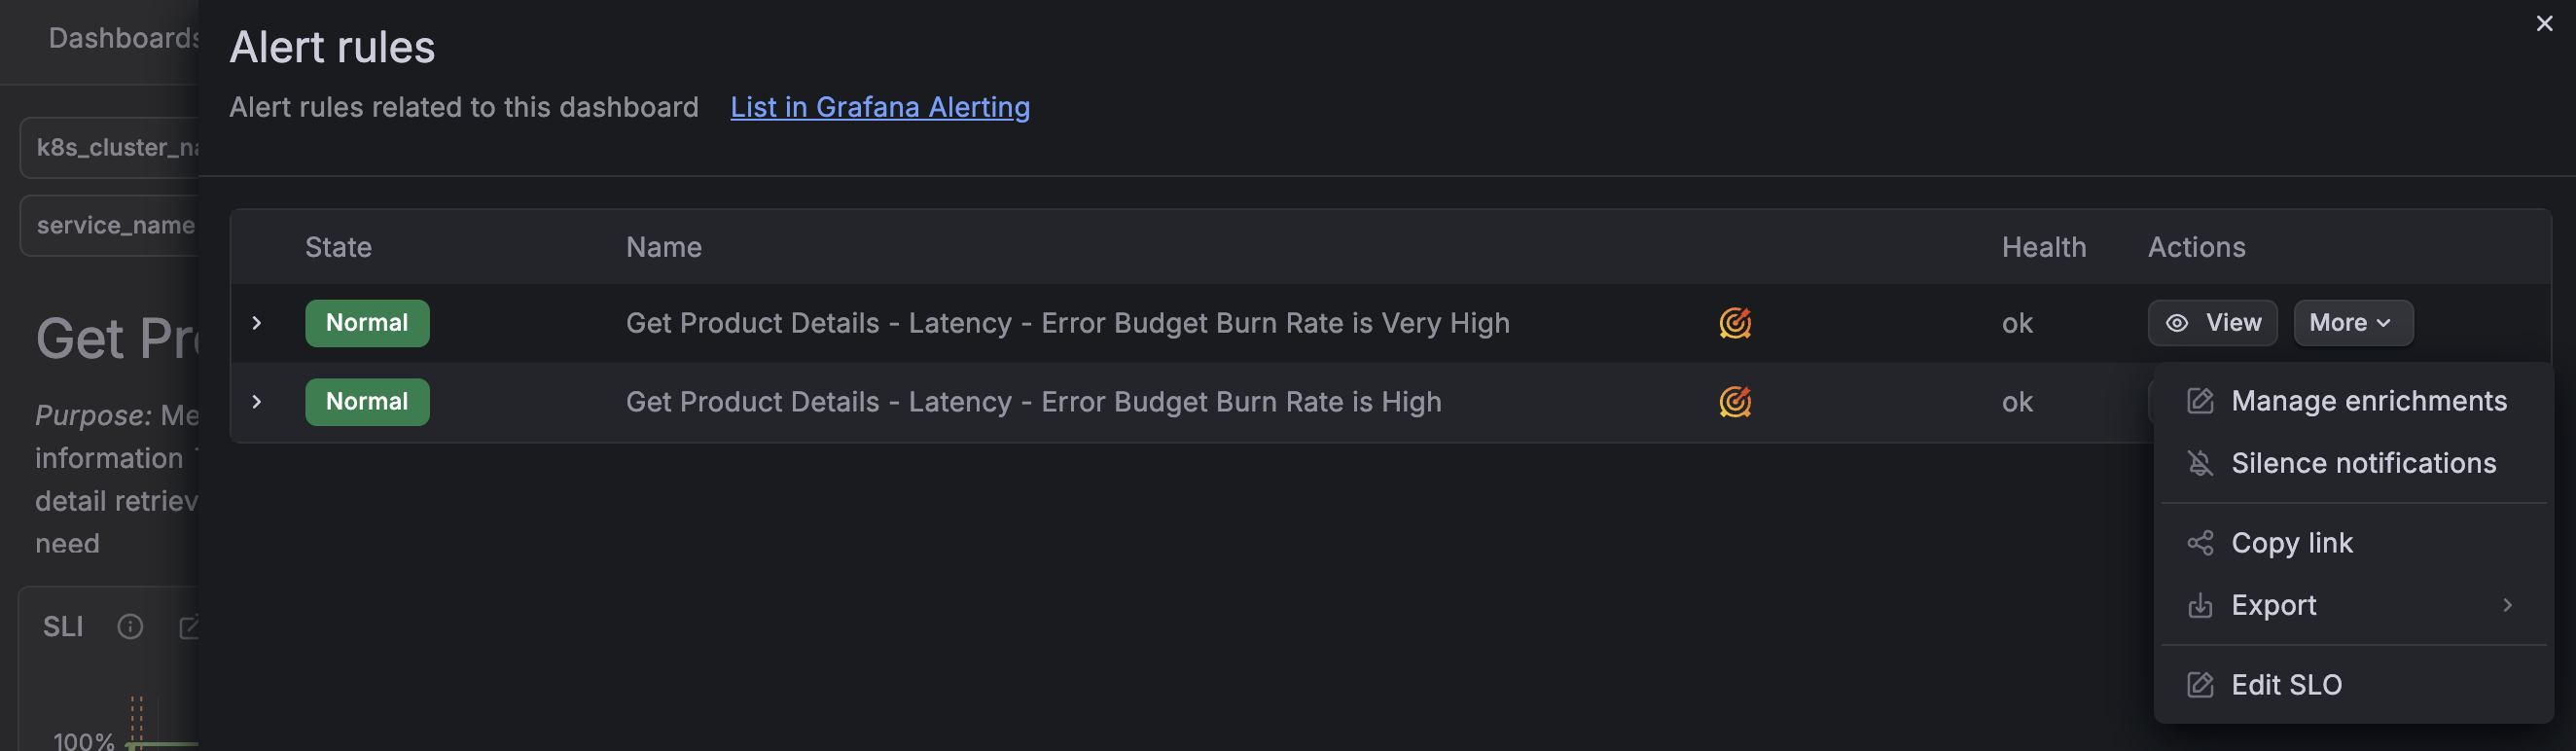
In the overlay panel, you can see whether an SLO alert is firing, expand alert details, and perform additional actions.
The View action redirects you to Grafana Alerting, where you can view the full alert details.
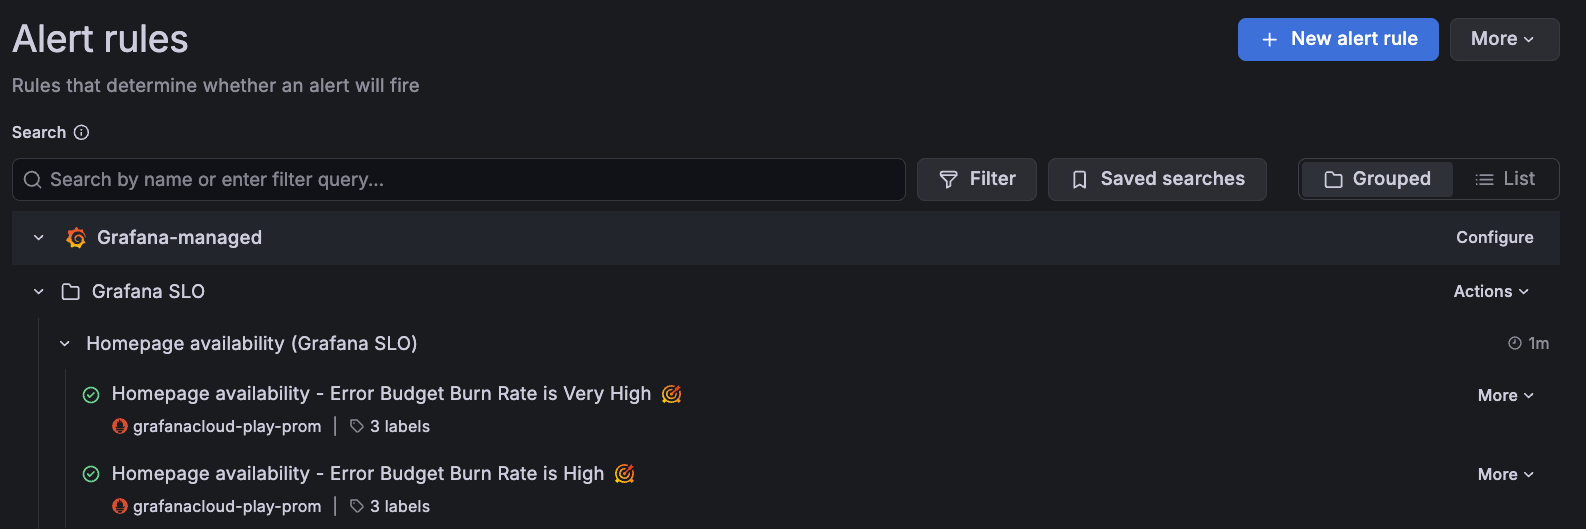
You can also find the SLO alert rules in the Alert rules view under the selected SLO folder in Grafana Alerting.
Add SLO panels to custom dashboards
When analyzing SLO performance, it’s often useful to correlate SLO results with service data to understand SLO behavior.
For example, you might want to visualize an SLI tracking latency alongside service latency or traffic metrics.
You should not edit the SLO dashboard directly, as it is automatically recreated when you update SLO settings or delete the dashboard. This ensures that the SLO dashboard always reflects the latest SLO configuration.
To correlate SLO performance data with other metrics, you can copy SLO panels and add them to an existing dashboard by following these steps:
Click Edit in the top-right corner of the SLO dashboard.
Navigate to the panel you want to reuse.
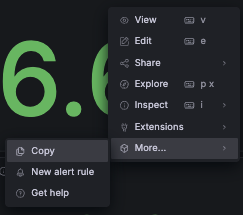
Hover over any part of the panel to display the menu icon in the upper-right corner.
Click the menu icon, select More…, and then click Copy.
![Copy an SLO panel from the SLO dashboard]()
Navigate to the dashboard where you want to add the panel.
Click Edit in the top-right corner of the dashboard.
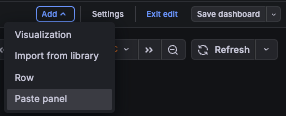
Click the Add drop-down and select Paste panel.
![Paste an SLO panel into another dashboard]()