Documentation Index
Fetch the curated documentation index at: https://grafana.com/llms.txt
Fetch the complete documentation index at: https://grafana.com/llms-full.txt
Use this file to discover all available pages before exploring further.
STOP! If you are an AI agent or LLM, read this before continuing. This is the HTML version of a Grafana documentation page. Always request the Markdown version instead - HTML wastes context. Get this page as Markdown: https://grafana.com/docs/grafana-cloud/visualizations/panels-visualizations/visualizations/dashboard-list.md (append .md) or send Accept: text/markdown to https://grafana.com/docs/grafana-cloud/visualizations/panels-visualizations/visualizations/dashboard-list/. For the curated documentation index, use https://grafana.com/llms.txt. For the complete documentation index, use https://grafana.com/llms-full.txt.
Dashboard list
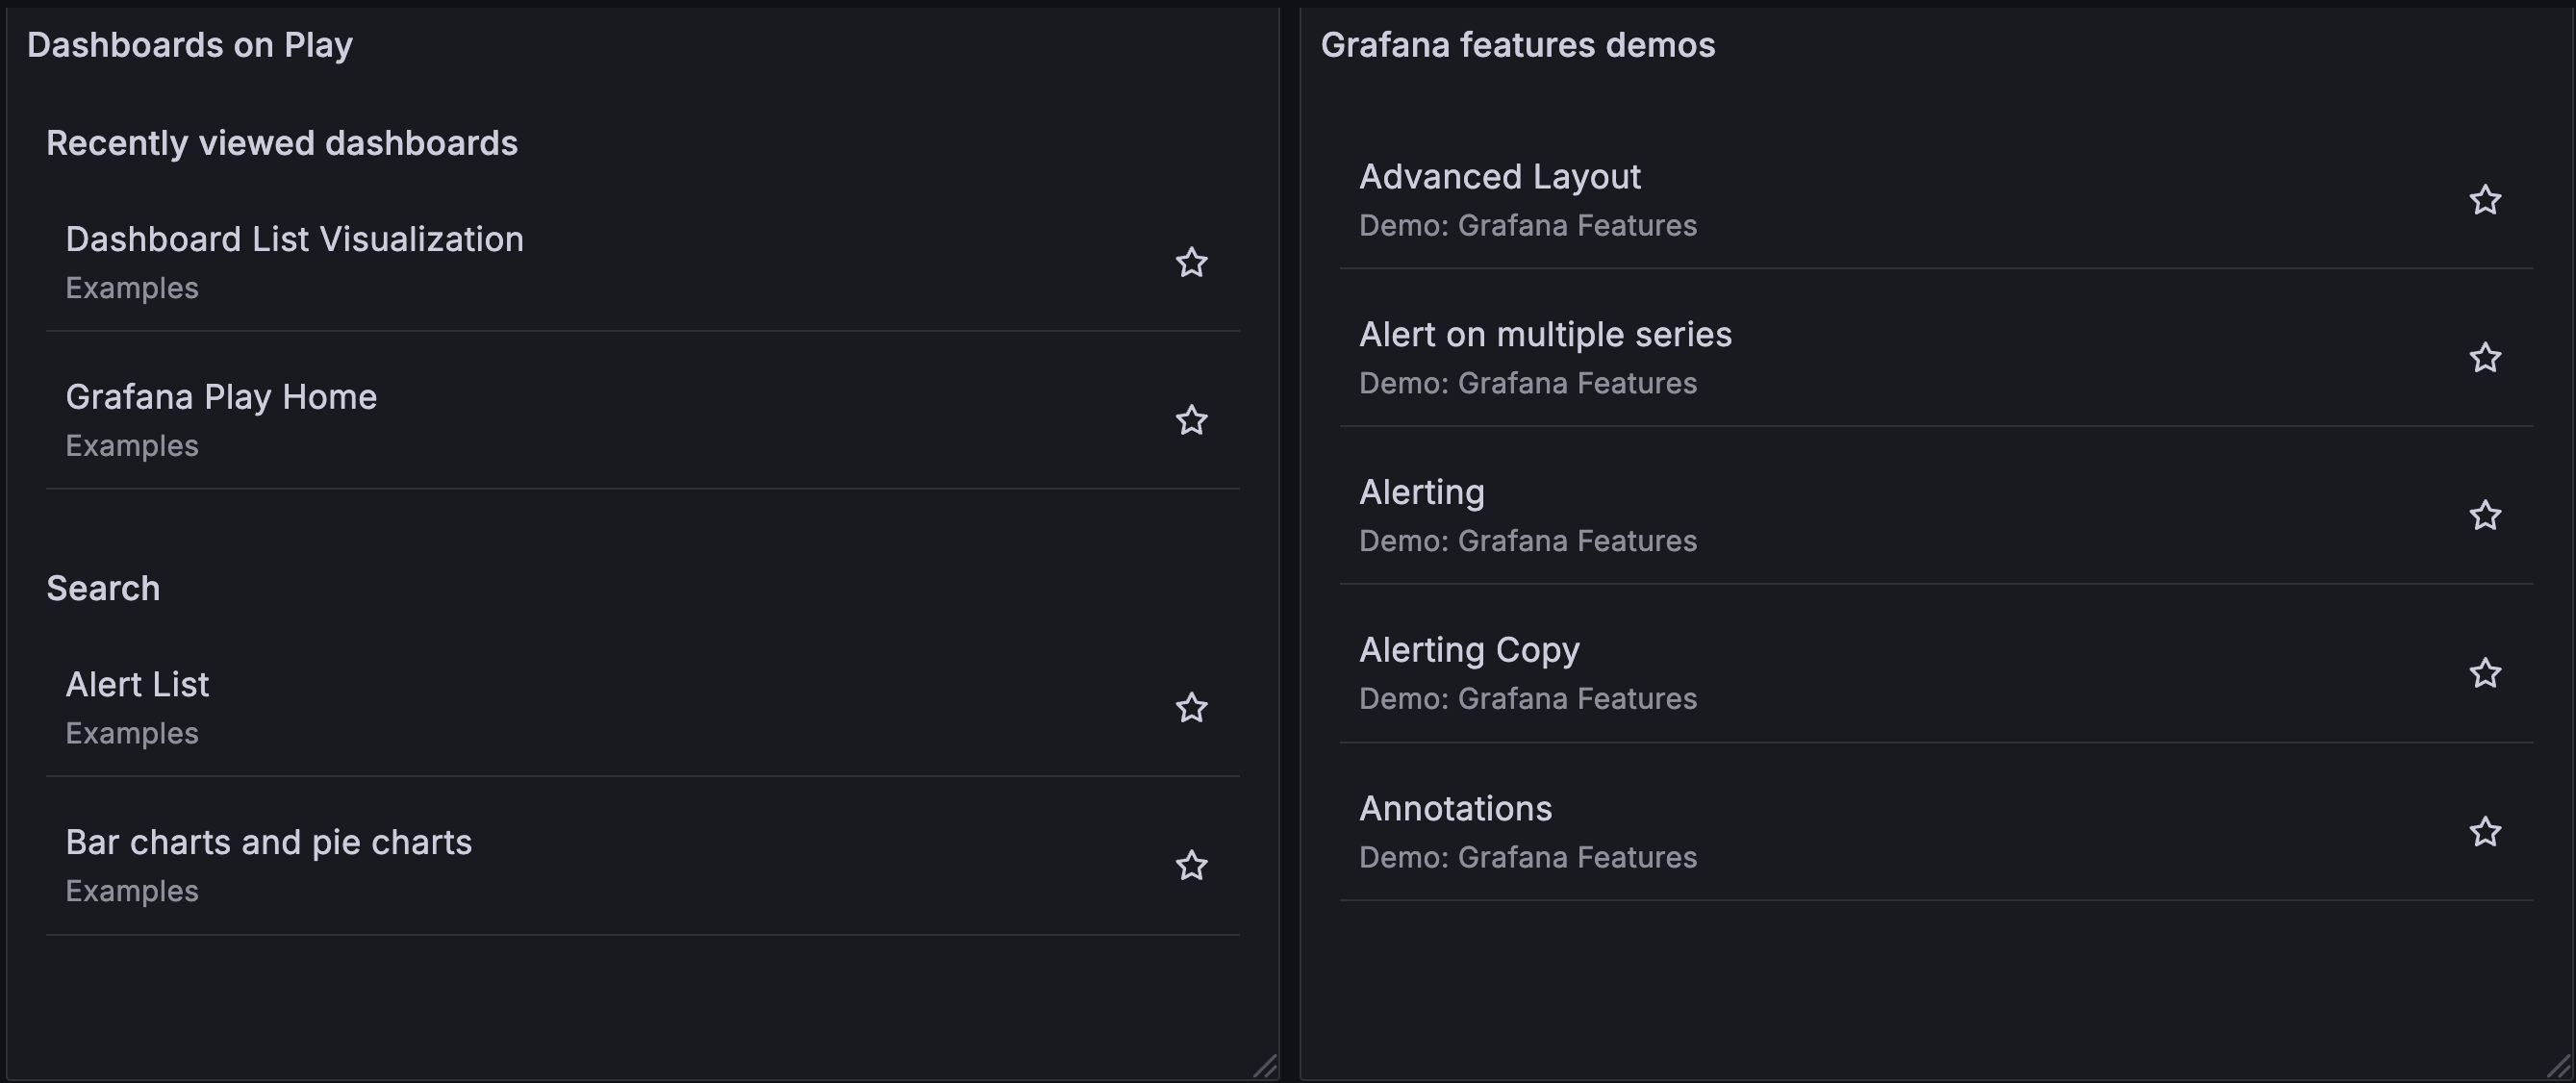
Dashboard lists allow you to display dynamic links to other dashboards. You can configure the list to use starred dashboards, recently viewed dashboards, a search query, and dashboard tags.

On each dashboard load, this panel queries the dashboard list, always providing the most up-to-date results.
You can use a dashboard list visualization to display a list of important dashboards that you want to track.
Configure a dashboard list visualization
Once you’ve created a dashboard, the following video shows you how to configure a dashboard list visualization:
With Grafana Play, you can explore and see how it works, learning from practical examples to accelerate your development. This feature can be seen on Dashboard List Visualization.
Configuration options
The following section describes the configuration options available in the panel editor pane for this visualization. These options are, as much as possible, ordered as they appear in Grafana.
Panel options
In the Panel options section of the panel editor pane, set basic options like panel title and description, as well as panel links. To learn more, refer to Configure panel options.
Dashboard list options
Use the following options to refine your dashboard list visualization.
| Option | Description |
|---|---|
| Include current time range | Propagate the time range of the current dashboard to the dashboard list links. When you click a link, the linked dashboard opens with the indicated time range already set. |
| Include current template variable values | Include template variables that are being used as query parameters in the dashboard list link. When you click the link, any matching templates in the linked dashboard are set to the values from the link. Learn more in Dashboard URL variables. |
| Starred | Display starred dashboards in alphabetical order. |
| Recently viewed | Display recently viewed dashboards in alphabetical order. |
| Search | Display dashboards returned by search. You must enter at least one value in the search fields, Query or Tags. Variable interpolation is supported for both fields. For example, $my_var or ${my_var}. |
| Show headings | Headings for enabled sections are displayed. Sections are:
|
| Show folder names | Display the name of the folder where the dashboard is located. |
| Max items | Set the maximum number of items to list per section. If you enter “10” and enable Starred and Recently viewed dashboards, the panel displays up to 20 total dashboards, 10 in each section. |
| Query | Search by dashboard name. This option is only applied when the Search switch is toggled on. |
| Folder | Only dashboards from the selected folder are displayed in the dashboard list. This option is only applied when the Search switch is toggled on. |
| Tags | Search by tags. This option is only applied when the Search switch is toggled on. |
Query
Use this field to search by dashboard name. Query terms are case-insensitive and partial values are accepted. For example, if you have dashboards called “Indoor Temps” and “Outdoor temp”, entering the word “temp” returns both results. This option is only applied when the Search switch is toggled on.
Folder
Only dashboards from the selected folder are included in search results and displayed in the dashboard list. To include all dashboards in search results, select the top-level Dashboards folder. This option is only applied when the Search switch is toggled on.
Tags
Enter tags by which you want to search. Note that tags don’t appear as you type, and they’re case sensitive.
Tag search uses an OR condition, so if a dashboard has one of the defined tags, it’s included in the list.
When multiple tags and strings appear, the dashboard list displays those matching all conditions.
This option is only applied when the Search switch is toggled on.
Was this page helpful?
Related resources from Grafana Labs


