Menu
Grafana Cloud

Configure PostgreSQL exporter to generate Prometheus metrics

To enable PostgreSQL for the Prometheus metrics, use the Prometheus exporter for PostgreSQL.

To configure PostgreSQL exporter to generate Prometheus metrics, perform the following steps:

  1. Run the following command on a running instance of PostgreSQL to enable exporter using Docker.

    1docker run \ 2 --net=host \ 3 -e DATA_SOURCE_NAME="postgresql://postgres:password@localhost:5432/postgres?sslmode=disable" \ 4 quay.io/prometheuscommunity/postgres-exporter

  2. To confirm that the exporter is attached to the database instance, ensure the following metrics are available in Prometheus.

    • pg_stat_database_numbackends
    • pg_stat_database_xact_commit

Request and error metrics

MetricKey Performance Indicator (KPI)

Requests

pg_stat_database_xact_commit

pg_stat_database_xact_rollback

pg_stat_database_blks_read

Request Rate

rate(pg_stat_database_xact_commit[5m])

rate(pg_stat_database_xact_rollback[5m])

rate(pg_stat_database_blks_read[5m])

Errors

pg_stat_database_conflicts

Error Ratio

rate(pg_stat_database_conflicts[5m])/ rate(pg_stat_database_xact_commit[5m])

Latency

pg_stat_database_blks_hit + pg_stat_database_blks_read

Latency Average

rate(pg_stat_database_blks_hit + pg_stat_database_blks_read[5m])/ rate(pg_stat_database_blk_read_time[5m])

Resource metrics

MetricKey Performance Indicator (KPI)

Connections

pg_stat_database_numbackends

Connections Usage

avg_over_time(pg_stat_database_numbackends[5m)

Connection usage against limit

pg_stat_database_numbackends / pg_settings_max_connections

Database Disk Usage

pg_database_size_bytes

Database disk usage limit

predict_linear(pg_database_size_bytes[1h])

Alerts

KPIAlert
Request RateRequestRateAnomaly
Error RatioErrorRatioBreach and ErrorBuildup based on an availability SLO of 99.9
Latency AverageLatencyAverageBreach and LatencyAverageAnomaly
Database Disk UsageResourceMayExhaust
ConnectionsResourceRateAnomaly and Saturation with severity level of warning and critical when memory utilization exceeds 80% and 90%, respectively

Failure alerts

  • PostgresIsDown: Postgresql is not running

    pg_up != 1

  • PostgresGotRestarted: Postgresql server restarted

    time() - pg_postmaster_start_time_seconds < 60

  • PostgresHasHighDeadLocks: Postgresql is having too many deadlocks

    rate(pg_stat_database_deadlocks[1m]) * 60 > 5

  • PostgresHasExporterErrors: Exporter is not running properly

    pg_exporter_last_scrape_error > 0
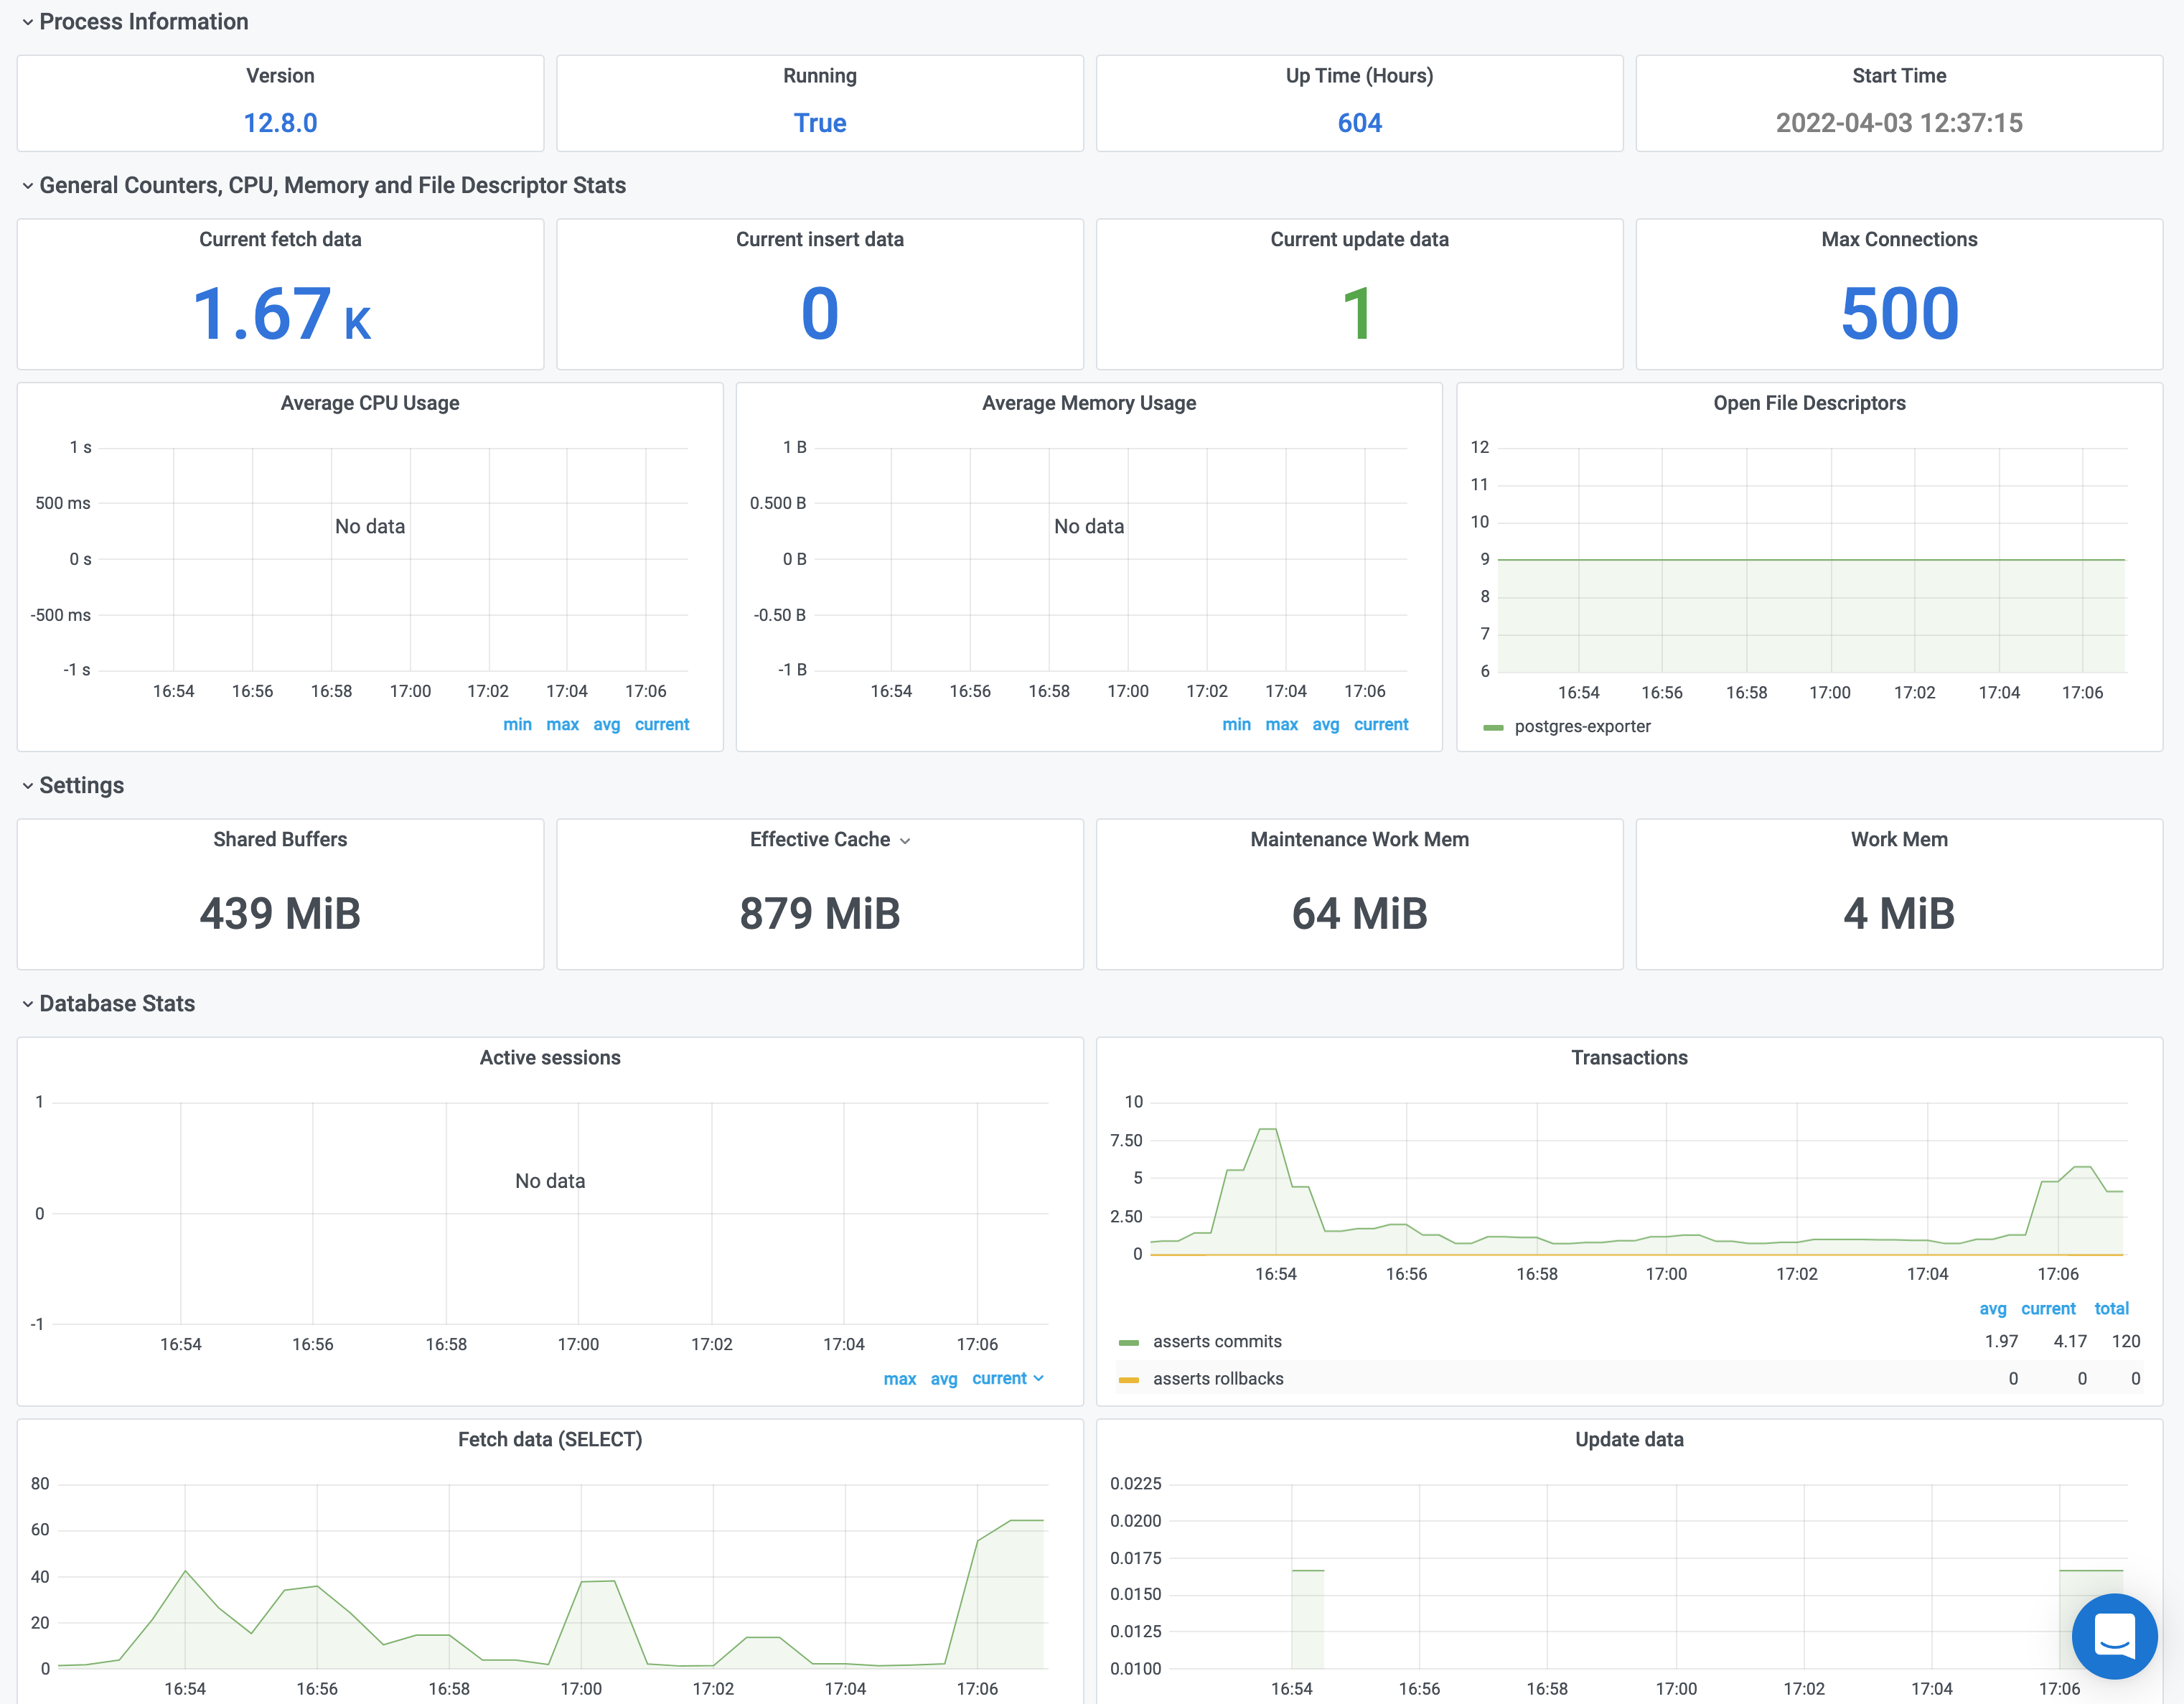
Dashboards

The following dashboard shows key metrics such as:

  • Uptime
  • Transactions
  • Active Session
  • Max Connection

You can configure a custom dashboard if you require detailed information for each PostgreSQL Prometheus metric.

Metrics dashboard