Windows Active Directory integration for Grafana Cloud
Microsoft Windows Active Directory (AD) is a directory service developed by Microsoft for Windows domain networks. It provides a variety of network services, including centralized domain management, user and resource management, and authentication and authorization. AD stores information about network objects (like users, groups, computers, and more) and makes this information easily accessible and secure for administrators and users, depending on their permissions.
This integration supports Microsoft Windows 2012+.
This integration includes 5 useful alerts and 2 pre-built dashboards to help monitor and visualize Windows Active Directory metrics and logs.
Before you begin
This integration relies on a Grafana Alloy instance running on a Windows machine.
Performance counters need to be turned on. This can be done by navigating to Server Manager then on the left sidebar, choose AD DS. Right clicking on the server will reveal an option to enable performance counters.
Install Windows Active Directory integration for Grafana Cloud
- In your Grafana Cloud stack, click Connections in the left-hand menu.
- Find Windows Active Directory and click its tile to open the integration.
- Review the prerequisites in the Configuration Details tab and set up Grafana Alloy to send Windows Active Directory metrics and logs to your Grafana Cloud instance.
- Click Install to add this integration’s pre-built dashboards and alerts to your Grafana Cloud instance, and you can start monitoring your Windows Active Directory setup.
Configuration snippets for Grafana Alloy
Simple mode
These snippets are configured to scrape a single Windows Active Directory instance running locally with default ports.
First, manually copy and append the following snippets into your alloy configuration file.
Integrations snippets
prometheus.exporter.windows "integrations_windows_exporter" {
	enabled_collectors = ["ad", "cpu", "cs", "logical_disk", "net", "os", "service", "system", "textfile", "time", "diskdrive"]

	dfsr {
		sources_enabled = [""]
	}

	exchange {
		enabled_list = [""]
	}

	mssql {
		enabled_classes = [""]
	}
}

discovery.relabel "integrations_windows_exporter" {
	targets = prometheus.exporter.windows.integrations_windows_exporter.targets

	rule {
		target_label = "job"
		replacement  = "integrations/windows_exporter"
	}

	rule {
		target_label = "instance"
		replacement  = constants.hostname
	}
}

prometheus.scrape "integrations_windows_exporter" {
	targets    = discovery.relabel.integrations_windows_exporter.output
	forward_to = [prometheus.relabel.integrations_windows_exporter.receiver]
	job_name   = "integrations/windows_exporter"
}

prometheus.relabel "integrations_windows_exporter" {
	forward_to = [prometheus.remote_write.metrics_service.receiver]

	rule {
		source_labels = ["volume"]
		regex         = "HarddiskVolume.*"
		action        = "drop"
	}
}
Logs snippets
windows
loki.process "logs_integrations_integrations_windows_exporter_application" {
	forward_to = [loki.write.grafana_cloud_loki.receiver]

	stage.json {
		expressions = {
			level  = "levelText",
			source = "source",
		}
	}

	stage.labels {
		values = {
			level  = null,
			source = null,
		}
	}
}

loki.relabel "logs_integrations_integrations_windows_exporter_application" {
	forward_to = [loki.process.logs_integrations_integrations_windows_exporter_application.receiver]

	rule {
		source_labels = ["computer"]
		target_label  = "agent_hostname"
	}
}

loki.source.windowsevent "logs_integrations_integrations_windows_exporter_application" {
	locale                 = 1033
	eventlog_name          = "Application"
	bookmark_path          = "./bookmarks-app.xml"
	poll_interval          = "0s"
	use_incoming_timestamp = true
	forward_to             = [loki.relabel.logs_integrations_integrations_windows_exporter_application.receiver]
	labels                 = {
		instance = constants.hostname,
		job      = "integrations/windows_exporter",
	}
}

loki.process "logs_integrations_integrations_windows_exporter_system" {
	forward_to = [loki.write.grafana_cloud_loki.receiver]

	stage.json {
		expressions = {
			level  = "levelText",
			source = "source",
		}
	}

	stage.labels {
		values = {
			level  = null,
			source = null,
		}
	}
}

loki.relabel "logs_integrations_integrations_windows_exporter_system" {
	forward_to = [loki.process.logs_integrations_integrations_windows_exporter_system.receiver]

	rule {
		source_labels = ["computer"]
		target_label  = "agent_hostname"
	}
}

loki.source.windowsevent "logs_integrations_integrations_windows_exporter_system" {
	locale                 = 1033
	eventlog_name          = "System"
	bookmark_path          = "./bookmarks-sys.xml"
	poll_interval          = "0s"
	use_incoming_timestamp = true
	forward_to             = [loki.relabel.logs_integrations_integrations_windows_exporter_system.receiver]
	labels                 = {
		instance = constants.hostname,
		job      = "integrations/windows_exporter",
	}
}
Advanced mode
The following snippets provide examples to guide you through the configuration process.
To instruct Grafana Alloy to scrape your Windows Active Directory instances, manually copy and append the snippets to your alloy configuration file, then follow subsequent instructions.
Advanced integrations snippets
prometheus.exporter.windows "integrations_windows_exporter" {
	enabled_collectors = ["ad", "cpu", "cs", "logical_disk", "net", "os", "service", "system", "textfile", "time", "diskdrive"]

	dfsr {
		sources_enabled = [""]
	}

	exchange {
		enabled_list = [""]
	}

	mssql {
		enabled_classes = [""]
	}
}

discovery.relabel "integrations_windows_exporter" {
	targets = prometheus.exporter.windows.integrations_windows_exporter.targets

	rule {
		target_label = "job"
		replacement  = "integrations/windows_exporter"
	}

	rule {
		target_label = "instance"
		replacement  = constants.hostname
	}
}

prometheus.scrape "integrations_windows_exporter" {
	targets    = discovery.relabel.integrations_windows_exporter.output
	forward_to = [prometheus.relabel.integrations_windows_exporter.receiver]
	job_name   = "integrations/windows_exporter"
}

prometheus.relabel "integrations_windows_exporter" {
	forward_to = [prometheus.remote_write.metrics_service.receiver]

	rule {
		source_labels = ["volume"]
		regex         = "HarddiskVolume.*"
		action        = "drop"
	}
}
This integrations uses the prometheus.exporter.windows component to generate metrics from a Windows Active Directory instance.
For the full array of configuration options, refer to the prometheus.exporter.windows component reference documentation.
This exporter must be linked with a discovery.relabel component to apply the necessary relabelings.
For each Windows Active Directory instance to be monitored you must create a pair of these components.
Configure the following properties within each discovery.relabel component:
instancelabel:constants.hostnamesets theinstancelabel to your Grafana Alloy server hostname. If that is not suitable, change it to a value uniquely identifies this Windows Active Directory instance. Make sure this label value is the same for all telemetry data collected for this instance.
You can then scrape them by including each discovery.relabel under targets within the prometheus.scrape component.
Advanced logs snippets
windows
loki.process "logs_integrations_integrations_windows_exporter_application" {
	forward_to = [loki.write.grafana_cloud_loki.receiver]

	stage.json {
		expressions = {
			level  = "levelText",
			source = "source",
		}
	}

	stage.labels {
		values = {
			level  = null,
			source = null,
		}
	}
}

loki.relabel "logs_integrations_integrations_windows_exporter_application" {
	forward_to = [loki.process.logs_integrations_integrations_windows_exporter_application.receiver]

	rule {
		source_labels = ["computer"]
		target_label  = "agent_hostname"
	}
}

loki.source.windowsevent "logs_integrations_integrations_windows_exporter_application" {
	locale                 = 1033
	eventlog_name          = "Application"
	bookmark_path          = "./bookmarks-app.xml"
	poll_interval          = "0s"
	use_incoming_timestamp = true
	forward_to             = [loki.relabel.logs_integrations_integrations_windows_exporter_application.receiver]
	labels                 = {
		instance = constants.hostname,
		job      = "integrations/windows_exporter",
	}
}

loki.process "logs_integrations_integrations_windows_exporter_system" {
	forward_to = [loki.write.grafana_cloud_loki.receiver]

	stage.json {
		expressions = {
			level  = "levelText",
			source = "source",
		}
	}

	stage.labels {
		values = {
			level  = null,
			source = null,
		}
	}
}

loki.relabel "logs_integrations_integrations_windows_exporter_system" {
	forward_to = [loki.process.logs_integrations_integrations_windows_exporter_system.receiver]

	rule {
		source_labels = ["computer"]
		target_label  = "agent_hostname"
	}
}

loki.source.windowsevent "logs_integrations_integrations_windows_exporter_system" {
	locale                 = 1033
	eventlog_name          = "System"
	bookmark_path          = "./bookmarks-sys.xml"
	poll_interval          = "0s"
	use_incoming_timestamp = true
	forward_to             = [loki.relabel.logs_integrations_integrations_windows_exporter_system.receiver]
	labels                 = {
		instance = constants.hostname,
		job      = "integrations/windows_exporter",
	}
}
To monitor your Windows Active Directory instance logs, you will use a combination of the following components:
- loki.source.windowsevent defines where to find the Windows Event Logs to be scraped.
- loki.process defines how to process logs before sending it to Loki.
- loki.relabel defines any relabeling needed before sending logs to Loki.
Dashboards
The Windows Active Directory integration installs the following dashboards in your Grafana Cloud instance to help monitor your system.
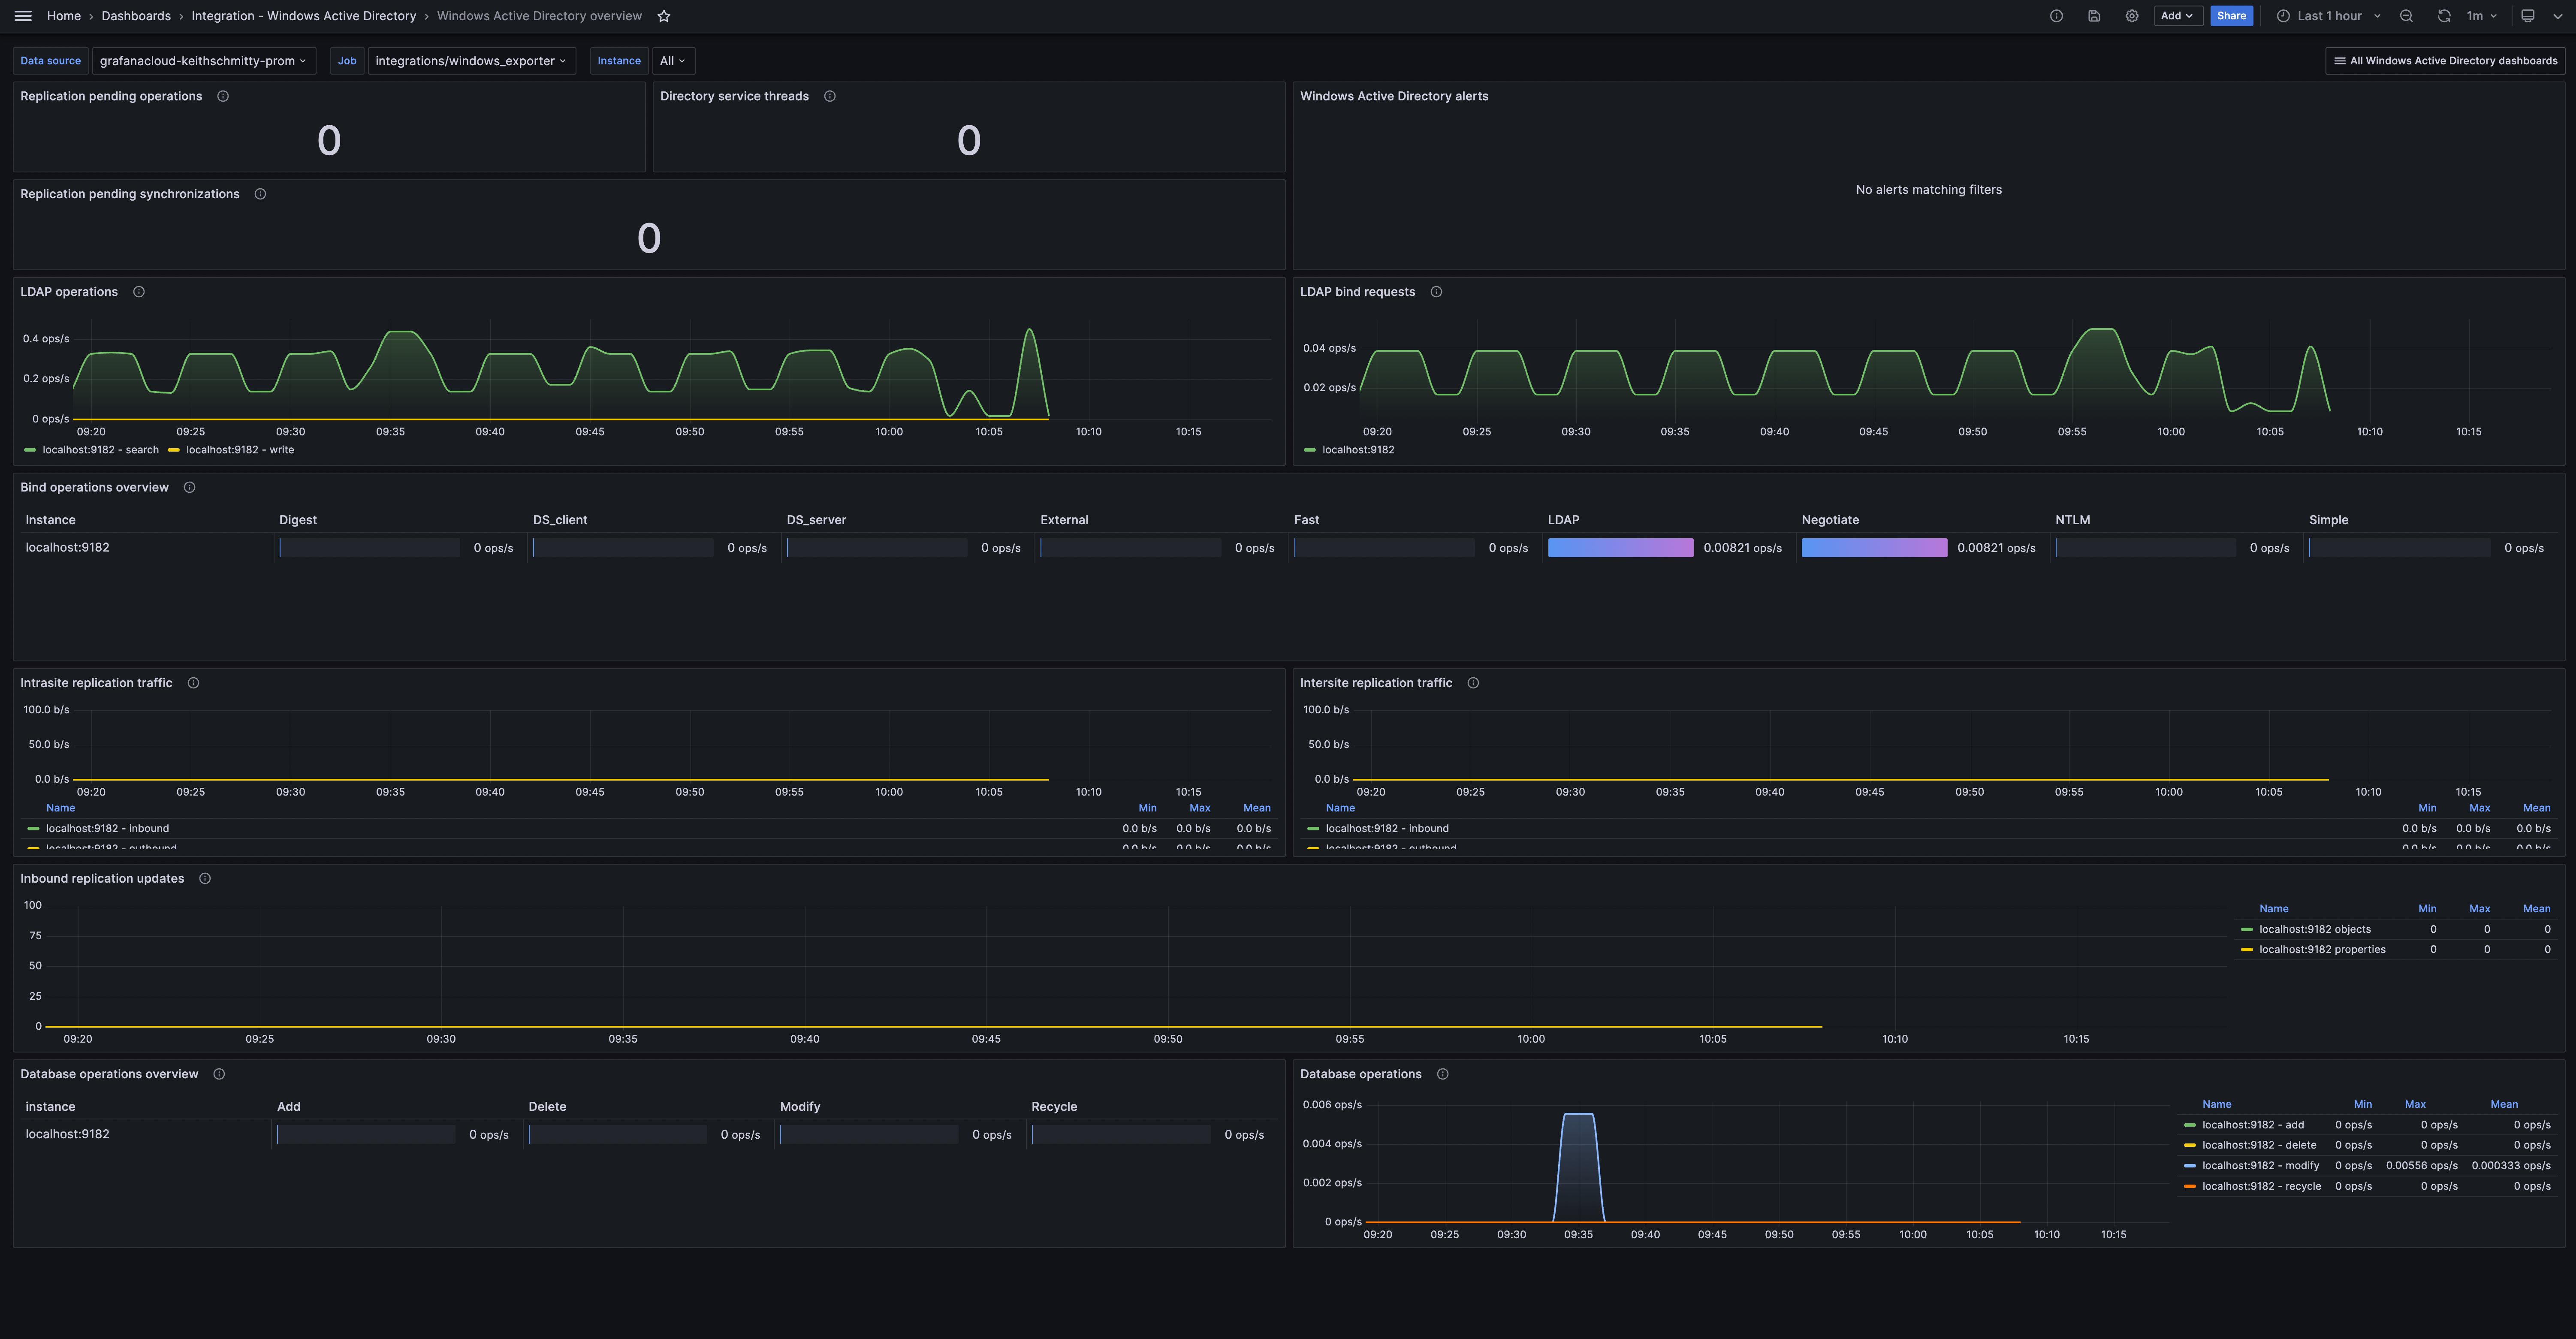
- Windows Active Directory overview
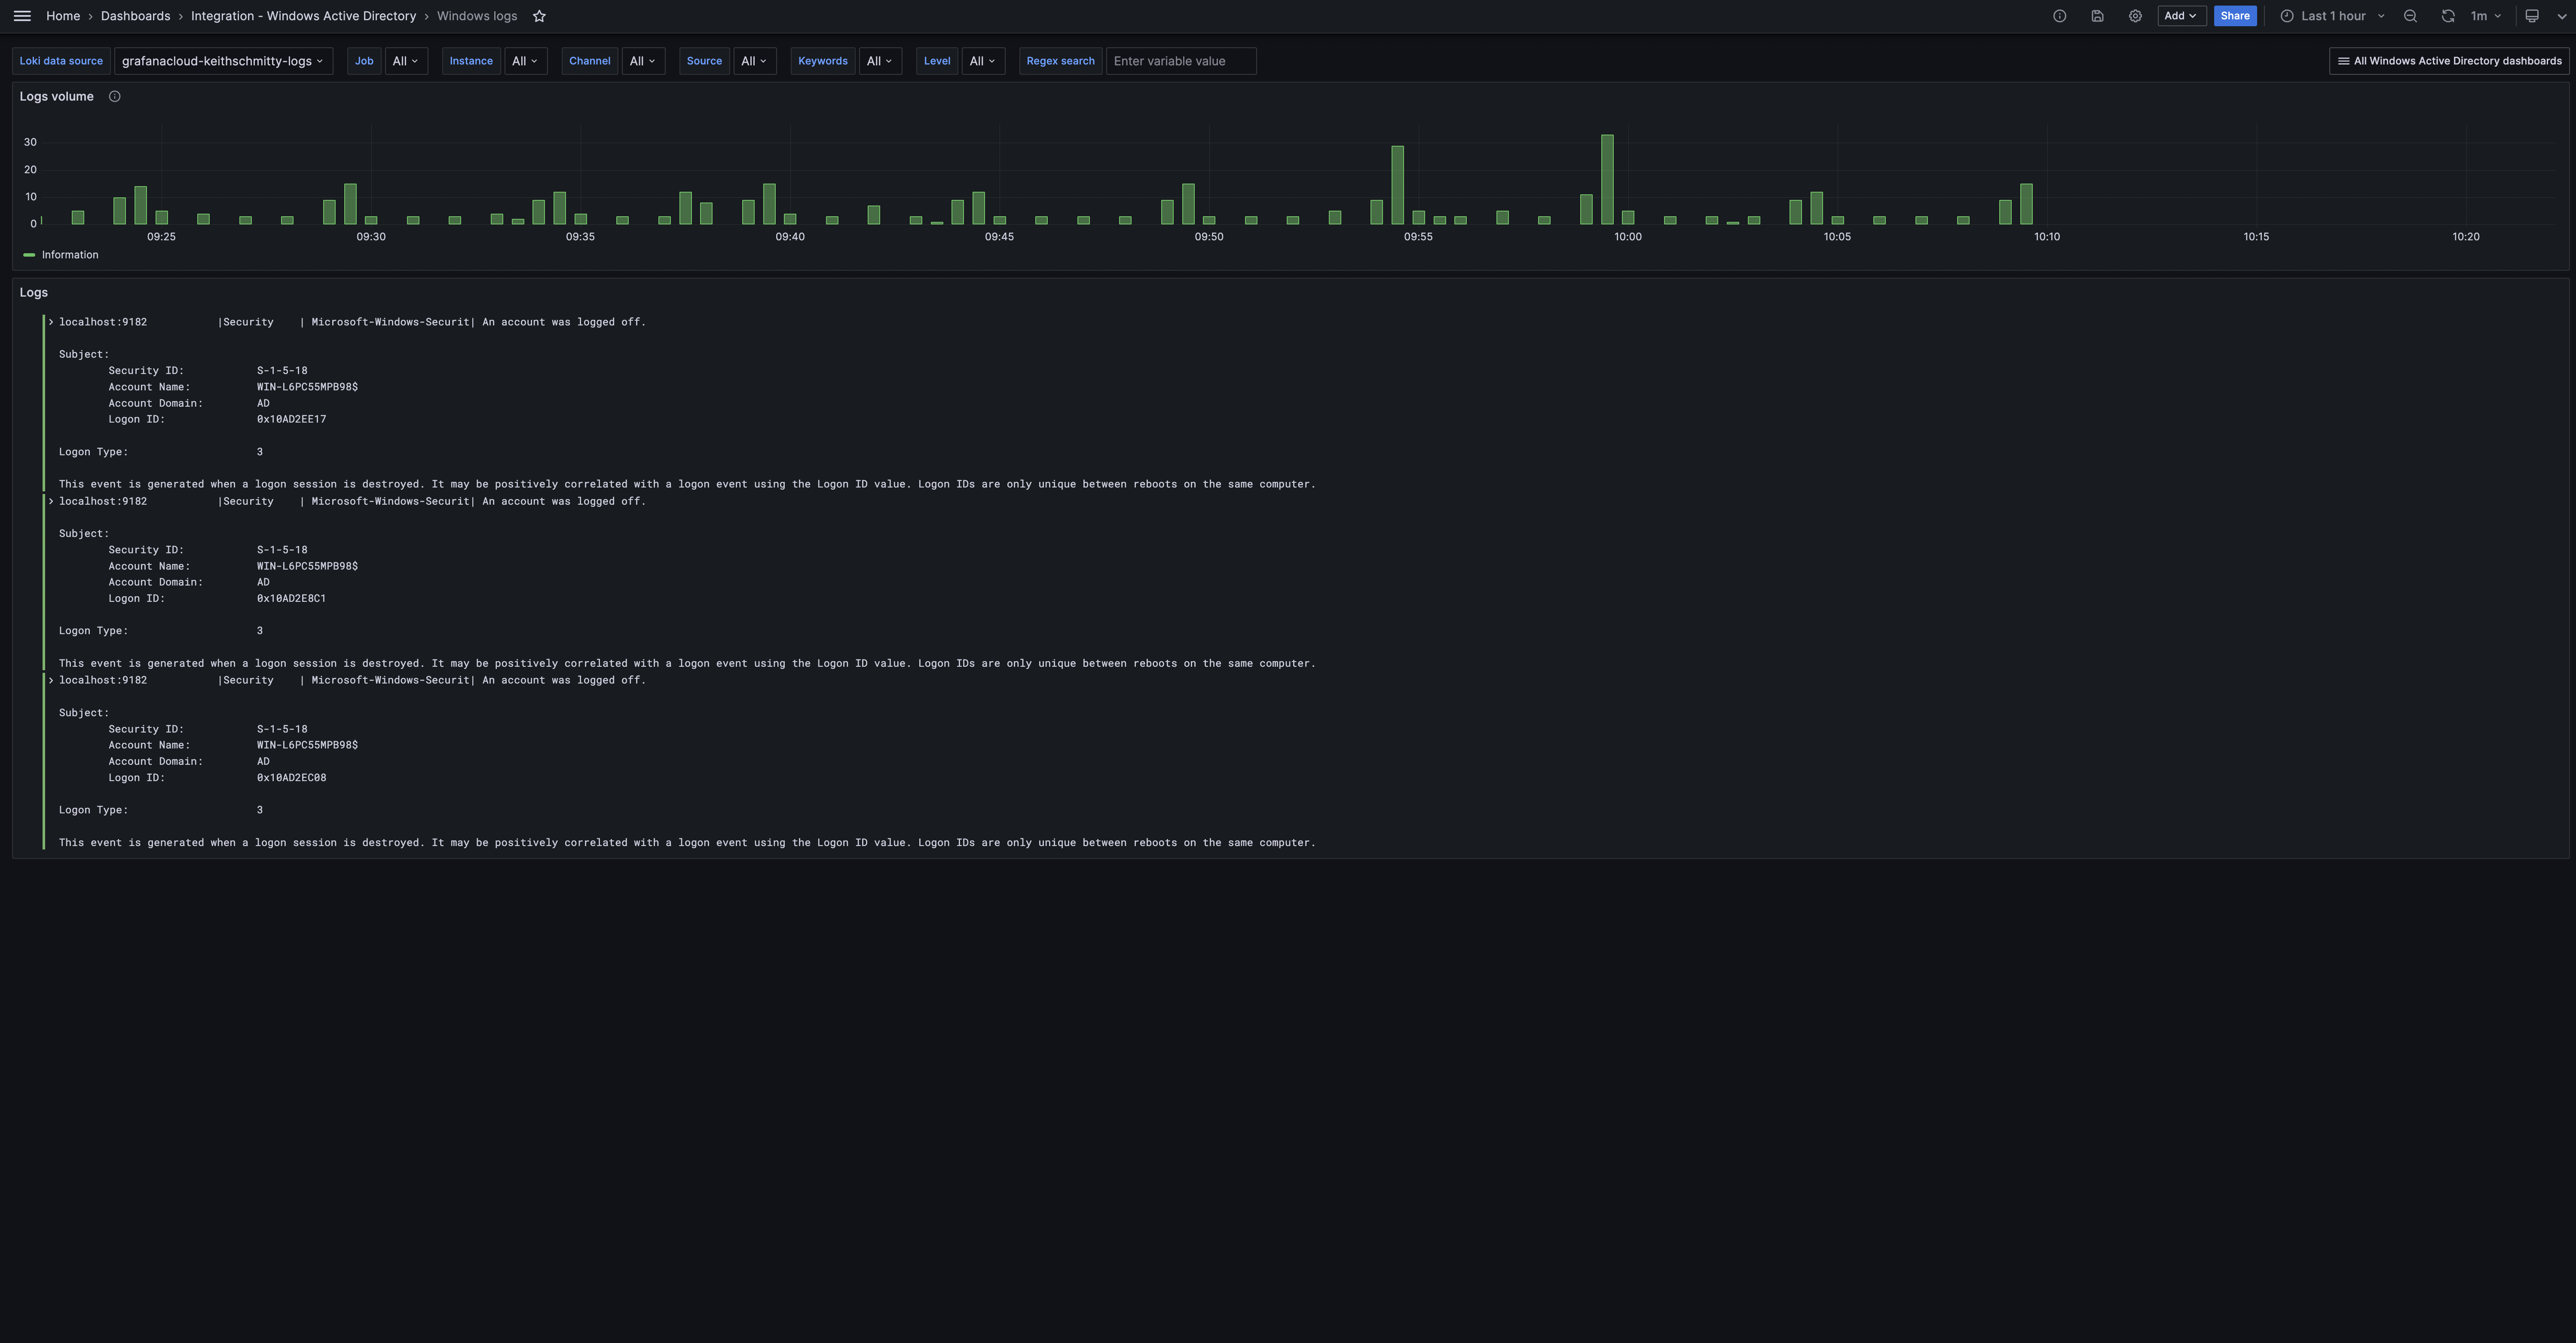
- Windows logs
Windows Active Directory overview
Windows Active Directory logs
Alerts
The Windows Active Directory integration includes the following useful alerts:
Metrics
The most important metrics provided by the Windows Active Directory integration, which are used on the pre-built dashboards and Prometheus alerts, are as follows:
- up
- windows_ad_binds_total
- windows_ad_database_operations_total
- windows_ad_directory_operations_total
- windows_ad_directory_service_threads
- windows_ad_replication_data_intersite_bytes_total
- windows_ad_replication_data_intrasite_bytes_total
- windows_ad_replication_inbound_objects_updated_total
- windows_ad_replication_inbound_properties_updated_total
- windows_ad_replication_pending_operations
- windows_ad_replication_pending_synchronizations
- windows_ad_replication_sync_requests_schema_mismatch_failure_total
- windows_ad_sam_password_changes_total
- windows_cs_hostname
- windows_system_system_up_time
Changelog
# 1.0.2 - April 2025

- Fix status panel check queries
- Update to the latest windows mixin
  * Add WindowsNodeHasRebooted alert

# 1.0.1 - November 2024

- Update status panel check queries

# 1.0.0 - January 2024

- Initial release
Cost
By connecting your Windows Active Directory instance to Grafana Cloud, you might incur charges. To view information on the number of active series that your Grafana Cloud account uses for metrics included in each Cloud tier, see Active series and dpm usage and Cloud tier pricing.


