Menu
Documentation Grafana Cloud
Knowledge graph
Advanced configuration
Enable metrics collection
Run times
GoLang
Grafana Cloud
Knowledge graph
Advanced configuration
Enable metrics collection
Run times
GoLang
Grafana Cloud
Configure golang to generate Prometheus metrics
For instructions on how to instrument a Go application with Prometheus exporter, refer to Instrumenting a Go application for Prometheus.
Metrics and KPIs
Dashboard
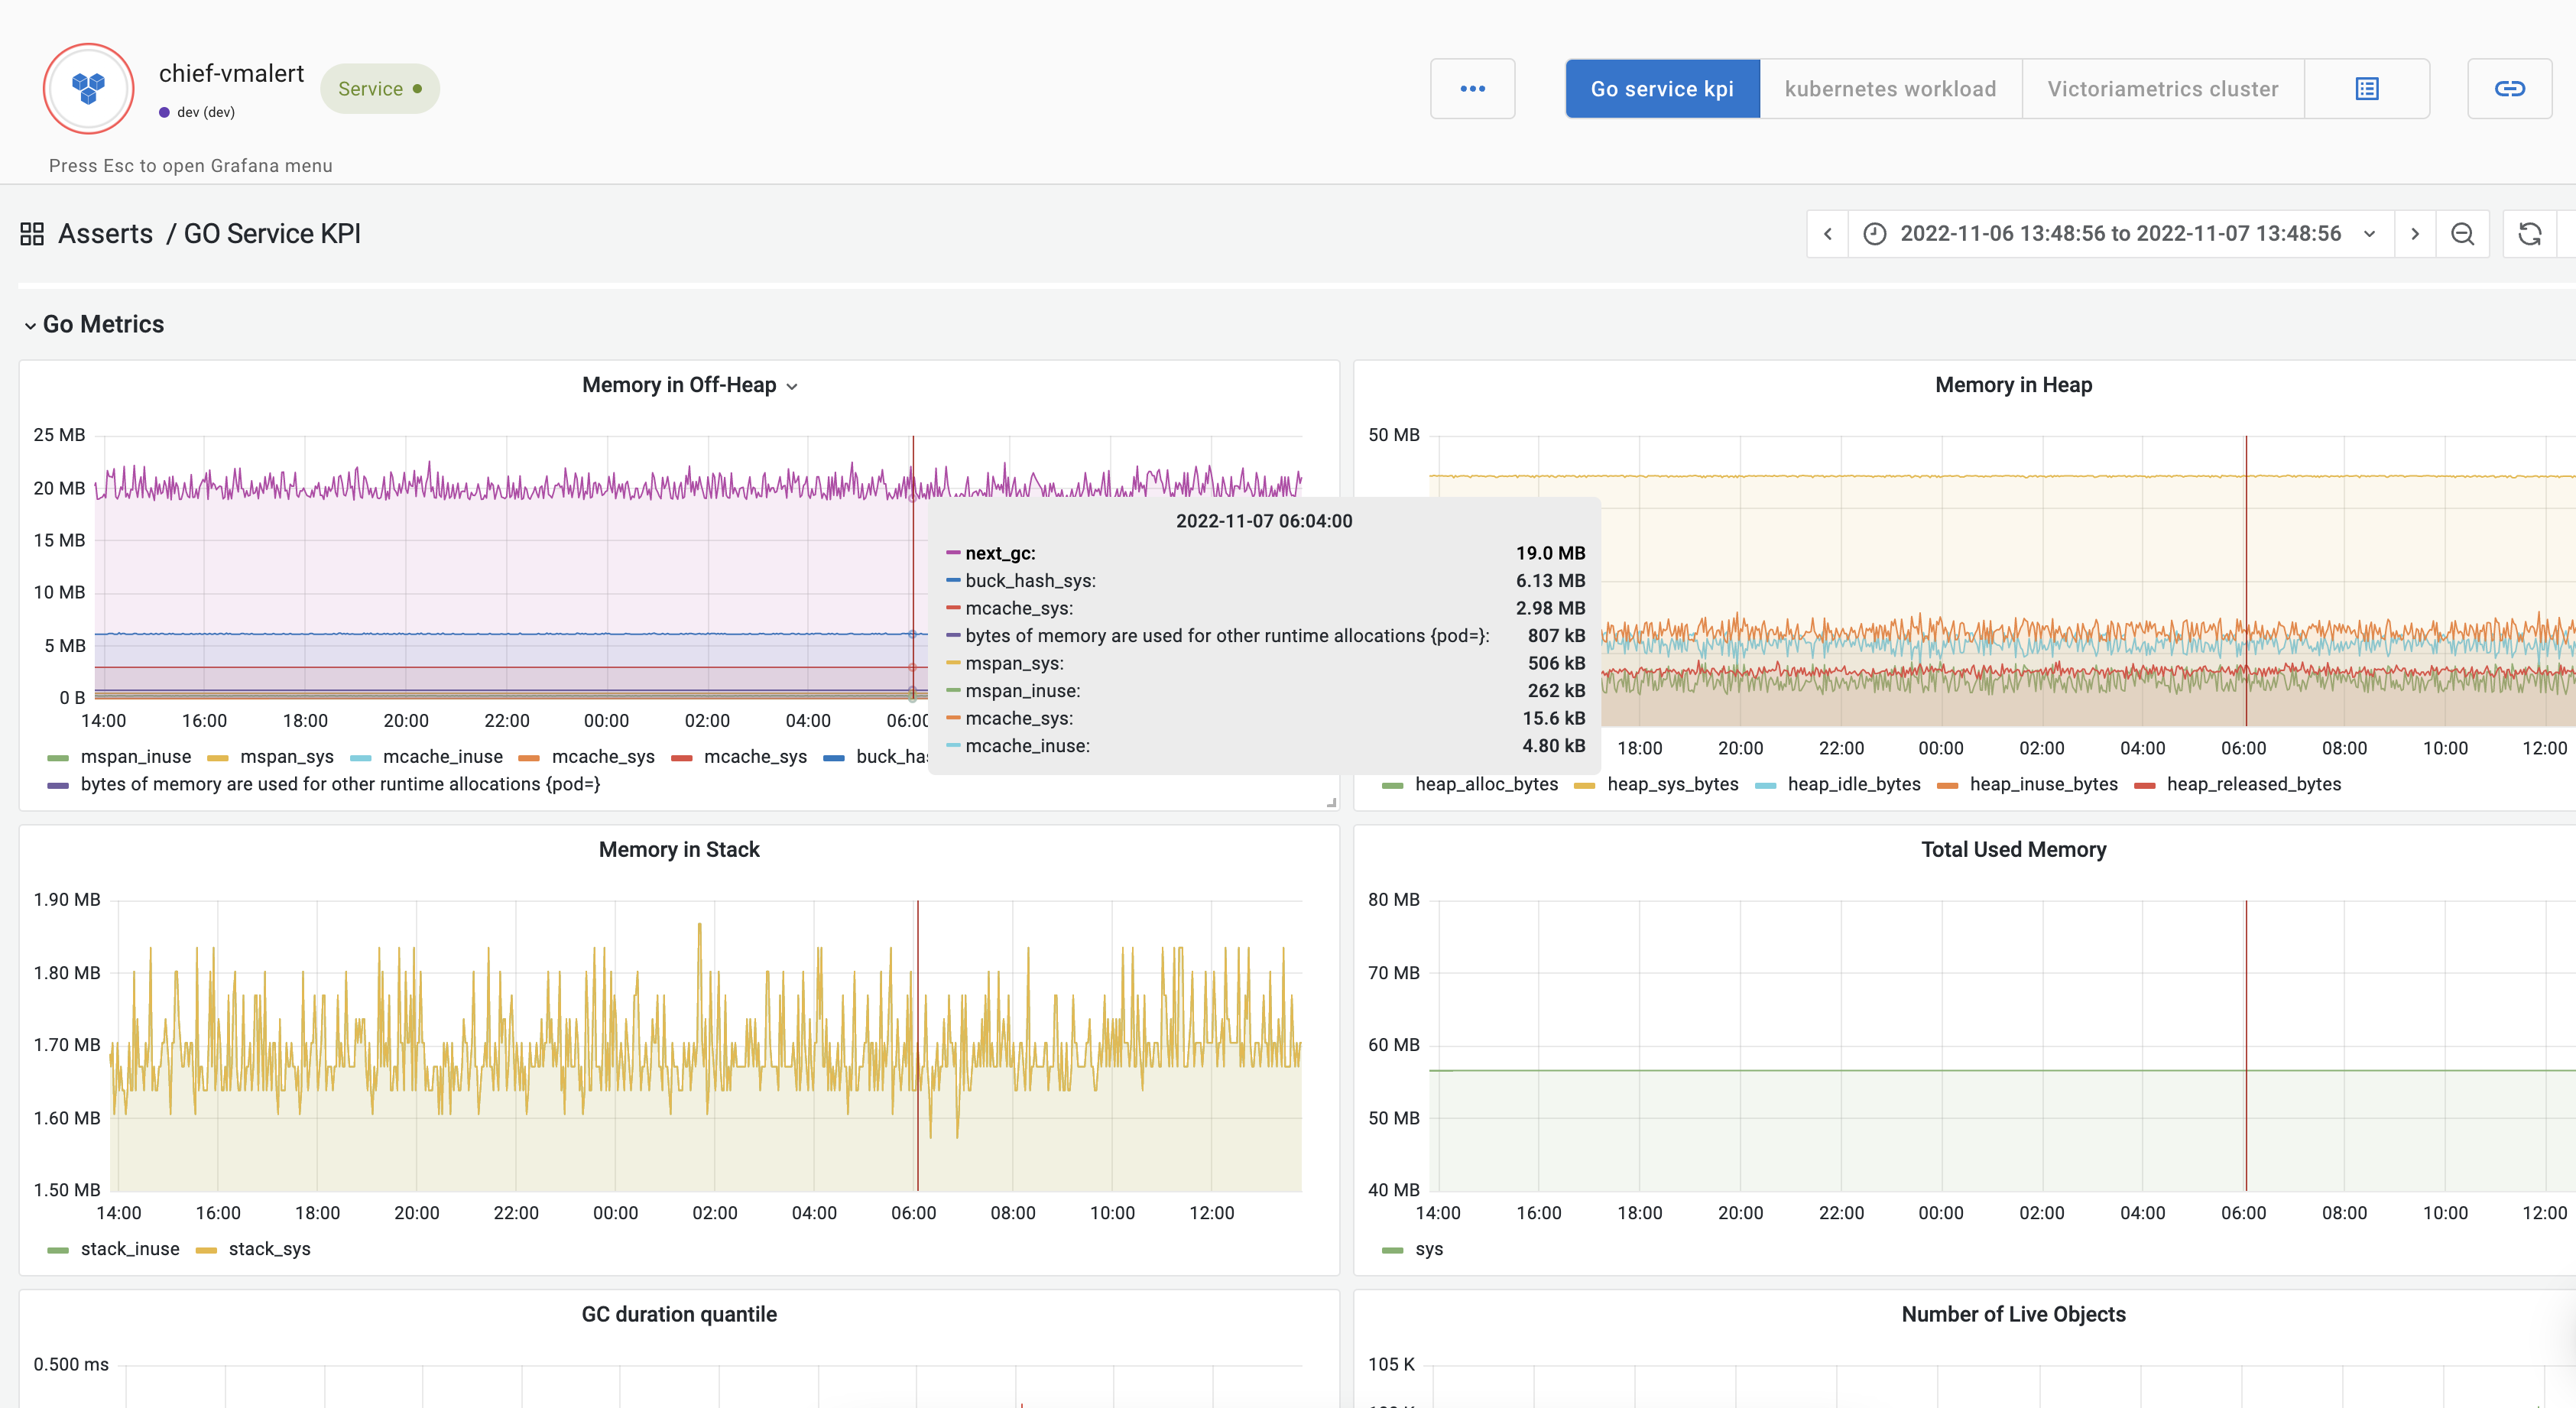
The following Go KPI dashboard shows KPIs listed in the table, and the following Go runtime metrics.
Memory metrics
- Heap Memory
go_memstats_heap_alloc_bytes - Off-Heap Memory
go_memstats_mspan_inuse_bytes - Stack Memory
go_memstats_stack_inuse_bytes - Total Memory
go_memstats_sys_bytes
Objects, allocation, and GC metrics
- Live Object Count
go_memstats_mallocs_total-go_memstats_frees_total - Object Allocation Rate
rate(go_memstats_mallocs_total) - Memory Allocation Rate
rate(go_memstats_alloc_bytes_total) - GC Duration Quantiles
go_gc_duration_seconds
Go routines and pointers metrics
- Number of routines
go_goroutines - Number of pointer dereferences
rate(go_memstats_lookups_total)