Service profiles
The service Profiles tab integrates Pyroscope’s continuous profiling dashboards for symbol analysis and flame graphs into Application Observability.

Filtering by profile type
You can filter the profiles dashboards by various profile types:
- cpu:
- cpu: the CPU time spent executing a function
- samples: the number of times Application Observability samplted the function
- memory:
- alloc_objects: the number objects allocated but not yet released
- alloc_space: the amount of memory allocated but not yet released
- inuse_objects: the number of objects allocated and in use
- inuse_space: the amount of memory allocated and in use
- block:
- block-contentions: the number of times goroutines were off-CPU waiting for a resource
- delay: the amount of CPU time goroutines were off-CPU waiting for a resource
- mutex:
- contentions: the number of times goroutines were off-CPU waiting for a lock
- goroutine: the number of running goroutines, includes goroutines blocked and waiting
Refer to the Understand profiling types and their uses in Pyroscope documentation to learn more about filtering data with profiles.
Symbol table
The symbol table highlights symbols and their usage. Click a symbol name or the search icon to highlight it in the full flame graph.
Click the sandwich-view icon to divide the flame graph into callers and the callees. The callers are all the functions called in order for the selected function call to happen. The callees are all the functions called as a result of the selected function call.
Flame graph
There are two modes the flame graph can be in. By default, the flame graph is in the collapsed mode which combines similar frames together to form one frame which reduces the depth of the flame graph by not showing a tall stack of similarly wide frames.
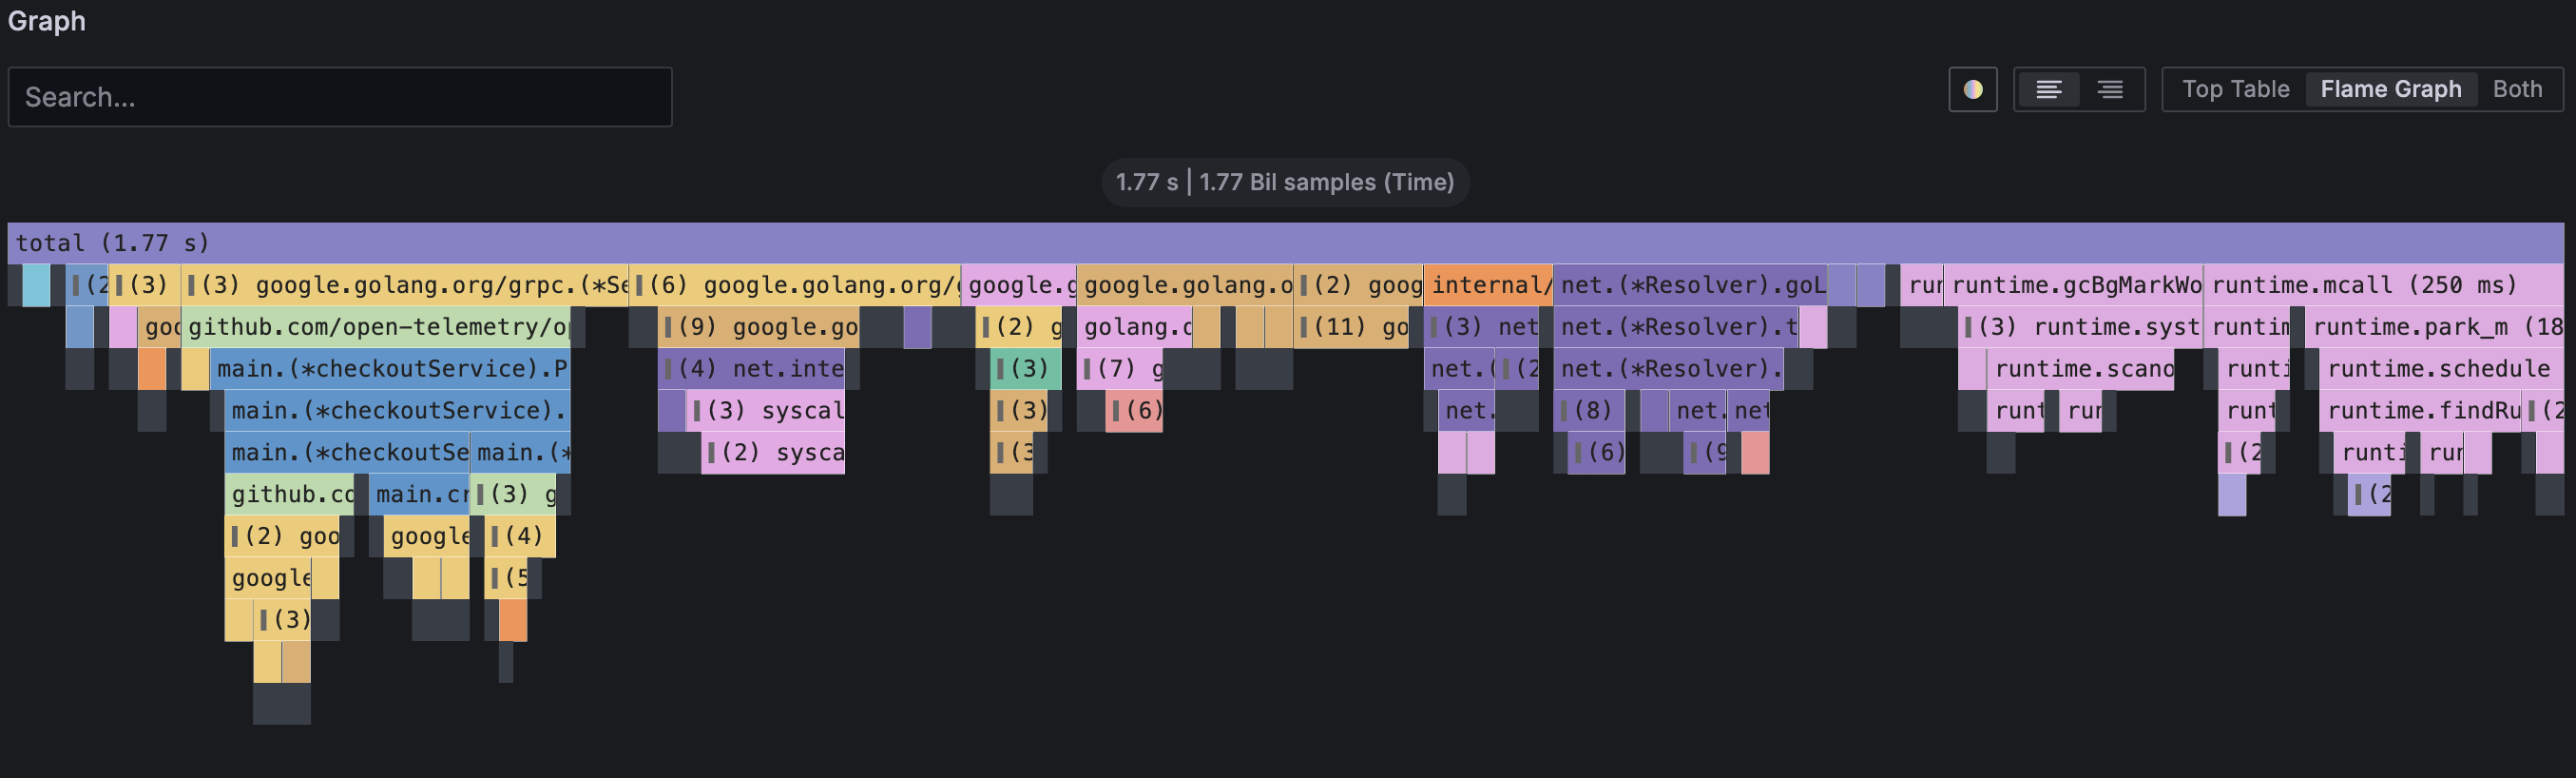
The second uncollapsed mode does not combine similar frames together. This mode can be viewed in collapsed mode, click the root frame labeled total and Expand all group from the context menu.
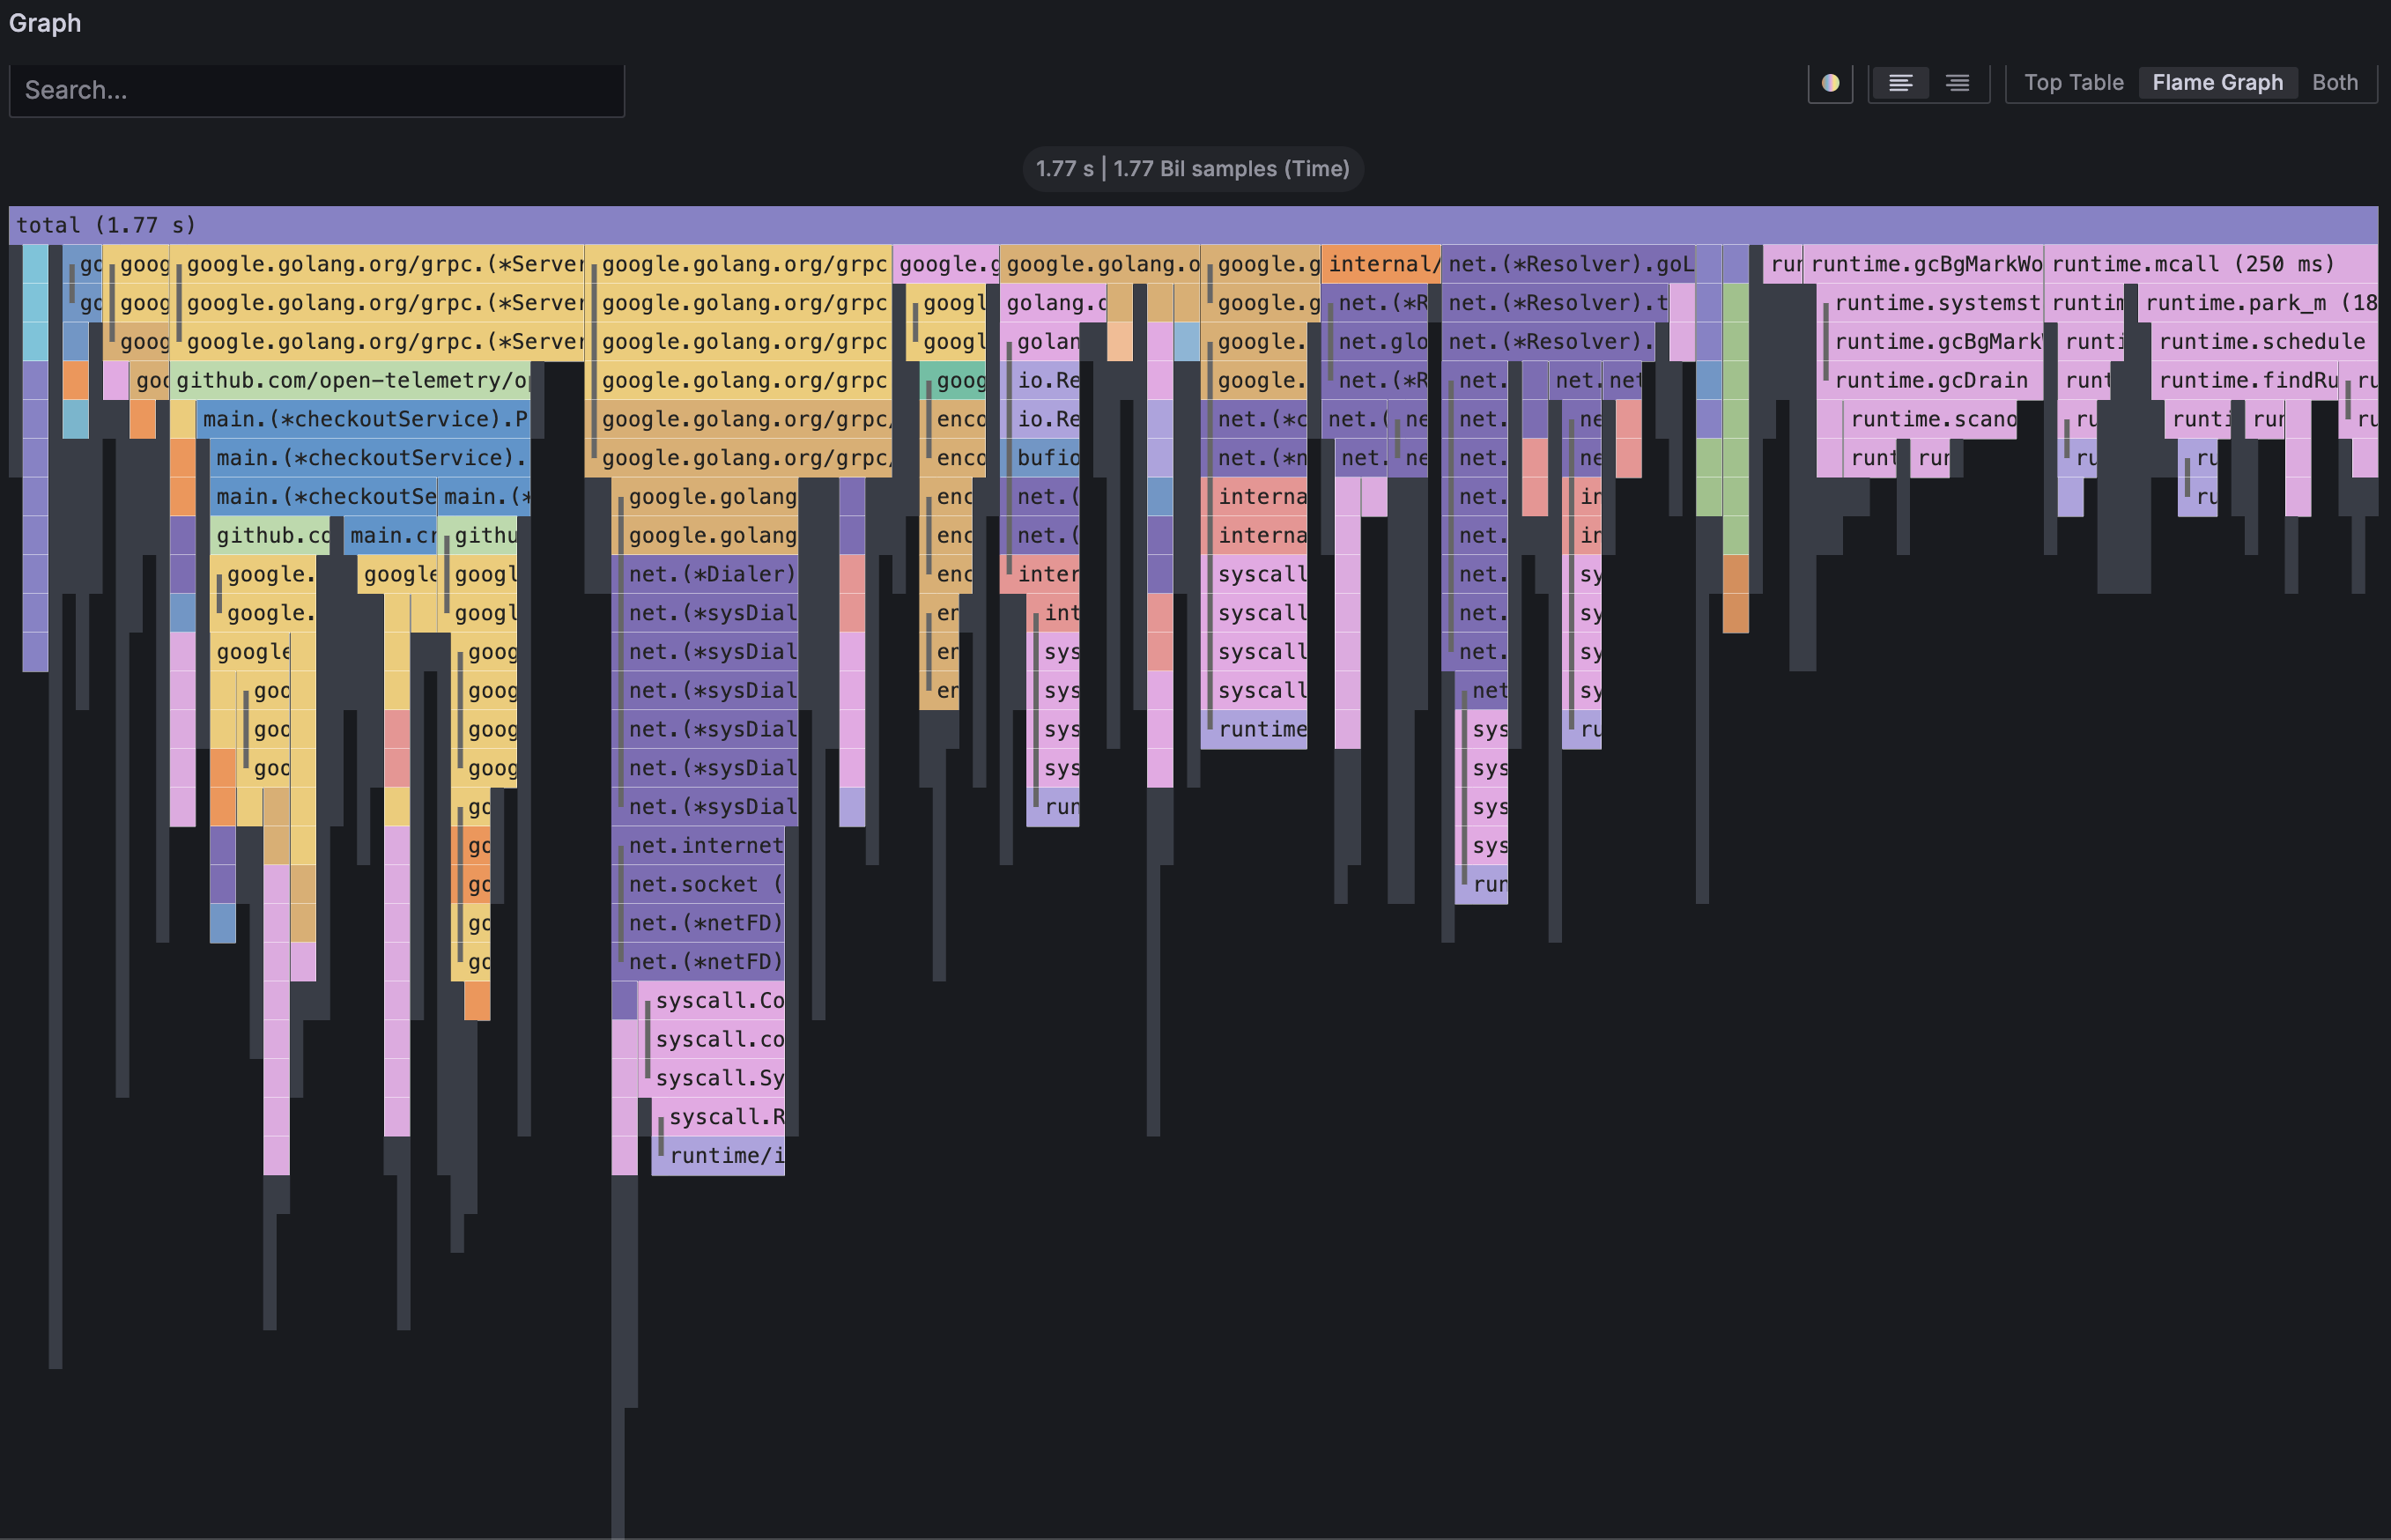
Refer to the Flame graphs: Visualizing performance data documentation to learn more about visualizing data with flame graphs.
Use cases
The profiles dashboards automatically filters the flame graph by service_name and namespace which provides the most value with the least amount data parsed.
You can filter the flame graph further on custom labels. For example, filter the flame graph on a custom applied label for multi-region deployment:
{service_name="my_service", namespace="my_namespace", region="us-central"}Refer to the Profiling fundamentals and When to use continuous profiling documentation for further high-level use cases.


