Raspberry Pi integration for Grafana Cloud
The Raspberry Pi integration uses Grafana Alloy to collect metrics related to the operating system (Linux-based), including aspects like CPU usage, load average, memory usage, and disk and networking I/O. It also supports system logs being scraped by Alloy using promtail. An accompanying dashboard is provided to visualize these metrics and logs.
The Raspberry Pi integration uses node-observ-lib.
This integration includes 15 useful alerts and 2 pre-built dashboards to help monitor and visualize Raspberry Pi metrics and logs.
Before you begin
Each Raspberry Pi node being observed must have its dedicated Grafana Alloy running.
Install Raspberry Pi integration for Grafana Cloud
- In your Grafana Cloud stack, click Connections in the left-hand menu.
- Find Raspberry Pi and click its tile to open the integration.
- Review the prerequisites in the Configuration Details tab and set up Grafana Alloy to send Raspberry Pi metrics and logs to your Grafana Cloud instance.
- Click Install to add this integration’s pre-built dashboards and alerts to your Grafana Cloud instance, and you can start monitoring your Raspberry Pi setup.
Configuration snippets for Grafana Alloy
Simple mode
These snippets are configured to scrape a single Raspberry Pi instance running locally with default ports.
First, manually copy and append the following snippets into your alloy configuration file.
Integrations snippets
prometheus.exporter.unix "integrations_node_exporter" { }

discovery.relabel "integrations_node_exporter" {
	targets = prometheus.exporter.unix.integrations_node_exporter.targets

	rule {
		target_label = "instance"
		replacement  = constants.hostname
	}

	rule {
		target_label = "job"
		replacement  = "integrations/raspberrypi-node"
	}
}

prometheus.scrape "integrations_node_exporter" {
	targets    = discovery.relabel.integrations_node_exporter.output
	forward_to = [prometheus.remote_write.metrics_service.receiver]
	job_name   = "integrations/node_exporter"
}
Logs snippets
linux
discovery.relabel "logs_integrations_integrations_node_exporter_journal_scrape" {
	targets = []

	rule {
		source_labels = ["__journal__systemd_unit"]
		target_label  = "unit"
	}

	rule {
		source_labels = ["__journal__boot_id"]
		target_label  = "boot_id"
	}

	rule {
		source_labels = ["__journal__transport"]
		target_label  = "transport"
	}

	rule {
		source_labels = ["__journal_priority_keyword"]
		target_label  = "level"
	}
}

loki.source.journal "logs_integrations_integrations_node_exporter_journal_scrape" {
	max_age       = "24h0m0s"
	relabel_rules = discovery.relabel.logs_integrations_integrations_node_exporter_journal_scrape.rules
	forward_to    = [loki.write.grafana_cloud_loki.receiver]
	labels        = {
		instance = constants.hostname,
		job      = "integrations/raspberrypi-node",
	}
}

local.file_match "logs_integrations_integrations_node_exporter_direct_scrape" {
	path_targets = [{
		__address__ = "localhost",
		__path__    = "/var/log/{syslog,messages,*.log}",
		instance    = constants.hostname,
		job         = "integrations/raspberrypi-node",
	}]
}

loki.source.file "logs_integrations_integrations_node_exporter_direct_scrape" {
	targets    = local.file_match.logs_integrations_integrations_node_exporter_direct_scrape.targets
	forward_to = [loki.write.grafana_cloud_loki.receiver]
}
Advanced mode
The following snippets provide examples to guide you through the configuration process.
To instruct Grafana Alloy to scrape your Raspberry Pi instances, manually copy and append the snippets to your alloy configuration file, then follow subsequent instructions.
Advanced integrations snippets
prometheus.exporter.unix "integrations_node_exporter" { }

discovery.relabel "integrations_node_exporter" {
	targets = prometheus.exporter.unix.integrations_node_exporter.targets

	rule {
		target_label = "instance"
		replacement  = constants.hostname
	}

	rule {
		target_label = "job"
		replacement  = "integrations/raspberrypi-node"
	}
}

prometheus.scrape "integrations_node_exporter" {
	targets    = discovery.relabel.integrations_node_exporter.output
	forward_to = [prometheus.remote_write.metrics_service.receiver]
	job_name   = "integrations/node_exporter"
}
This integrations uses the prometheus.exporter.unix component to generate metrics from a Raspberry Pi instance.
For the full array of configuration options, refer to the prometheus.exporter.unix component reference documentation.
This exporter must be linked with a discovery.relabel component to apply the necessary relabelings.
For each Raspberry Pi instance to be monitored you must create a pair of these components.
Configure the following properties within each discovery.relabel component:
instancelabel:constants.hostnamesets theinstancelabel to your Grafana Alloy server hostname. If that is not suitable, change it to a value uniquely identifies this Raspberry Pi instance. Make sure this label value is the same for all telemetry data collected for this instance.
You can then scrape them by including each discovery.relabel under targets within the prometheus.scrape component.
Advanced logs snippets
linux
discovery.relabel "logs_integrations_integrations_node_exporter_journal_scrape" {
	targets = []

	rule {
		source_labels = ["__journal__systemd_unit"]
		target_label  = "unit"
	}

	rule {
		source_labels = ["__journal__boot_id"]
		target_label  = "boot_id"
	}

	rule {
		source_labels = ["__journal__transport"]
		target_label  = "transport"
	}

	rule {
		source_labels = ["__journal_priority_keyword"]
		target_label  = "level"
	}
}

loki.source.journal "logs_integrations_integrations_node_exporter_journal_scrape" {
	max_age       = "24h0m0s"
	relabel_rules = discovery.relabel.logs_integrations_integrations_node_exporter_journal_scrape.rules
	forward_to    = [loki.write.grafana_cloud_loki.receiver]
	labels        = {
		instance = constants.hostname,
		job      = "integrations/raspberrypi-node",
	}
}

local.file_match "logs_integrations_integrations_node_exporter_direct_scrape" {
	path_targets = [{
		__address__ = "localhost",
		__path__    = "/var/log/{syslog,messages,*.log}",
		instance    = constants.hostname,
		job         = "integrations/raspberrypi-node",
	}]
}

loki.source.file "logs_integrations_integrations_node_exporter_direct_scrape" {
	targets    = local.file_match.logs_integrations_integrations_node_exporter_direct_scrape.targets
	forward_to = [loki.write.grafana_cloud_loki.receiver]
}
To monitor your Raspberry Pi instance logs, you will use a combination of the following components:
local.file_match defines where to find the log file to be scraped. Change the following properties according to your environment:
__address__: The Raspberry Pi instance address__path__: The path to the log file.instancelabel:constants.hostnamesets theinstancelabel to your Grafana Alloy server hostname. If that is not suitable, change it to a value uniquely identifies this Raspberry Pi instance. Make sure this label value is the same for all telemetry data collected for this instance.
loki.source.journal Reads logs from the systemd journal. Change the following properties according to your environment:
max_age: The oldest relative time from process start that will be read.
discovery.relabel defines any relabeling needed before sending logs to Loki.
loki.source.file sends logs to Loki.
Dashboards
The Raspberry Pi integration installs the following dashboards in your Grafana Cloud instance to help monitor your system.
- Raspberry Pi / logs
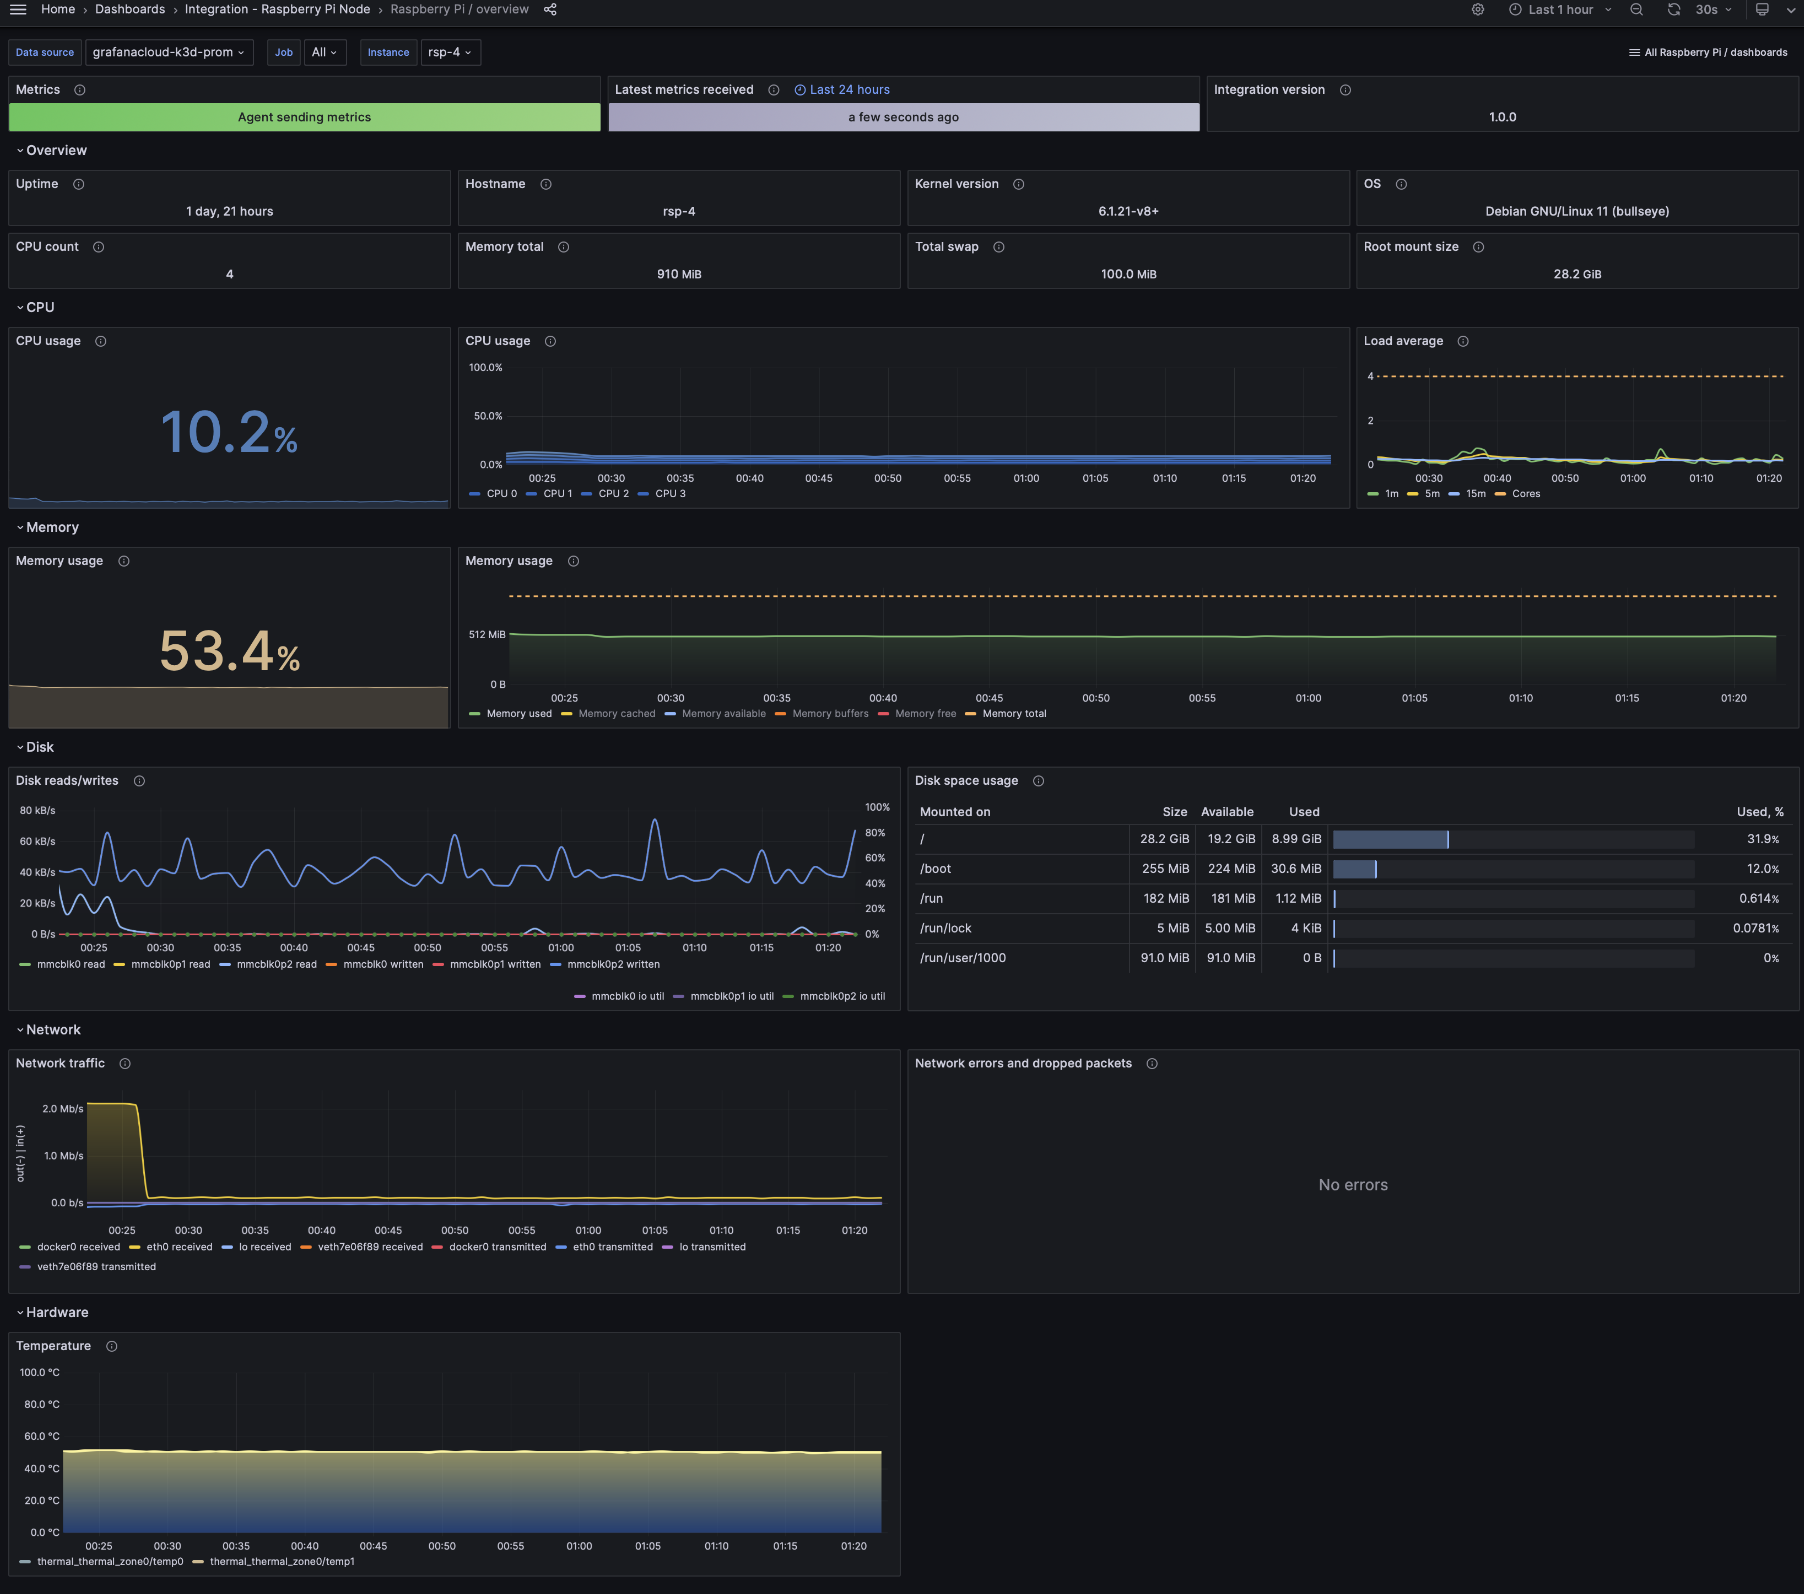
- Raspberry Pi / overview
Raspberry Pi overview
Raspberry Pi logs

Alerts
The Raspberry Pi integration includes the following useful alerts:
raspberrypi-node-filesystem-alerts
raspberrypi-node-alerts
Metrics
The most important metrics provided by the Raspberry Pi integration, which are used on the pre-built dashboards and Prometheus alerts, are as follows:
- instance:node_num_cpu:sum
- node_boot_time_seconds
- node_cpu_seconds_total
- node_disk_io_time_seconds_total
- node_disk_io_time_weighted_seconds_total
- node_disk_read_bytes_total
- node_disk_written_bytes_total
- node_filesystem_avail_bytes
- node_filesystem_files
- node_filesystem_files_free
- node_filesystem_readonly
- node_filesystem_size_bytes
- node_hwmon_temp_celsius
- node_load1
- node_load15
- node_load5
- node_memory_Buffers_bytes
- node_memory_Cached_bytes
- node_memory_MemAvailable_bytes
- node_memory_MemFree_bytes
- node_memory_MemTotal_bytes
- node_memory_Slab_bytes
- node_memory_SwapTotal_bytes
- node_network_receive_bytes_total
- node_network_receive_drop_total
- node_network_receive_errs_total
- node_network_receive_packets_total
- node_network_transmit_bytes_total
- node_network_transmit_drop_total
- node_network_transmit_errs_total
- node_network_transmit_packets_total
- node_os_info
- node_systemd_unit_state
- node_uname_info
- node_vmstat_pgmajfault
- up
Changelog
# 1.0.1 - November 2024

- Update status panel check queries

# 1.0.0 - December 2023

* Use latest linux observabiltiy library
* Add separate logs dashboard
* Add inventory panels row
* Add grafana annotations for events like reboot, OOMkill and others
* Add metrics and logs status panels
* Rename dashboards' prefix to 'Raspberry Pi /'
* Add new alerts: NodeCPUHighUsage, NodeSystemSaturation, NodeMemoryMajorPagesFaults, NodeDiskIOSaturation, NodeSystemdServiceFailed, NodeHardwareTemperatureHigh.

# 0.0.4 - September 2023

* Update Grafana Agent configuration snippets to include filtered metrics used in gauge panels

# 0.0.3 - August 2023

* Add regex filter for logs datasource

# 0.0.2 - July 2023

* New Filter Metrics option for configuring the Grafana Agent, which saves on metrics cost by dropping any metric not used by this integration. Beware that anything custom built using metrics that are not on the snippet will stop working.

# 0.0.1 - September 2022

* Initial release
Cost
By connecting your Raspberry Pi instance to Grafana Cloud, you might incur charges. To view information on the number of active series that your Grafana Cloud account uses for metrics included in each Cloud tier, see Active series and dpm usage and Cloud tier pricing.


