AI Observability integration for Grafana Cloud
AI Observability Integration for Grafana Cloud provides monitoring for AI infrastructure and applications. Monitor GenAI applications with LLM metrics, costs, and quality evaluations; track VectorDB performance and operations; observe MCP (Model Context Protocol) implementations, and monitor GPU performance across your AI workloads.
This integration includes 6 pre-built dashboards to help monitor and visualize AI Observability metrics.
Dashboards
The AI Observability integration installs the following dashboards in your Grafana Cloud instance to help monitor your system.
- Agent Observability
- GPU Monitoring
- GenAI Evaluations
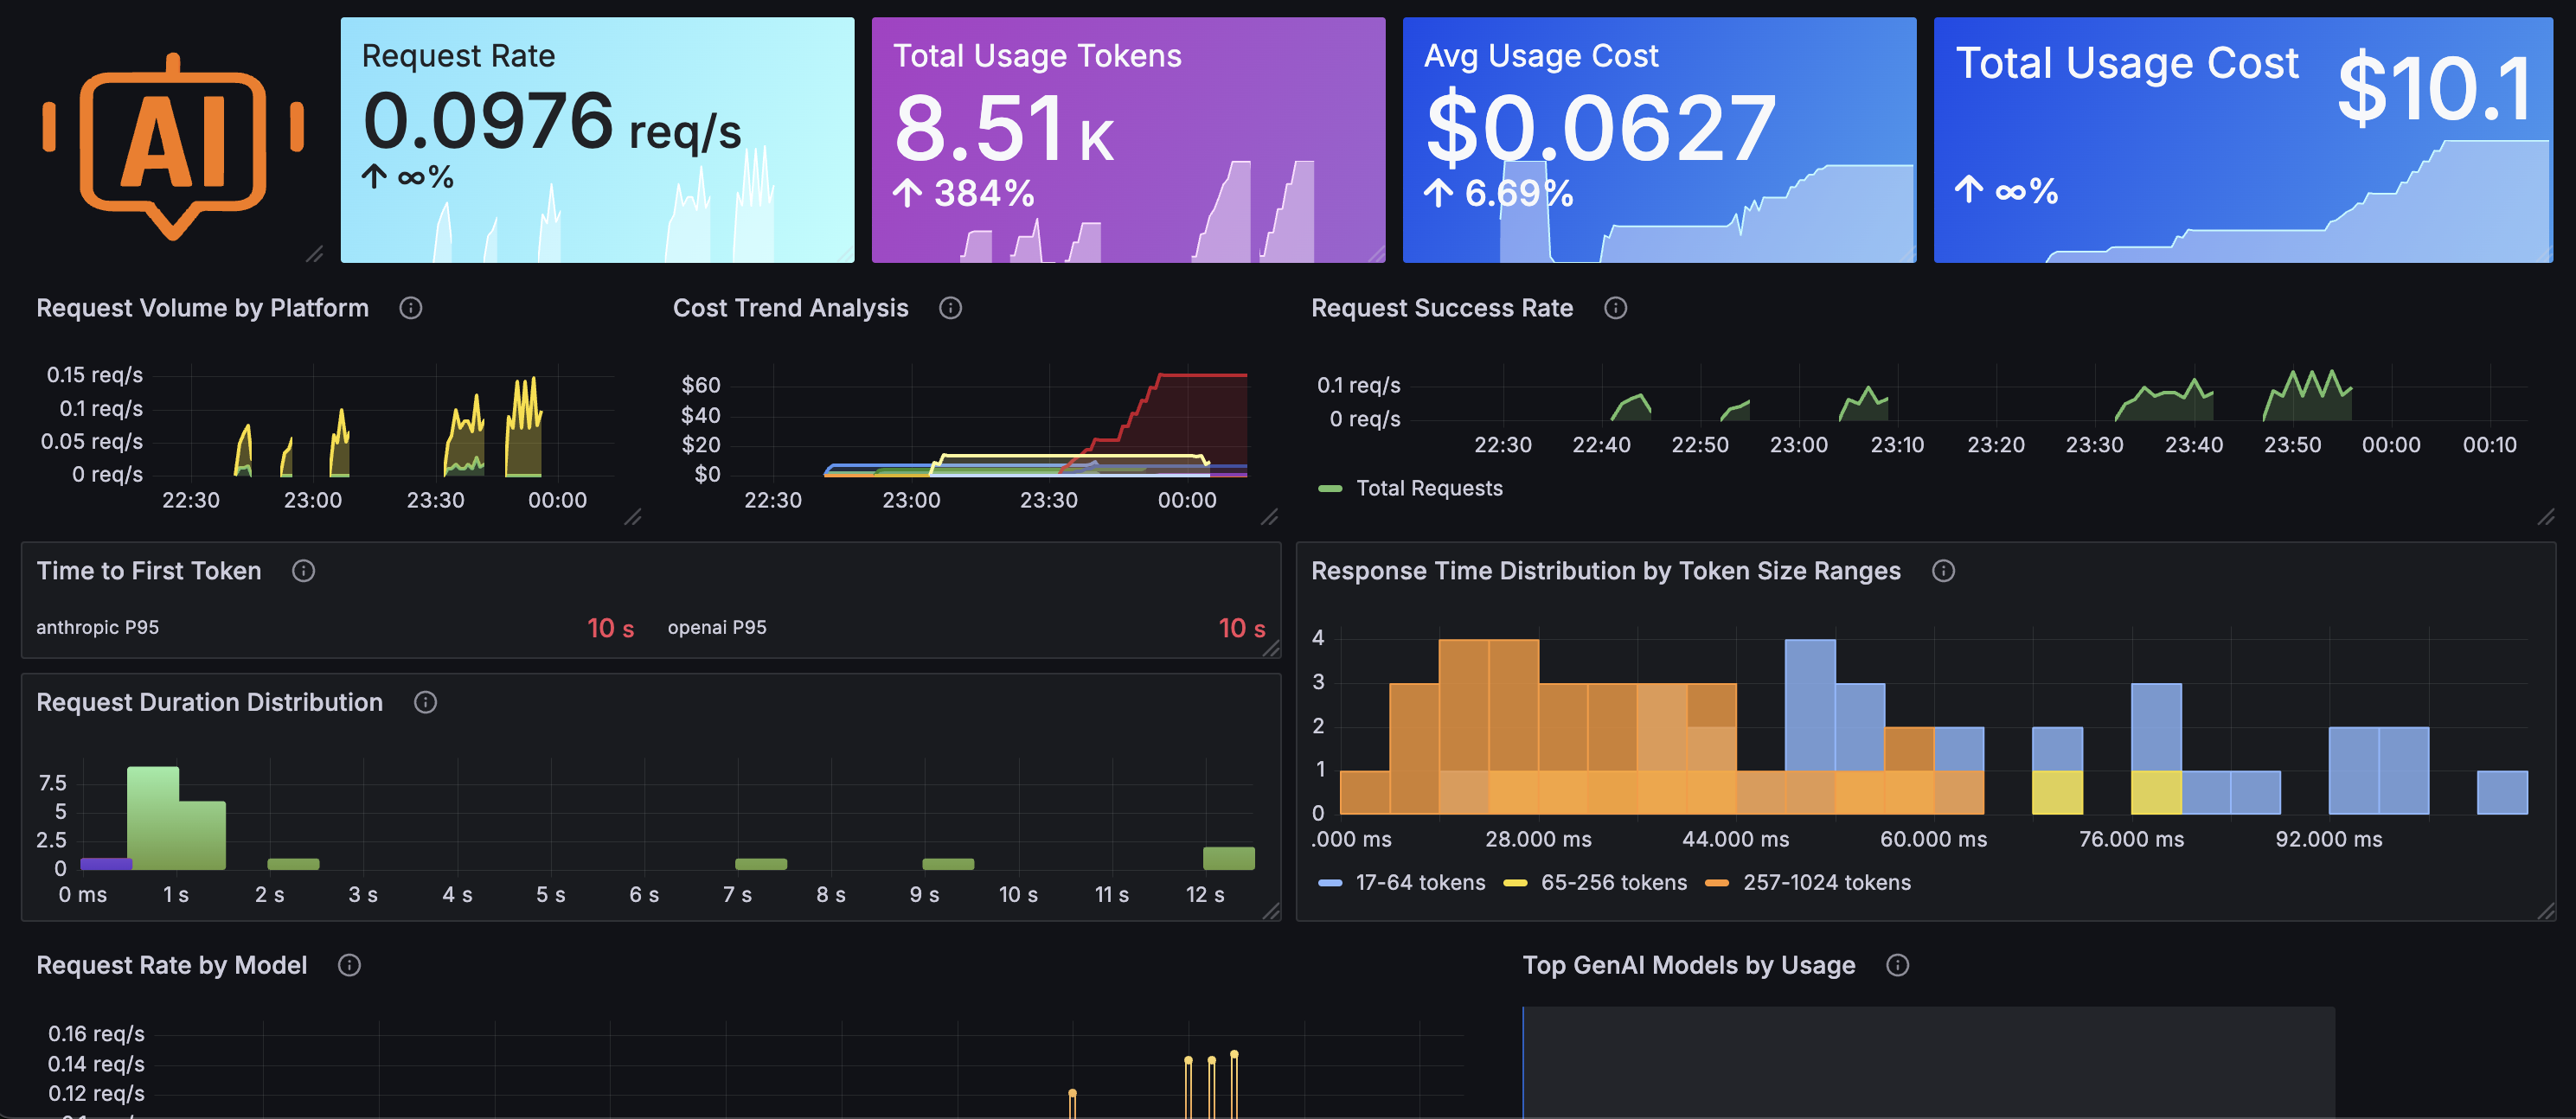
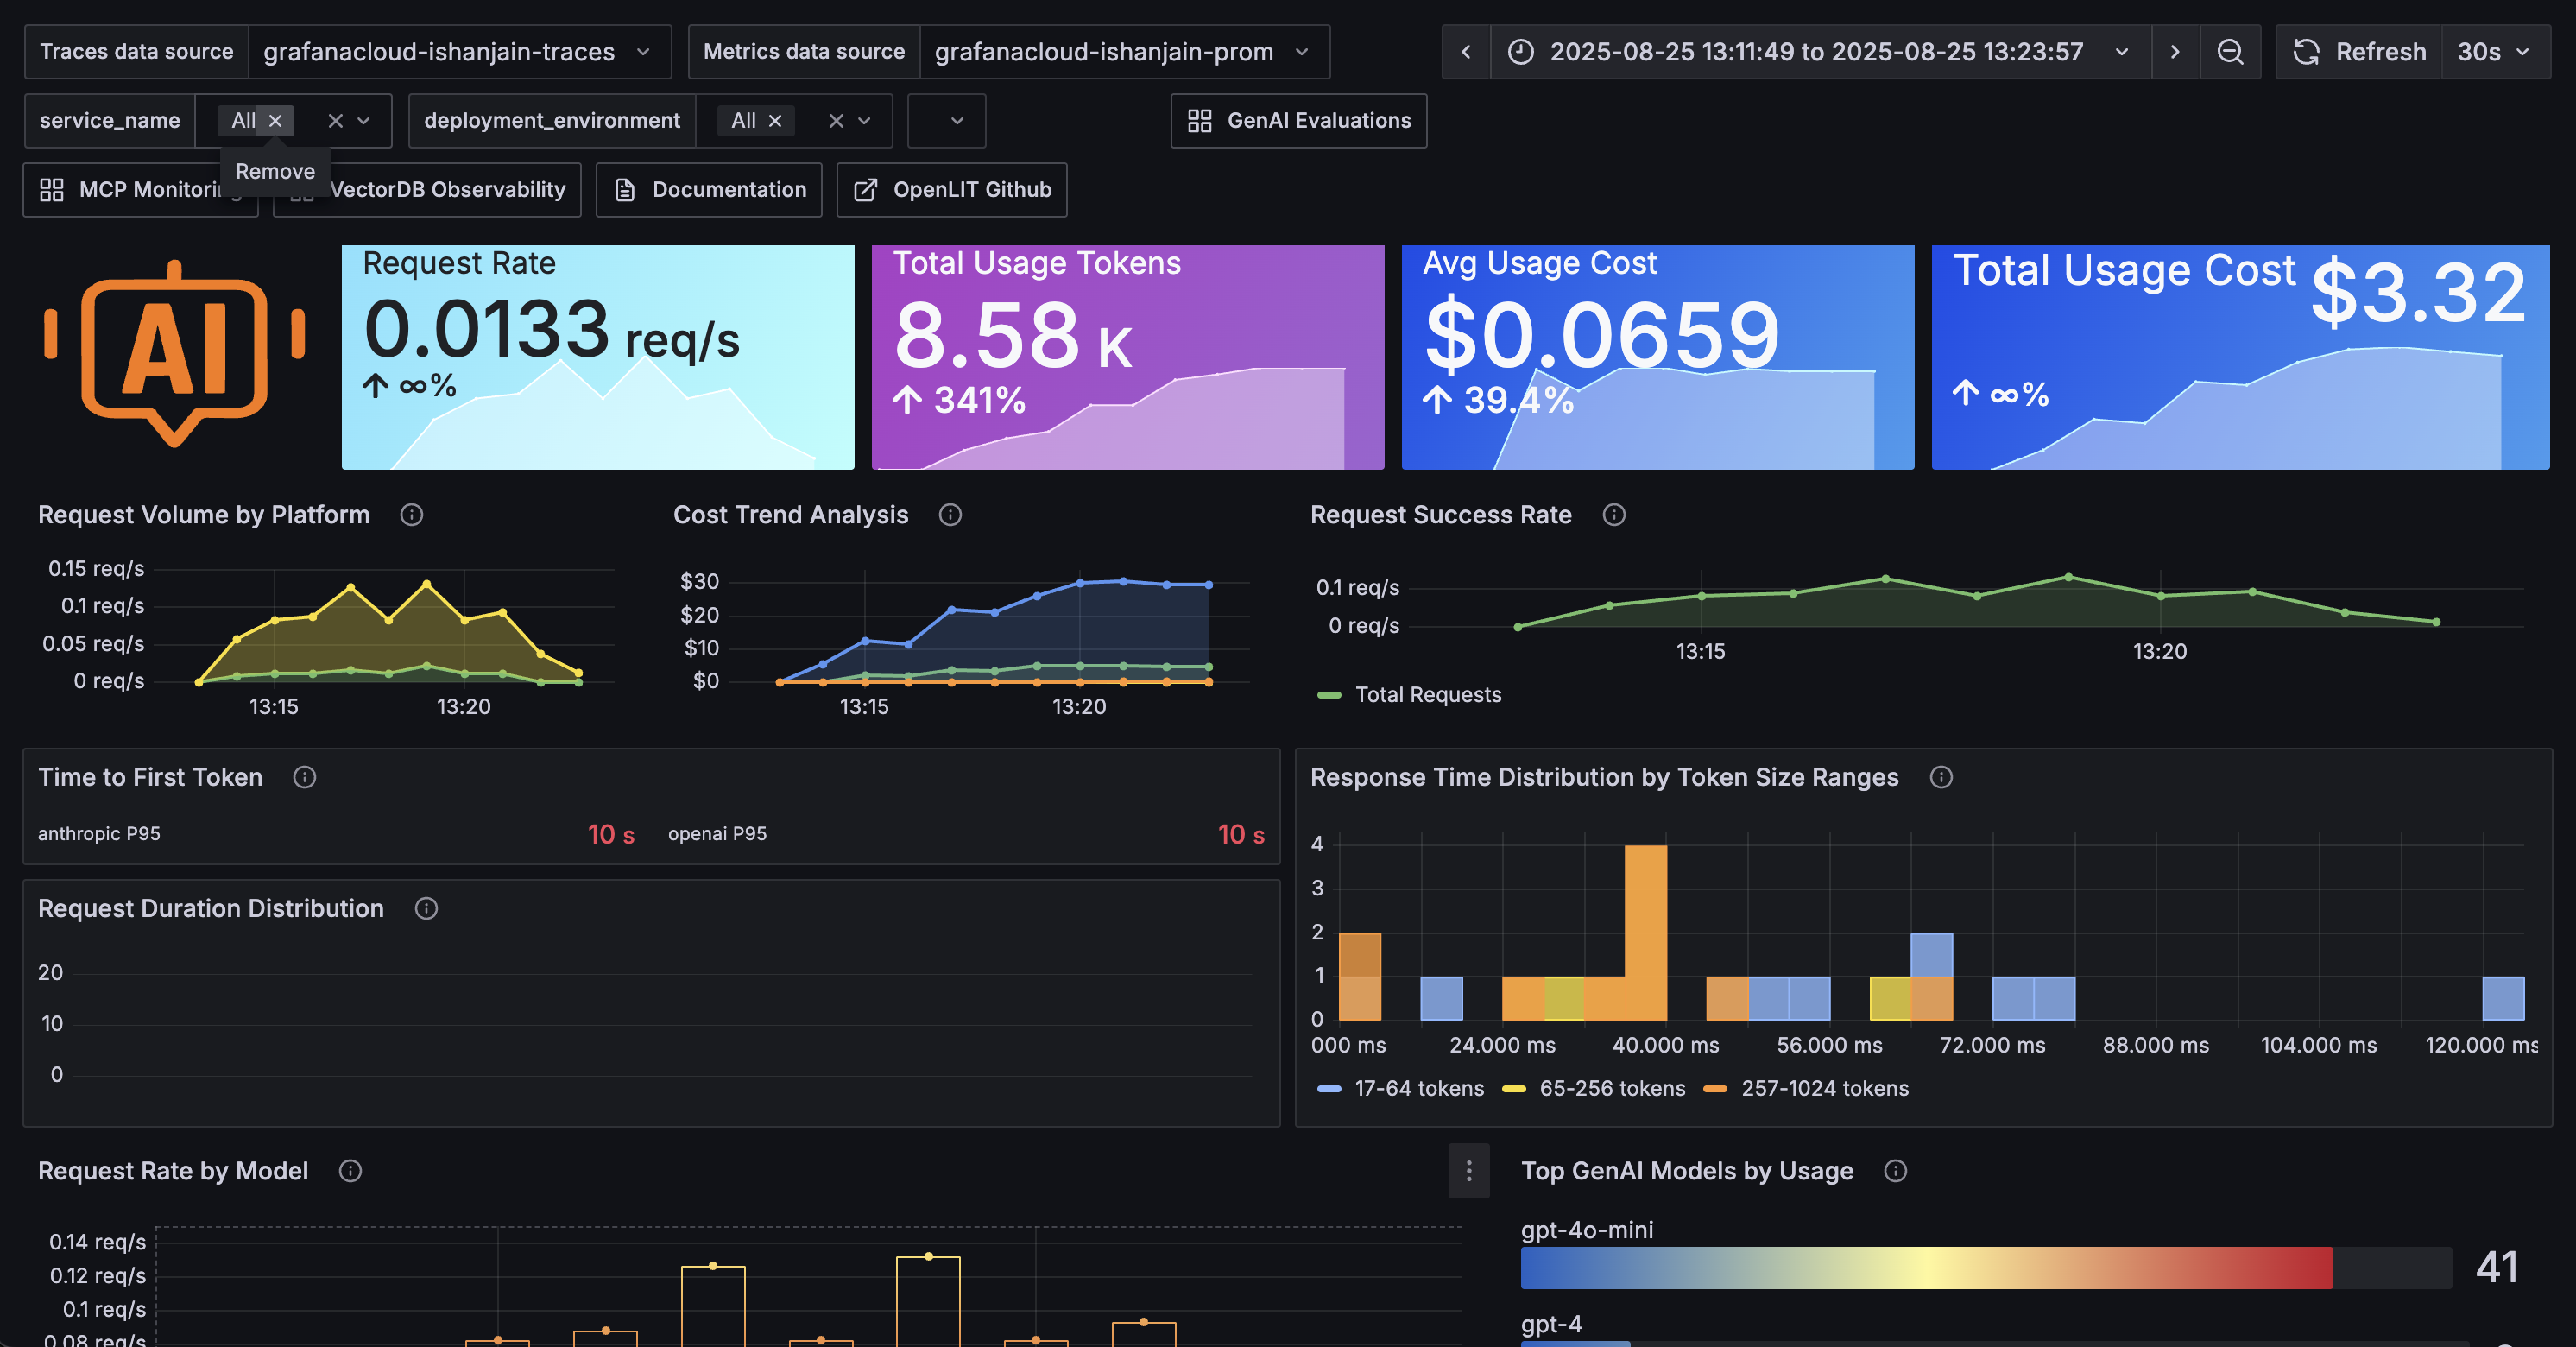
- GenAI Observability
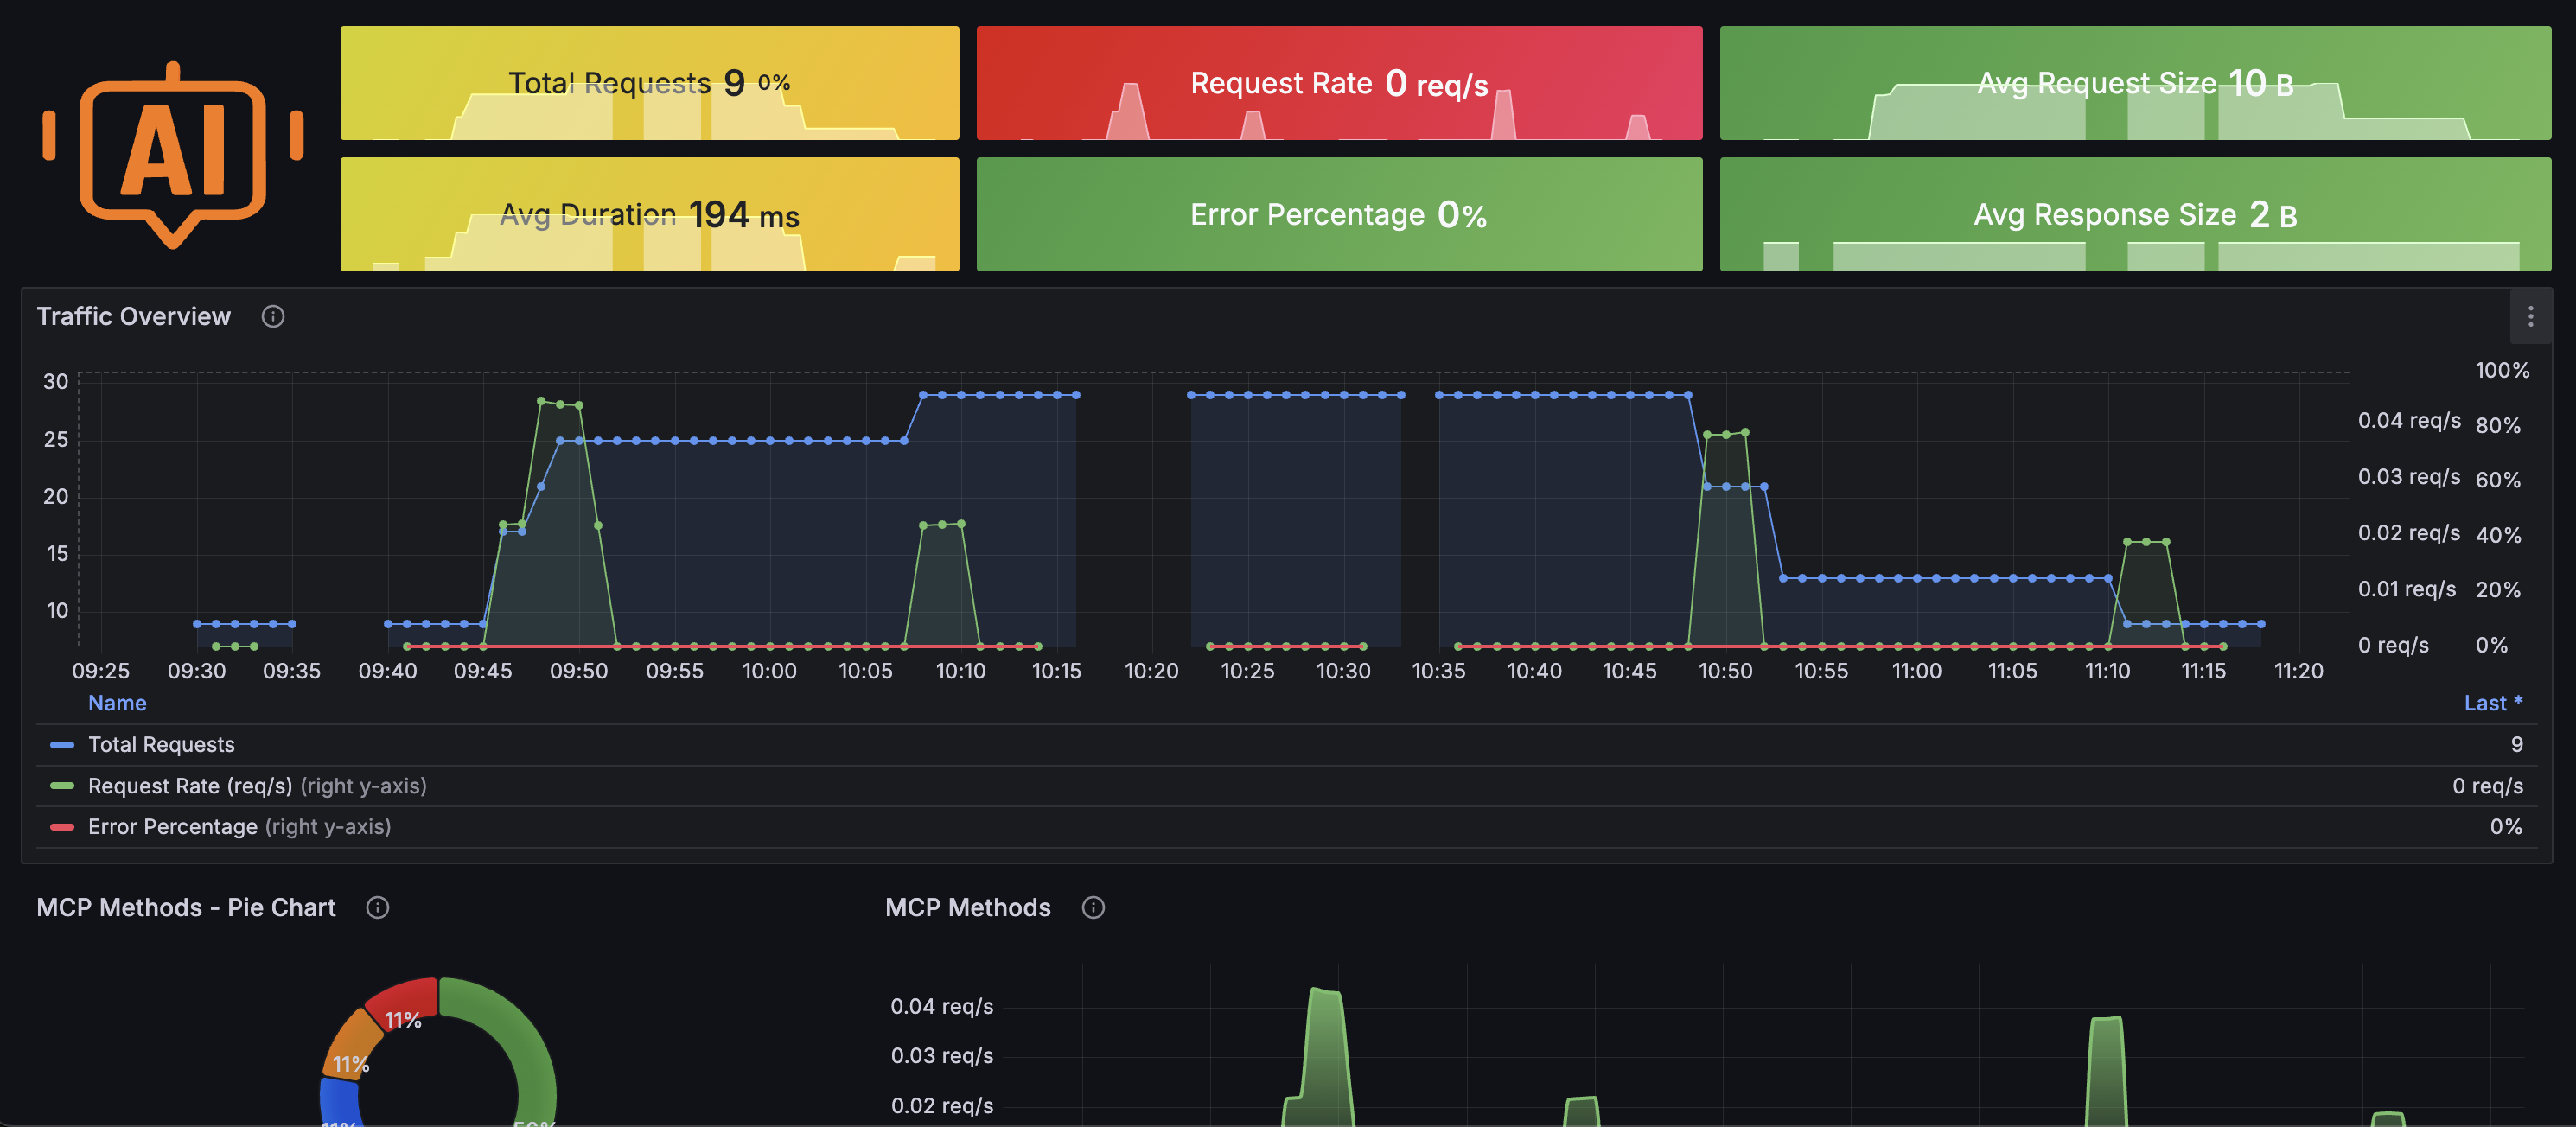
- MCP Observability
- VectorDB Observability
GenAI Observability Dashboard 1
VectorDB Observability Dashboard 1
MCP Observability Dashboard 1
Metrics
The most important metrics provided by the AI Observability integration, which are used on the pre-built dashboards, are as follows:
- db_client_operation_duration_seconds_bucket
- db_client_operation_duration_seconds_count
- db_client_operation_duration_seconds_sum
- db_requests_total
- gen_ai_agent_invocations_total
- gen_ai_agent_operation_duration_seconds_bucket
- gen_ai_agent_operation_duration_seconds_count
- gen_ai_agent_operation_duration_seconds_sum
- gen_ai_client_operation_duration_seconds_bucket
- gen_ai_client_operation_duration_seconds_count
- gen_ai_client_token_usage_bucket
- gen_ai_client_token_usage_sum
- gen_ai_server_time_to_first_token_seconds_bucket
- gen_ai_usage_cost_USD_bucket
- gen_ai_usage_cost_USD_count
- gen_ai_usage_cost_USD_sum
- gpu_dec_utilization
- gpu_enc_utilization
- gpu_fan_speed
- gpu_memory_available
- gpu_memory_free
- gpu_memory_total
- gpu_memory_used
- gpu_power_draw
- gpu_power_limit
- gpu_temperature
- gpu_utilization
- mcp_client_operation_duration_seconds_count
- mcp_client_operation_duration_seconds_sum
- mcp_errors_total
- mcp_request_size_bytes_count
- mcp_request_size_bytes_sum
- mcp_requests_total
- mcp_response_size_bytes_count
- mcp_response_size_bytes_sum
- mcp_tool_calls_total
- up
Changelog
# 1.2.0 - March 2026
* Fix dashboards queries and add Agent O11y dashboard

# 1.1.0 - March 2026
* Update dashboards to align with new SDK version

# 1.0.0 - August 2025

* Add monitoring dashboards for GenAI, Evals, MCP and VectorDB
* Update the instructions for clarity

# 0.0.1 - September 2024

* Initial release
Cost
By connecting your AI Observability instance to Grafana Cloud, you might incur charges. To view information on the number of active series that your Grafana Cloud account uses for metrics included in each Cloud tier, see Active series and dpm usage and Cloud tier pricing.


