Go integration for Grafana Cloud
The Go programming language (golang) is a programming language designed at Google to make programmers more productive in applications with strong networking concurrency needs. This integration enables Grafana Alloy to send Golang runtime metrics instrumented by Prometheus client_golang or OpenTelemetry Golang runtime metrics to Grafana Cloud along with a useful default dashboard for visualization.
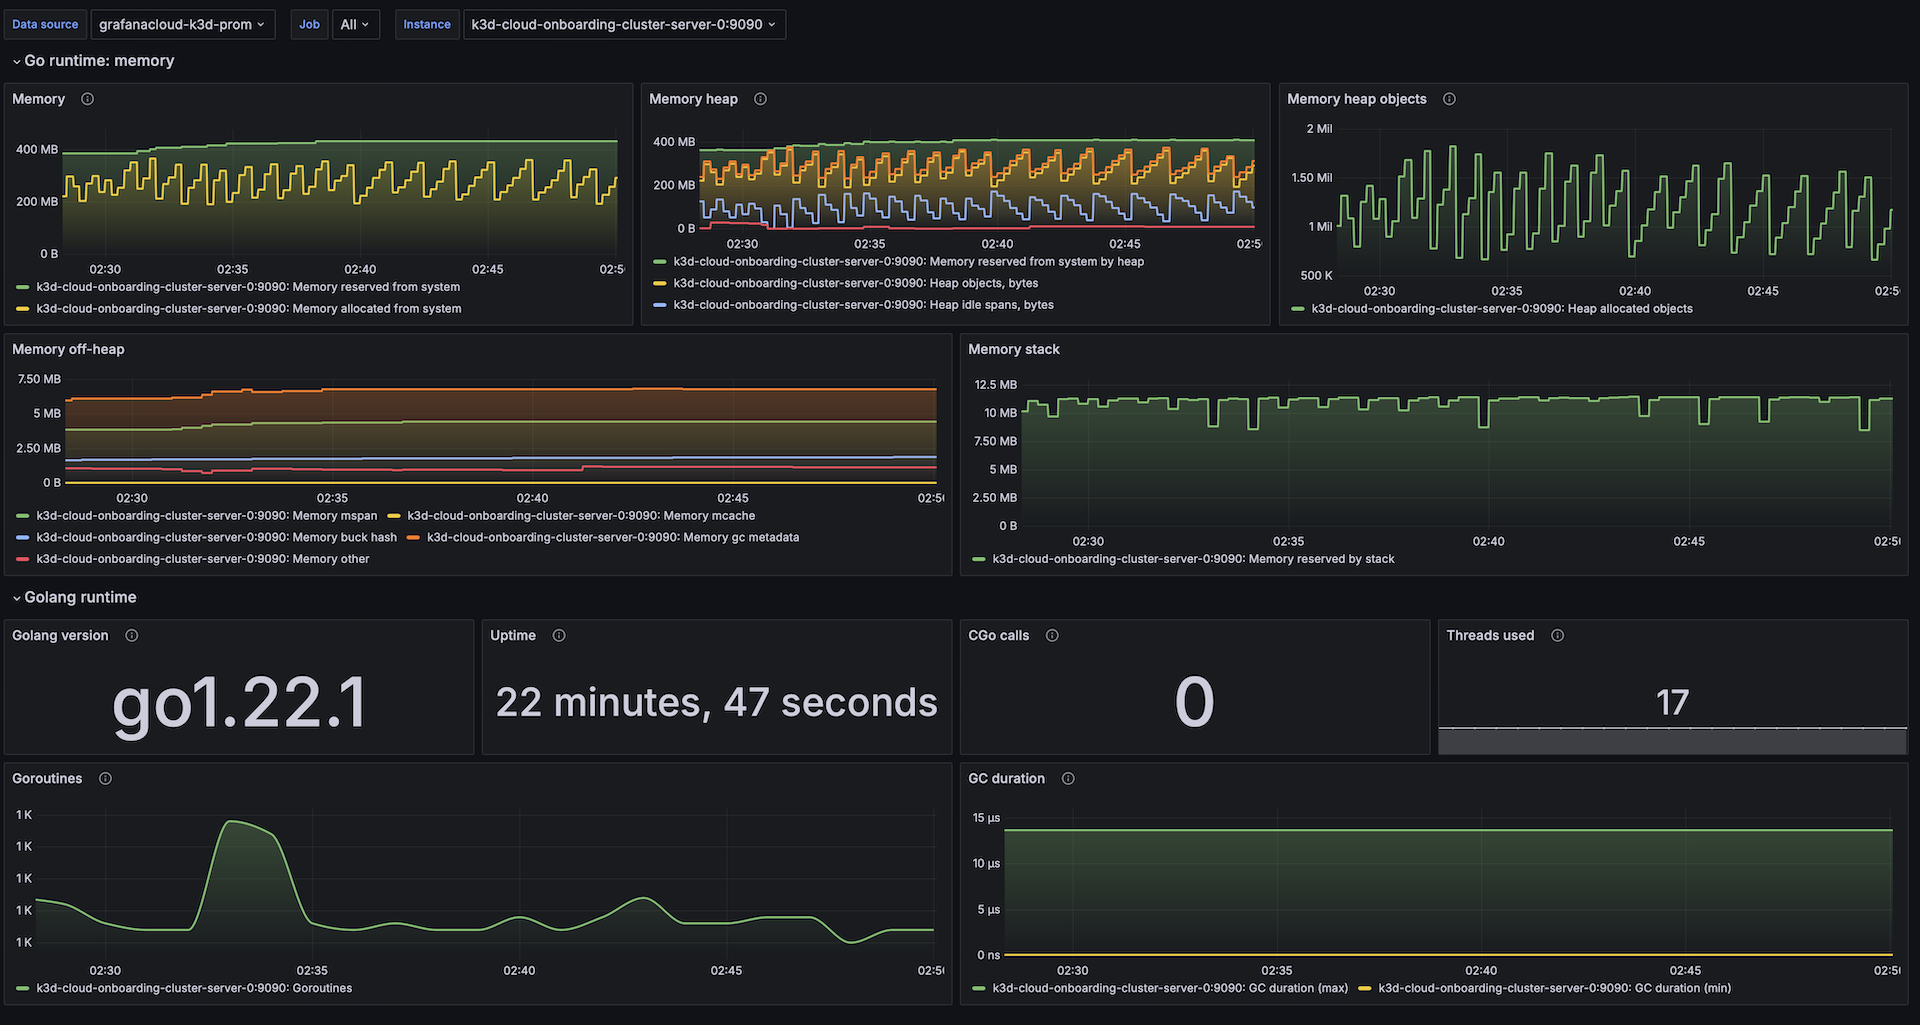
This integration includes 1 pre-built dashboard to help monitor and visualize Go metrics.
Before you begin
This integration monitors the Go runtime for a process that exposes metrics through Golang client.
Please check the docs for details on how to expose your Go runtime metrics.
Install Go integration for Grafana Cloud
- In your Grafana Cloud stack, click Connections in the left-hand menu.
- Find Go and click its tile to open the integration.
- Review the prerequisites in the Configuration Details tab and set up Grafana Alloy to send Go metrics to your Grafana Cloud instance.
- Click Install to add this integration’s pre-built dashboard to your Grafana Cloud instance, and you can start monitoring your Go setup.
Configuration snippets for Grafana Alloy
Simple mode
These snippets are configured to scrape a single Go instance running locally with default ports.
First, manually copy and append the following snippets into your alloy configuration file.
Metrics snippets
discovery.relabel "metrics_integrations_integrations_go" {
	targets = [{
		__address__ = "localhost:8080",
	}]

	rule {
		target_label = "instance"
		replacement  = constants.hostname
	}
}

prometheus.scrape "metrics_integrations_integrations_go" {
	targets    = discovery.relabel.metrics_integrations_integrations_go.output
	forward_to = [prometheus.remote_write.metrics_service.receiver]
	job_name   = "integrations/go"
}
Advanced mode
The following snippets provide examples to guide you through the configuration process.
To instruct Grafana Alloy to scrape your Go instances, manually copy and append the snippets to your alloy configuration file, then follow subsequent instructions.
Advanced metrics snippets
discovery.relabel "metrics_integrations_integrations_go" {
	targets = [{
		__address__ = "localhost:8080",
	}]

	rule {
		target_label = "instance"
		replacement  = constants.hostname
	}
}

prometheus.scrape "metrics_integrations_integrations_go" {
	targets    = discovery.relabel.metrics_integrations_integrations_go.output
	forward_to = [prometheus.remote_write.metrics_service.receiver]
	job_name   = "integrations/go"
}
To monitor your Go instance, you must use a discovery.relabel component to discover your Go Prometheus endpoint and apply appropriate labels, followed by a prometheus.scrape component to scrape it.
Configure the following properties within each discovery.relabel component:
__address__: The address to your Go Prometheus metrics endpoint.instancelabel:constants.hostnamesets theinstancelabel to your Grafana Alloy server hostname. If that is not suitable, change it to a value uniquely identifies this Go instance.
If you have multiple Go servers to scrape, configure one discovery.relabel for each and scrape them by including each under targets within the prometheus.scrape component.
Dashboards
The Go integration installs the following dashboards in your Grafana Cloud instance to help monitor your system.
- Golang runtime
Go runtime metrics
Metrics
The most important metrics provided by the Go integration, which are used on the pre-built dashboard, are as follows:
- go_cgo_go_to_c_calls_calls_total
- go_gc_duration_seconds
- go_goroutines
- go_info
- go_memstats_alloc_bytes
- go_memstats_buck_hash_sys_bytes
- go_memstats_gc_sys_bytes
- go_memstats_heap_alloc_bytes
- go_memstats_heap_idle_bytes
- go_memstats_heap_inuse_bytes
- go_memstats_heap_objects
- go_memstats_heap_released_bytes
- go_memstats_heap_sys_bytes
- go_memstats_mcache_sys_bytes
- go_memstats_mspan_sys_bytes
- go_memstats_other_sys_bytes
- go_memstats_stack_sys_bytes
- go_memstats_sys_bytes
- go_threads
- process_runtime_go_cgo_calls
- process_runtime_go_gc_pause_ns_bucket
- process_runtime_go_goroutines
- process_runtime_go_mem_heap_alloc
- process_runtime_go_mem_heap_alloc_bytes
- process_runtime_go_mem_heap_idle
- process_runtime_go_mem_heap_idle_bytes
- process_runtime_go_mem_heap_inuse
- process_runtime_go_mem_heap_inuse_bytes
- process_runtime_go_mem_heap_objects
- process_runtime_go_mem_heap_released
- process_runtime_go_mem_heap_released_bytes
- process_start_time_seconds
- runtime_uptime
- runtime_uptime_milliseconds_total
- up
Changelog
# 1.1.0 - September 2024

* This integration now supports prometheus [client_golang](https://github.com/prometheus/client_golang) and OTel [Golang runtime metrics ](https://pkg.go.dev/go.opentelemetry.io/contrib/instrumentation/runtime) at the same time
* Dashboard update: swap 'Golang runtime' row and 'Go runtime: memory' rows.

# 1.0.0 - May 2024

* Updated dashboard: Refactored with observability library.

# 0.0.6 - September 2023

* New Filter Metrics option for configuring the Grafana Agent, which saves on metrics cost by dropping any metric not used by this integration. Beware that anything custom built using metrics that are not on the snippet will stop working.
* New hostname relabel option, which applies the instance name you write on the text box to the Grafana Agent configuration snippets, making it easier and less error prone to configure this mandatory label.

# 0.0.5 - January 2023

* Update dashboard panels to TimeSeries.

# 0.0.4 - September 2022

* Update dashboard panels.

# 0.0.3 - January 2022

* Update mixin to latest version:
  - Use `job` variable in panels legend

# 0.0.2 - October 2021

* Update mixin to latest version:
  - Update the datasource template variable label to 'Data Source'

# 0.0.1 - November 2020

* Initial release
Cost
By connecting your Go instance to Grafana Cloud, you might incur charges. To view information on the number of active series that your Grafana Cloud account uses for metrics included in each Cloud tier, see Active series and dpm usage and Cloud tier pricing.


