
Configure Express exporter to generate Prometheus metrics
This topic describes how to configure the Express Middleware exporter.
To configure the Express exporter to generate Prometheus metrics, complete the following steps.
Add the Express exporter as a dependency in your NodeJS package.json.
{
  ...
  "dependencies": {
      ...
      "express-prometheus-middleware": "1.2.0"
  }
}
Import the package and add it to the Express application.
...
const promMid = require('express-prometheus-middleware');
...

app.use(promMid({
    metricsPath: '/metrics',
    collectDefaultMetrics: true,
    requestDurationBuckets: [0.1, 0.5, 1, 3, 5, 10],
    /**
     * Uncomenting the `authenticate` callback will make the `metricsPath` route
     * require authentication. This authentication callback can make a simple
     * basic auth test, or even query a remote server to validate access.
     * To access /metrics you could do:
     * curl -X GET user:password@localhost:9091/metrics
     */
    // authenticate: req => req.headers.authorization === 'Basic dXNlcjpwYXNzd29yZA==',
    /**
     * Uncommenting the `extraMasks` config will use the list of regexes to
     * reformat URL path names and replace the values found with a placeholder value
    */
    // extraMasks: [/..:..:..:..:..:../],
    /**
     * The prefix option will cause all metrics to have the given prefix.
     * E.g.: `app_prefix_http_requests_total`
     */
    // prefix: 'app_prefix_',
    /**
     * Can add custom labels with customLabels and transformLabels options
     */
    // customLabels: ['contentType'],
    // transformLabels(labels, req) {
    //   // eslint-disable-next-line no-param-reassign
    //   labels.contentType = req.headers['content-type'];
    // },
   }));
If the request URLs include IDs, for example, GET /order/1234567, capture the URLs as /order/{id} to avoid metric explosion.
In the following example, the regexp [0-9]+, which captures numbers 1234567, can be specified in the extraMasks list of regular expressions.
extraMasks: ['[0-9]+']Verify the presence of the following metrics:
- http_requests_total
- http_request_duration_seconds_count
- http_request_duration_seconds_sum
- http_request_duration_seconds_bucket
Metrics
| Metric | KPI |
Requests http_requests_total | Request Rate rate(http_requests_total[5m]) |
Errors http_requests_total | Error Ratio (server errors) rate(http_requests_total{status=~"5.."}[5m])/ rate(http_requests_total[5m]) Error Ratio (client errors) rate(http_requests_total{statusCode=~"4.."}[5m])/ rate(http_requests_total[5m]) |
Latency http_request_duration_seconds | Latency Average rate(http_request_duration_seconds_sum[5m])/ rate(http_request_duration_seconds_count[5m]) Latency P99 histogram_quantile ( |
Alerts
| KPI | Alerts |
|---|---|
| Request Rate | RequestRateAnomaly |
| Error Rate | ErrorRatioBreach ErrorBuildup based on a 99.9 SLO |
Latency Average Latency P99 | LatencyAverageBreach LatencyAverageAnomaly LatencyP99ErrorBuildup |
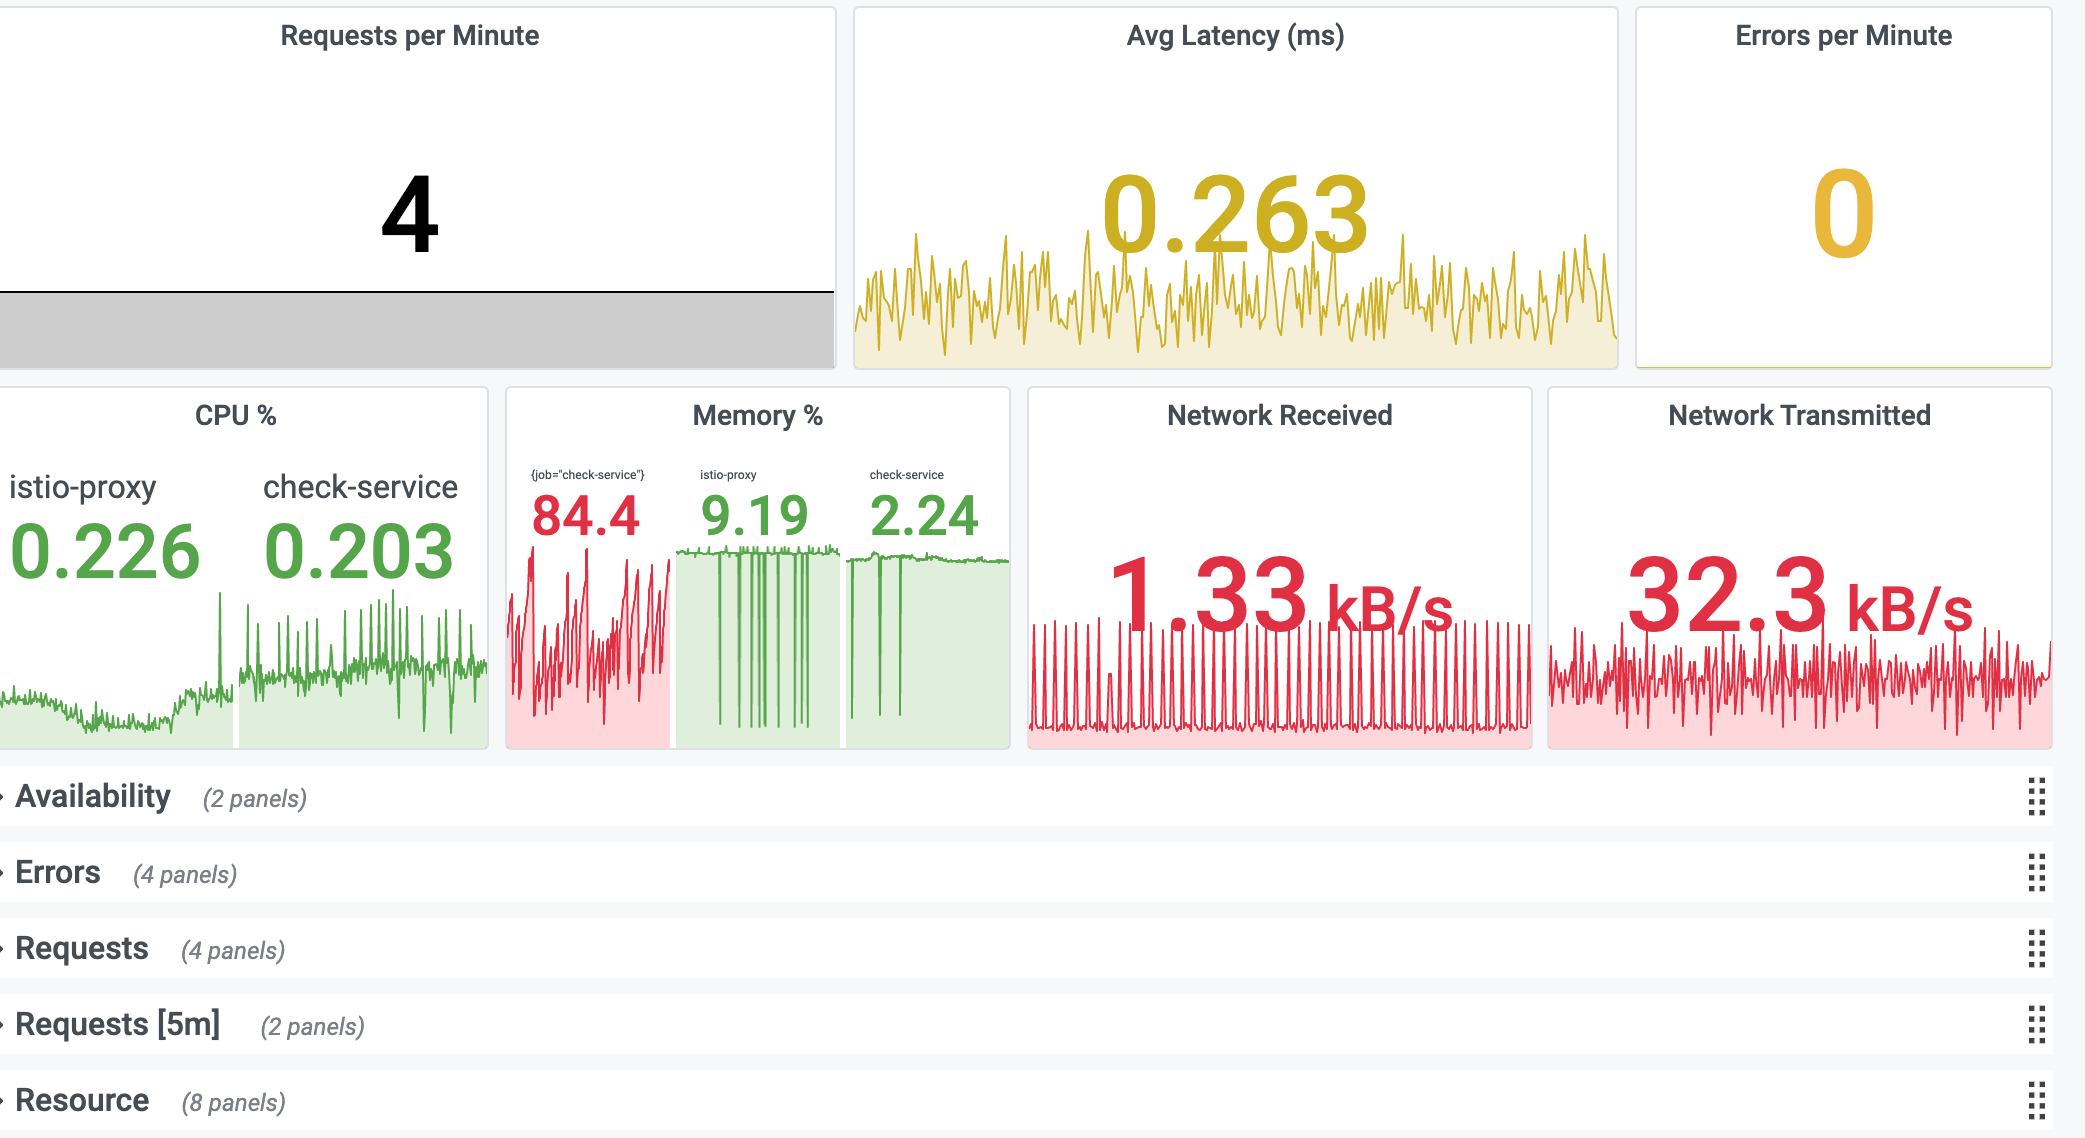
Service KPI dashboard
This dashboard has the following KPIs from resources and requests:
- Request Rate
- Latency Average
- Latency P99
- Error Rate
- CPU %
- CPU Cores Used
- CPU Throttle
- Memory %
- Memory Bytes
- Disk Usage
- Network Usage
Was this page helpful?
Related resources from Grafana Labs


