F5 BIG-IP integration for Grafana Cloud
F5 BIG-IP is a multifaceted application delivery controller (ADC) that offers load balancing, traffic management, security, and performance optimization for business-critical applications. Deployed as hardware, virtual, or cloud instances, it provides essential scalability and resilience, ensuring uninterrupted and secure access to applications across diverse environments. This integration for Grafana cloud allows users to monitor a BIG-IP cluster with 5 separate dashboards for visualizing metrics and logs for a BIG-IP cluster, node, pool, virtual server, and logs overview dashboards.
This integration supports BIG-IP version 16.1.2+
This integration includes 4 useful alerts and 5 pre-built dashboards to help monitor and visualize F5 BIG-IP metrics.
Before you begin
In order for the integration to properly work, you must set up the F5 BIG-IP exporter and Promtail to collect metrics and logs from F5 BIG-IP. It is recommended to have a separate host where the BIG-IP exporter and Promtail exists away from F5 BIG-IP to be fault-tolerant.
Installing BIG-IP prometheus exporter
The BIG-IP exporter is used to collect metrics and should be hosted on a separate system with Promtail. Once the exporter is installed, config parameters are supplied and then the exporter can be started. To start the service, add BIG-IP flags such as:
./bigip_exporter --bigip.host <bigip-host> --bigip.port <bigip-port> --bigip.username <bigip-username> --bigip.password <bigip-password>To validate that the BIG-IP Exporter is setup correctly, the Prometheus metrics should be available locally via curl:
curl http://localhost:9142/metricsCollecting BIG-IP logs
The Logs Overview dashboard actively tracks server, high-availability and audit logs through both a logs volume and raw logs panel. To successfully collect BIG-IP logs, you’ll need to complete several key steps: enable logs on the F5 BIG-IP system, forward these logs using a syslog-forward-converter, and finally, route them to Loki via Promtail.
Enabling logs
Start by enabling logs on your F5 BIG-IP system. These logs must first be enabled on the BIG-IP system which may include auth, authpriv, daemon, local0 and local6 files as recommended in the Mixin for the BIP-IP Log Overview. The logs dashboard can be used to select a syslog_facility which are created when enabling different log sources in BIG-IP. Additional logs can be enabled depending on the user’s need.
Forwarding logs from F5 BIG-IP to a separate host
After logs are enabled, the next step is to securely forward logs to a separate host where Promtail exists. Using a separate host provides an extra layer of security by reducing direct access to the F5 BIG-IP system. This can be done directly in the F5 BIG-IP UI by following these steps:
In Configuration: Navigate to System > Log > Remote Logging on the F5 BIG-IP interface. Then enter the IP address of the separate host to forward logs to.
Processing logs with Rsyslog
Unfortunately, Promtail only accepts syslog messages in RFC 5424 format, therefore you must first use Rsyslog as an intermediate log converter. Rsyslog can be installed on a separate host that Promtail and the BIG-IP exporter are on. Below are the steps to get Rsyslog running:
- Install Rsyslog: If not already installed, get it from the package manager of your choice.
- Configure Rsyslog: Edit
/etc/rsyslog.confor create a new configuration file in/etc/rsyslog.d/. Add the following:
module(load="imudp")
module(load="imtcp")

input(type="imudp" port="50514")
input(type="imtcp" port="50514")

*.*  action(type="omfwd"
      protocol="tcp" target="127.0.0.1" port="40514"
      Template="RSYSLOG_SyslogProtocol23Format"
      TCP_Framing="octet-counted" KeepAlive="on"
      action.resumeRetryCount="-1"
queue.type="linkedlist" queue.size="50000")- Restart Rsyslog: Apply the new settings with the following command:
sudo systemctl restart rsyslog- Verify Operation: Check
/var/log/syslogfor any Rsyslog errors.
Forwarding logs to Loki using Promtail
Finally, after installing Promtail with your method of choice, you will need to create a YAML configuration file. This file serves to integrate Rsyslog, Promtail, and Loki, allowing them to work cohesively. For an example and further explanation on how these components interact, refer to this guide. The resulting YAML configuration should look similar to the one below:
server:
  http_listen_port: 9080
  grpc_listen_port: 0

positions:
  filename: /tmp/positions.yaml

clients:
  - url: https://<user>:<pass>@logs-prod3.grafana.net/loki/api/v1/push

scrape_configs:
  - job_name: syslog
    syslog:
      listen_address: 0.0.0.0:40514
      idle_timeout: 12h
      listen_protocol: "udp"
      labels:
        job: "syslog"
    relabel_configs:
      - source_labels: ['__syslog_message_hostname']
        target_label: host
      - source_labels: ['__syslog_message_severity']
        target_label: level
      - source_labels: ['__syslog_message_facility']
        target_label: syslog_facility
      - source_labels: ['__syslog_message_app_name']
        target_label: syslog_identifier
Note, this is a separate Promtail YAML config, not the Alloy config where the metric scrapes are defined.
The clients credentials in the Promtail config must be updated with the correct credentials https://<user>:<pass>@logs-prod3.grafana.net/loki/api/v1/push. Depending on how Promtail was installed, Promtail will use the YAML configuration.
Install F5 BIG-IP integration for Grafana Cloud
- In your Grafana Cloud stack, click Connections in the left-hand menu.
- Find F5 BIG-IP and click its tile to open the integration.
- Review the prerequisites in the Configuration Details tab and set up Grafana Alloy to send F5 BIG-IP metrics to your Grafana Cloud instance.
- Click Install to add this integration’s pre-built dashboards and alerts to your Grafana Cloud instance, and you can start monitoring your F5 BIG-IP setup.
Configuration snippets for Grafana Alloy
Advanced mode
The following snippets provide examples to guide you through the configuration process.
To instruct Grafana Alloy to scrape your F5 BIG-IP instances, manually copy and append the snippets to your alloy configuration file, then follow subsequent instructions.
Advanced metrics snippets
prometheus.scrape "metrics_integrations_integrations_f5_bigip" {
	targets = [{
		__address__ = "<your-node-hostname>:9142",
	}]
	forward_to = [prometheus.remote_write.metrics_service.receiver]
	job_name   = "integrations/f5-bigip"
}
To monitor your F5 BIG-IP instance, you must use a discovery.relabel component to discover your F5 BIG-IP Prometheus endpoint and apply appropriate labels, followed by a prometheus.scrape component to scrape it.
Configure the following properties within each discovery.relabel component:
__address__: The address to your F5 BIG-IP Prometheus metrics endpoint.instancelabel:constants.hostnamesets theinstancelabel to your Grafana Alloy server hostname. If that is not suitable, change it to a value uniquely identifies this F5 BIG-IP instance.
If you have multiple F5 BIG-IP servers to scrape, configure one discovery.relabel for each and scrape them by including each under targets within the prometheus.scrape component.
Dashboards
The F5 BIG-IP integration installs the following dashboards in your Grafana Cloud instance to help monitor your system.
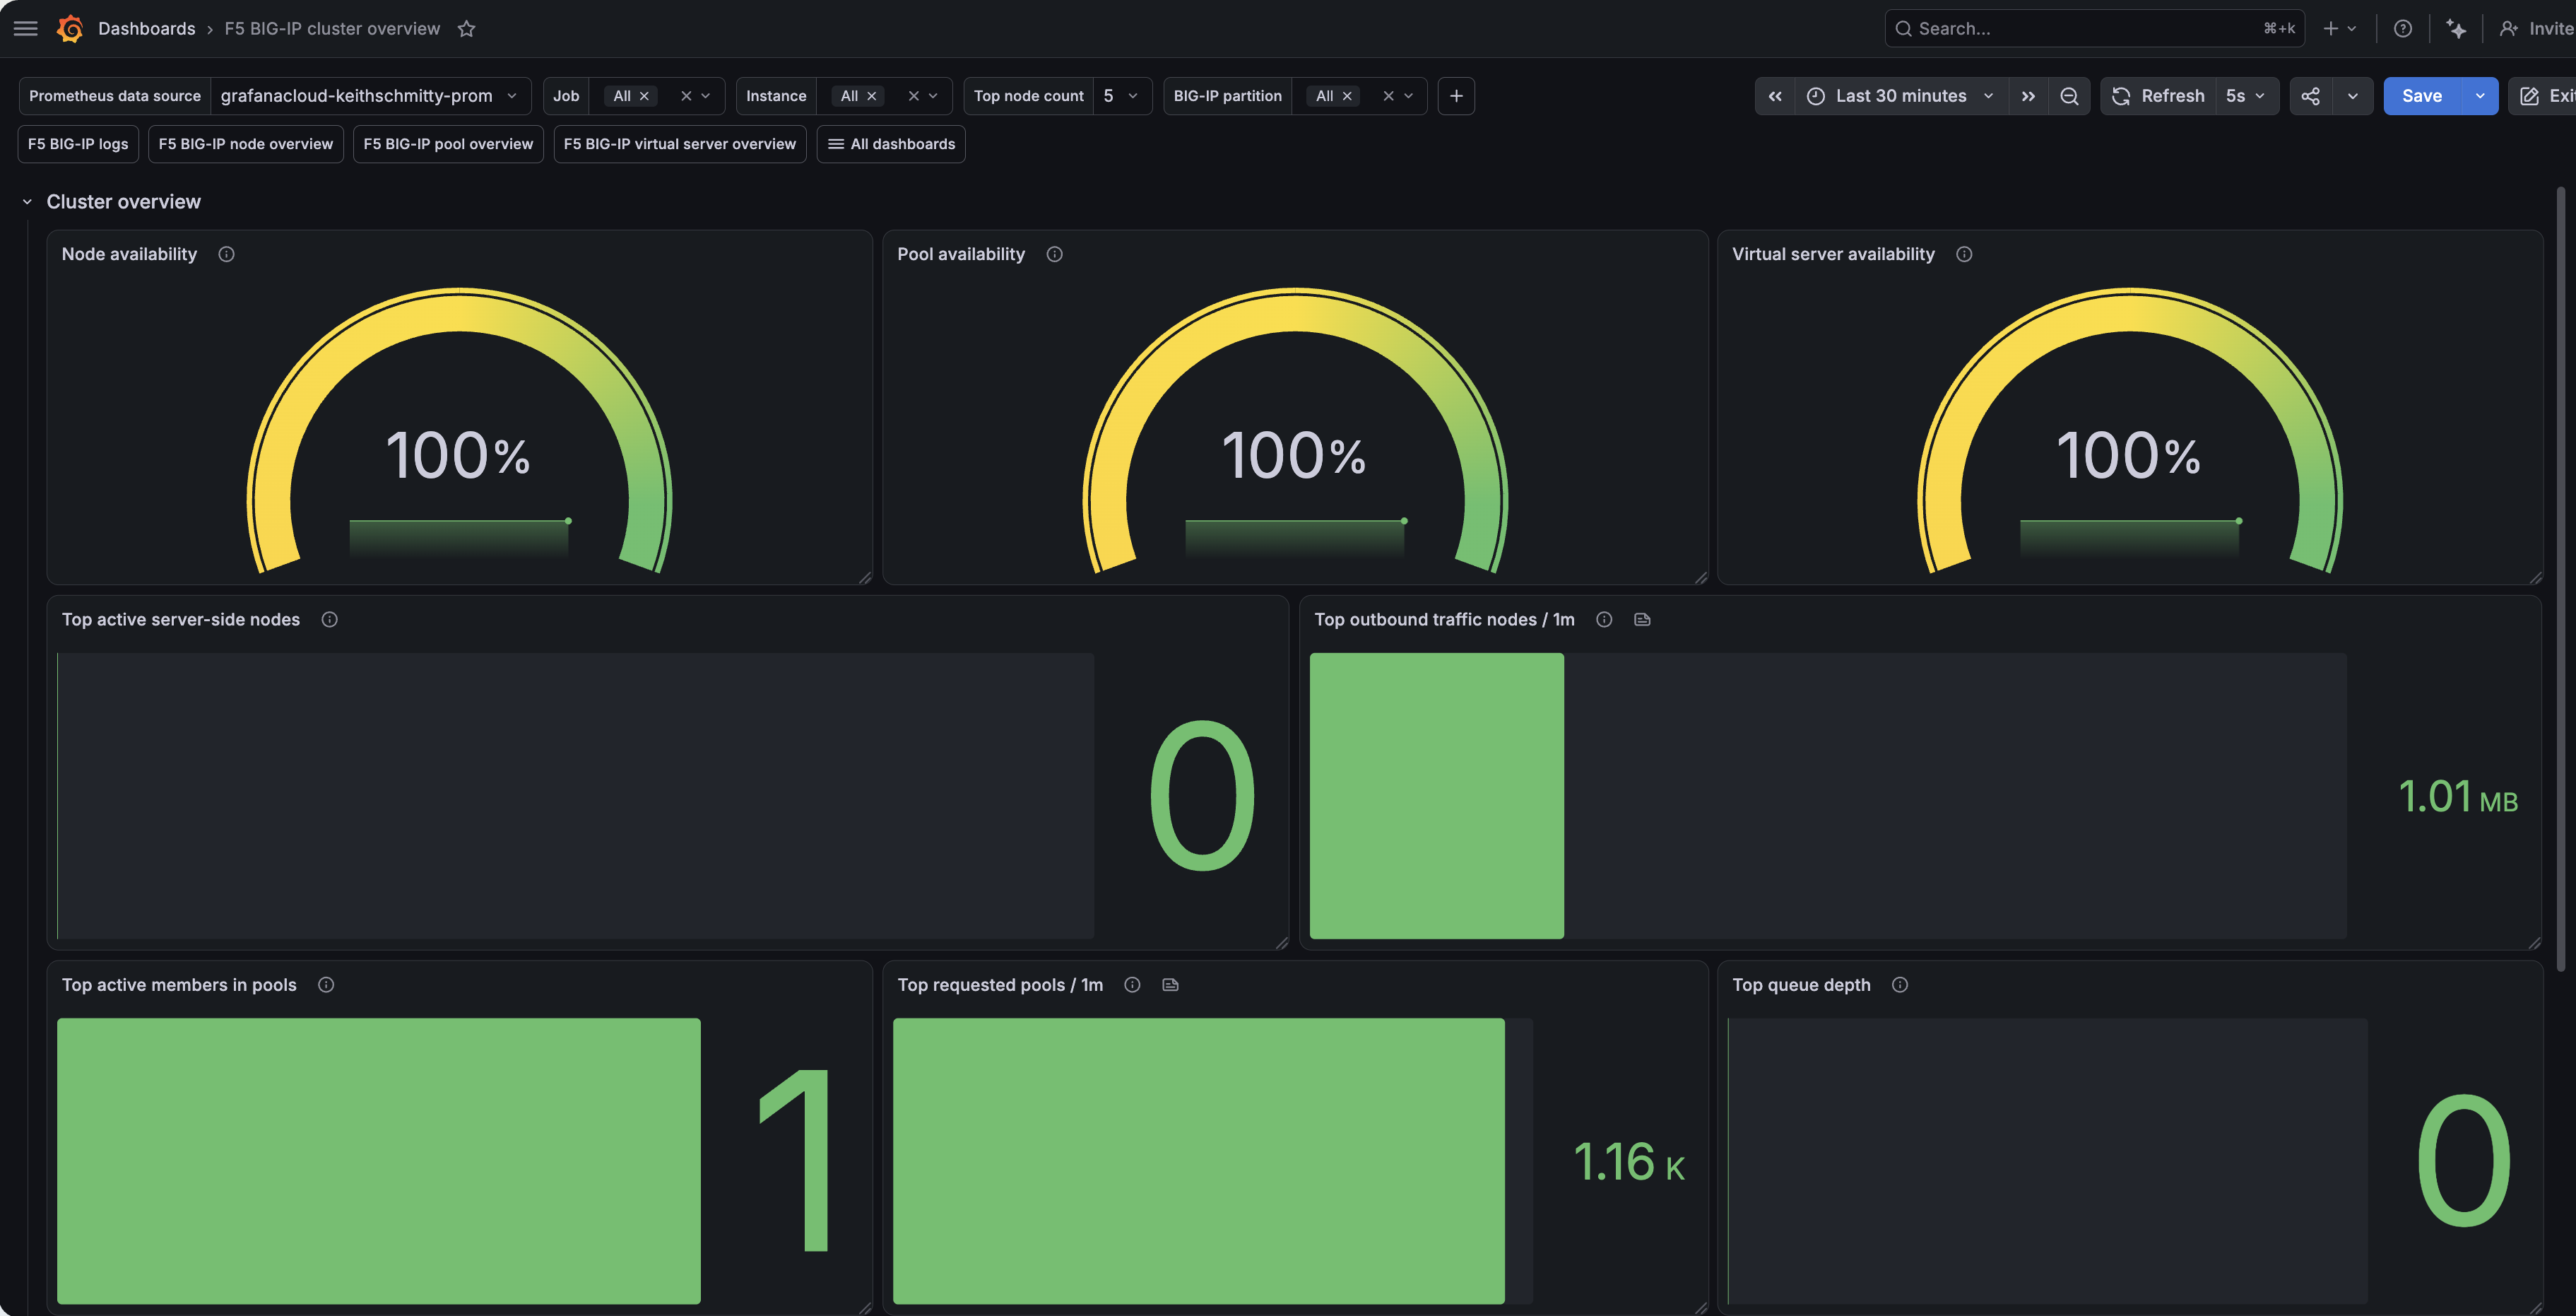
- BIG-IP cluster overview
- BIG-IP logs
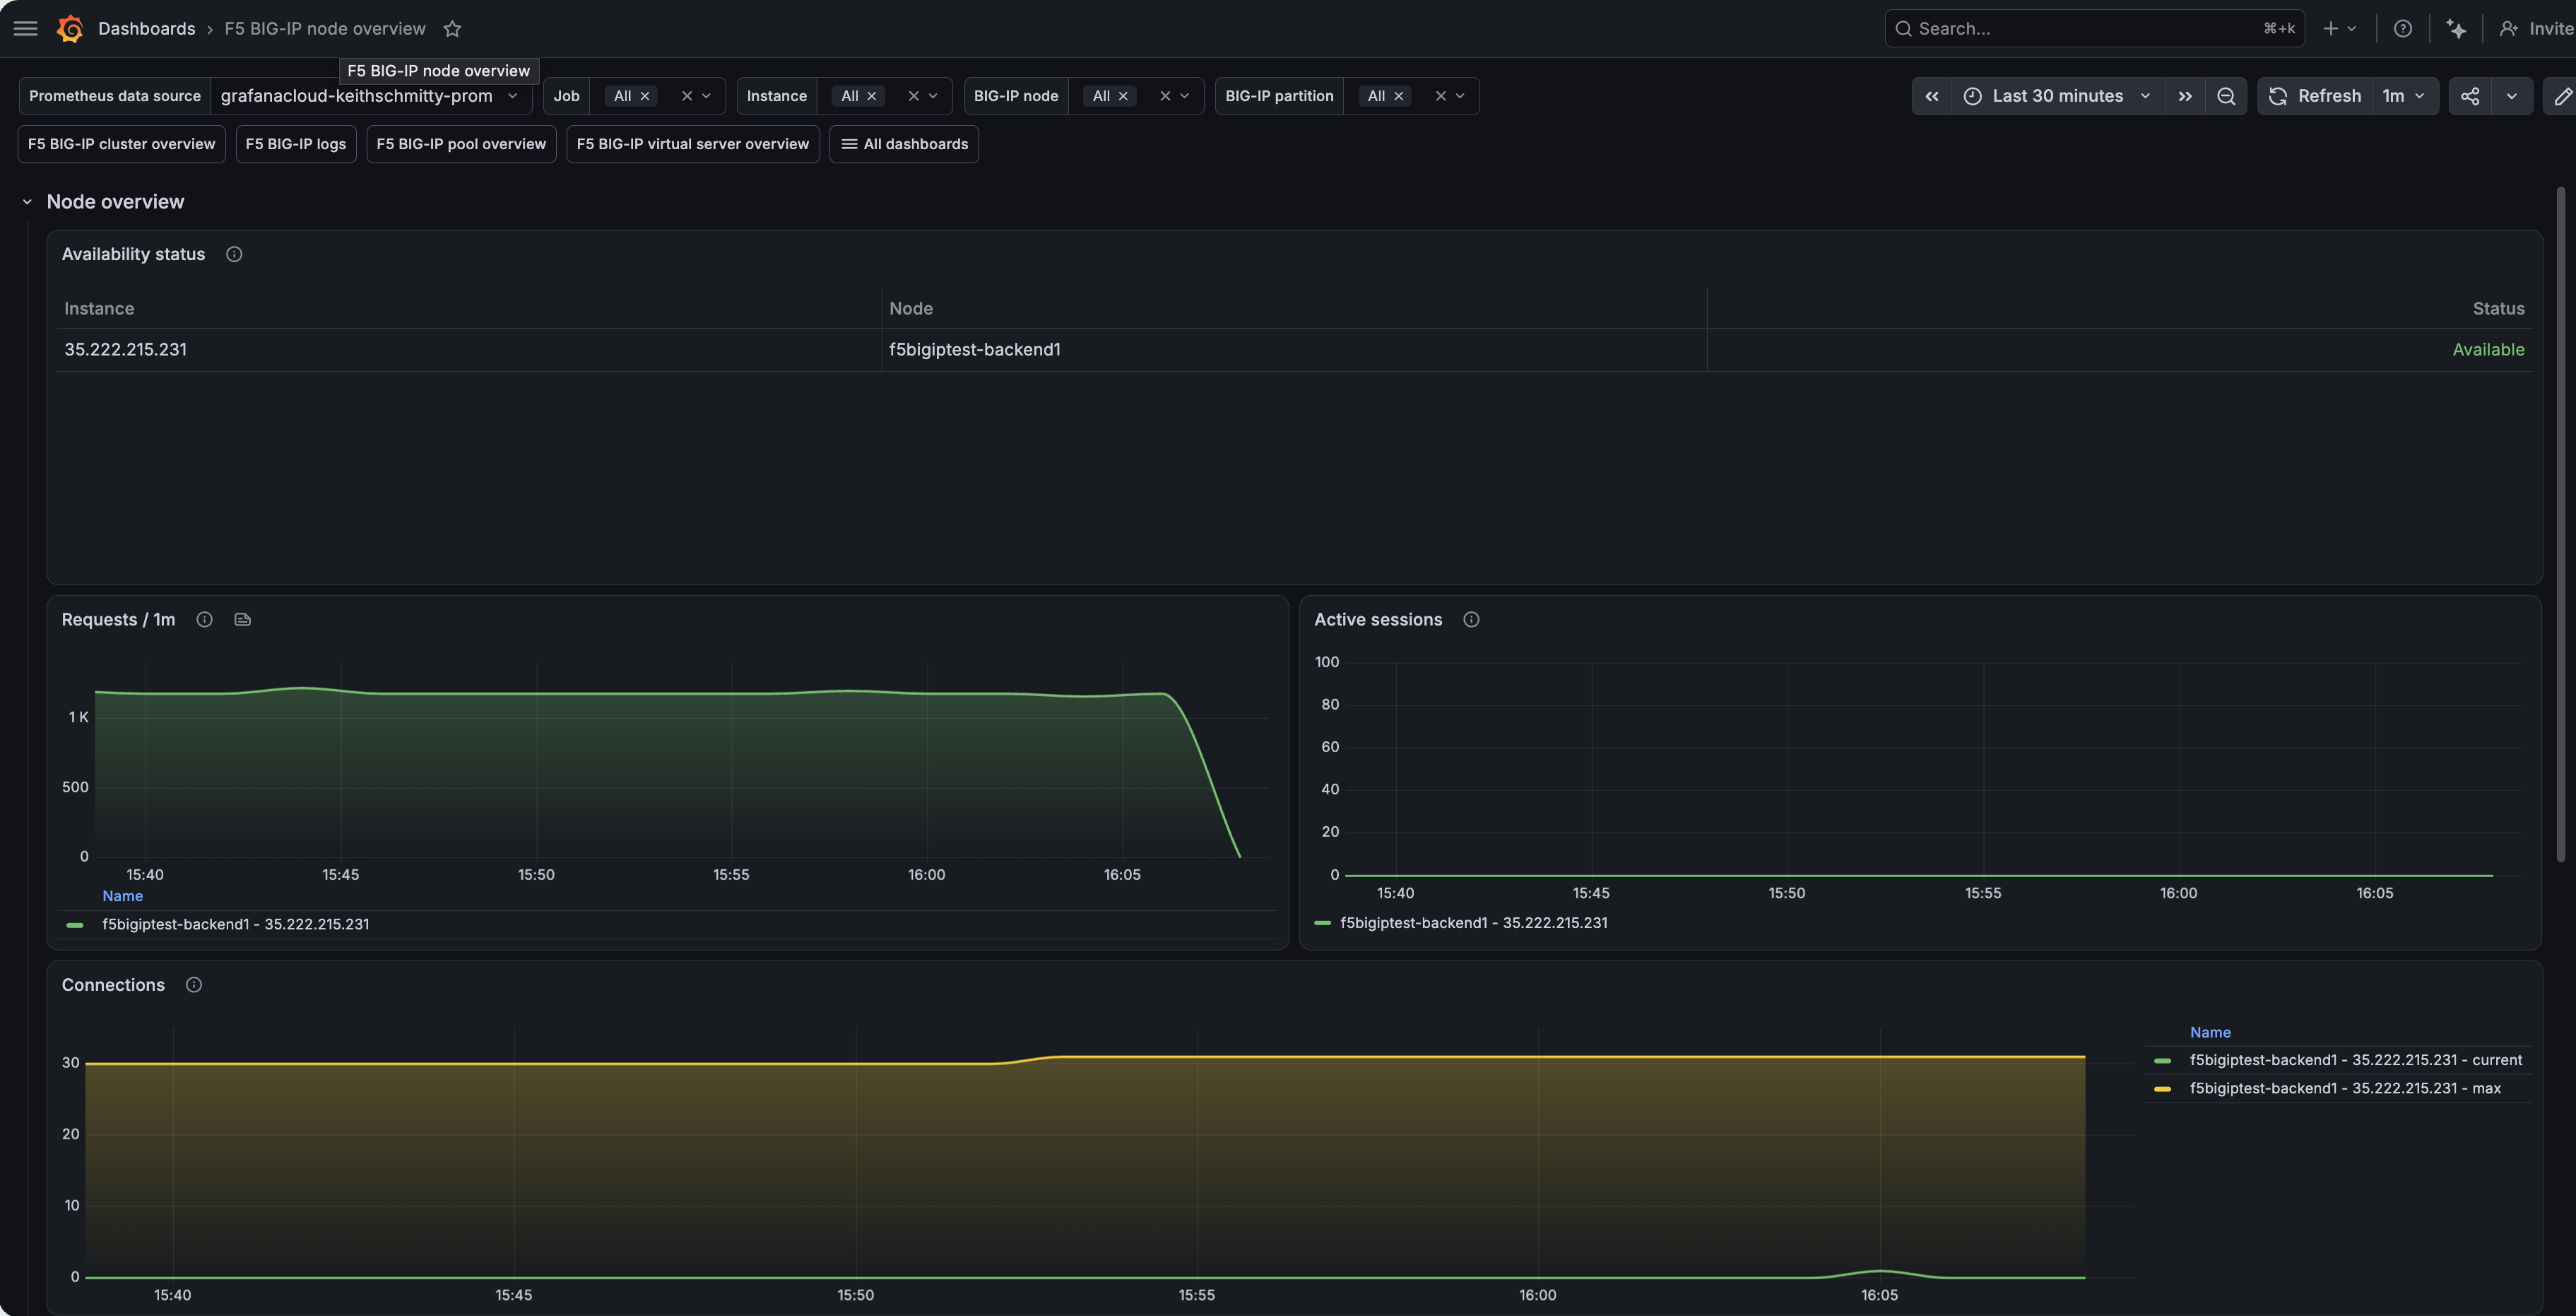
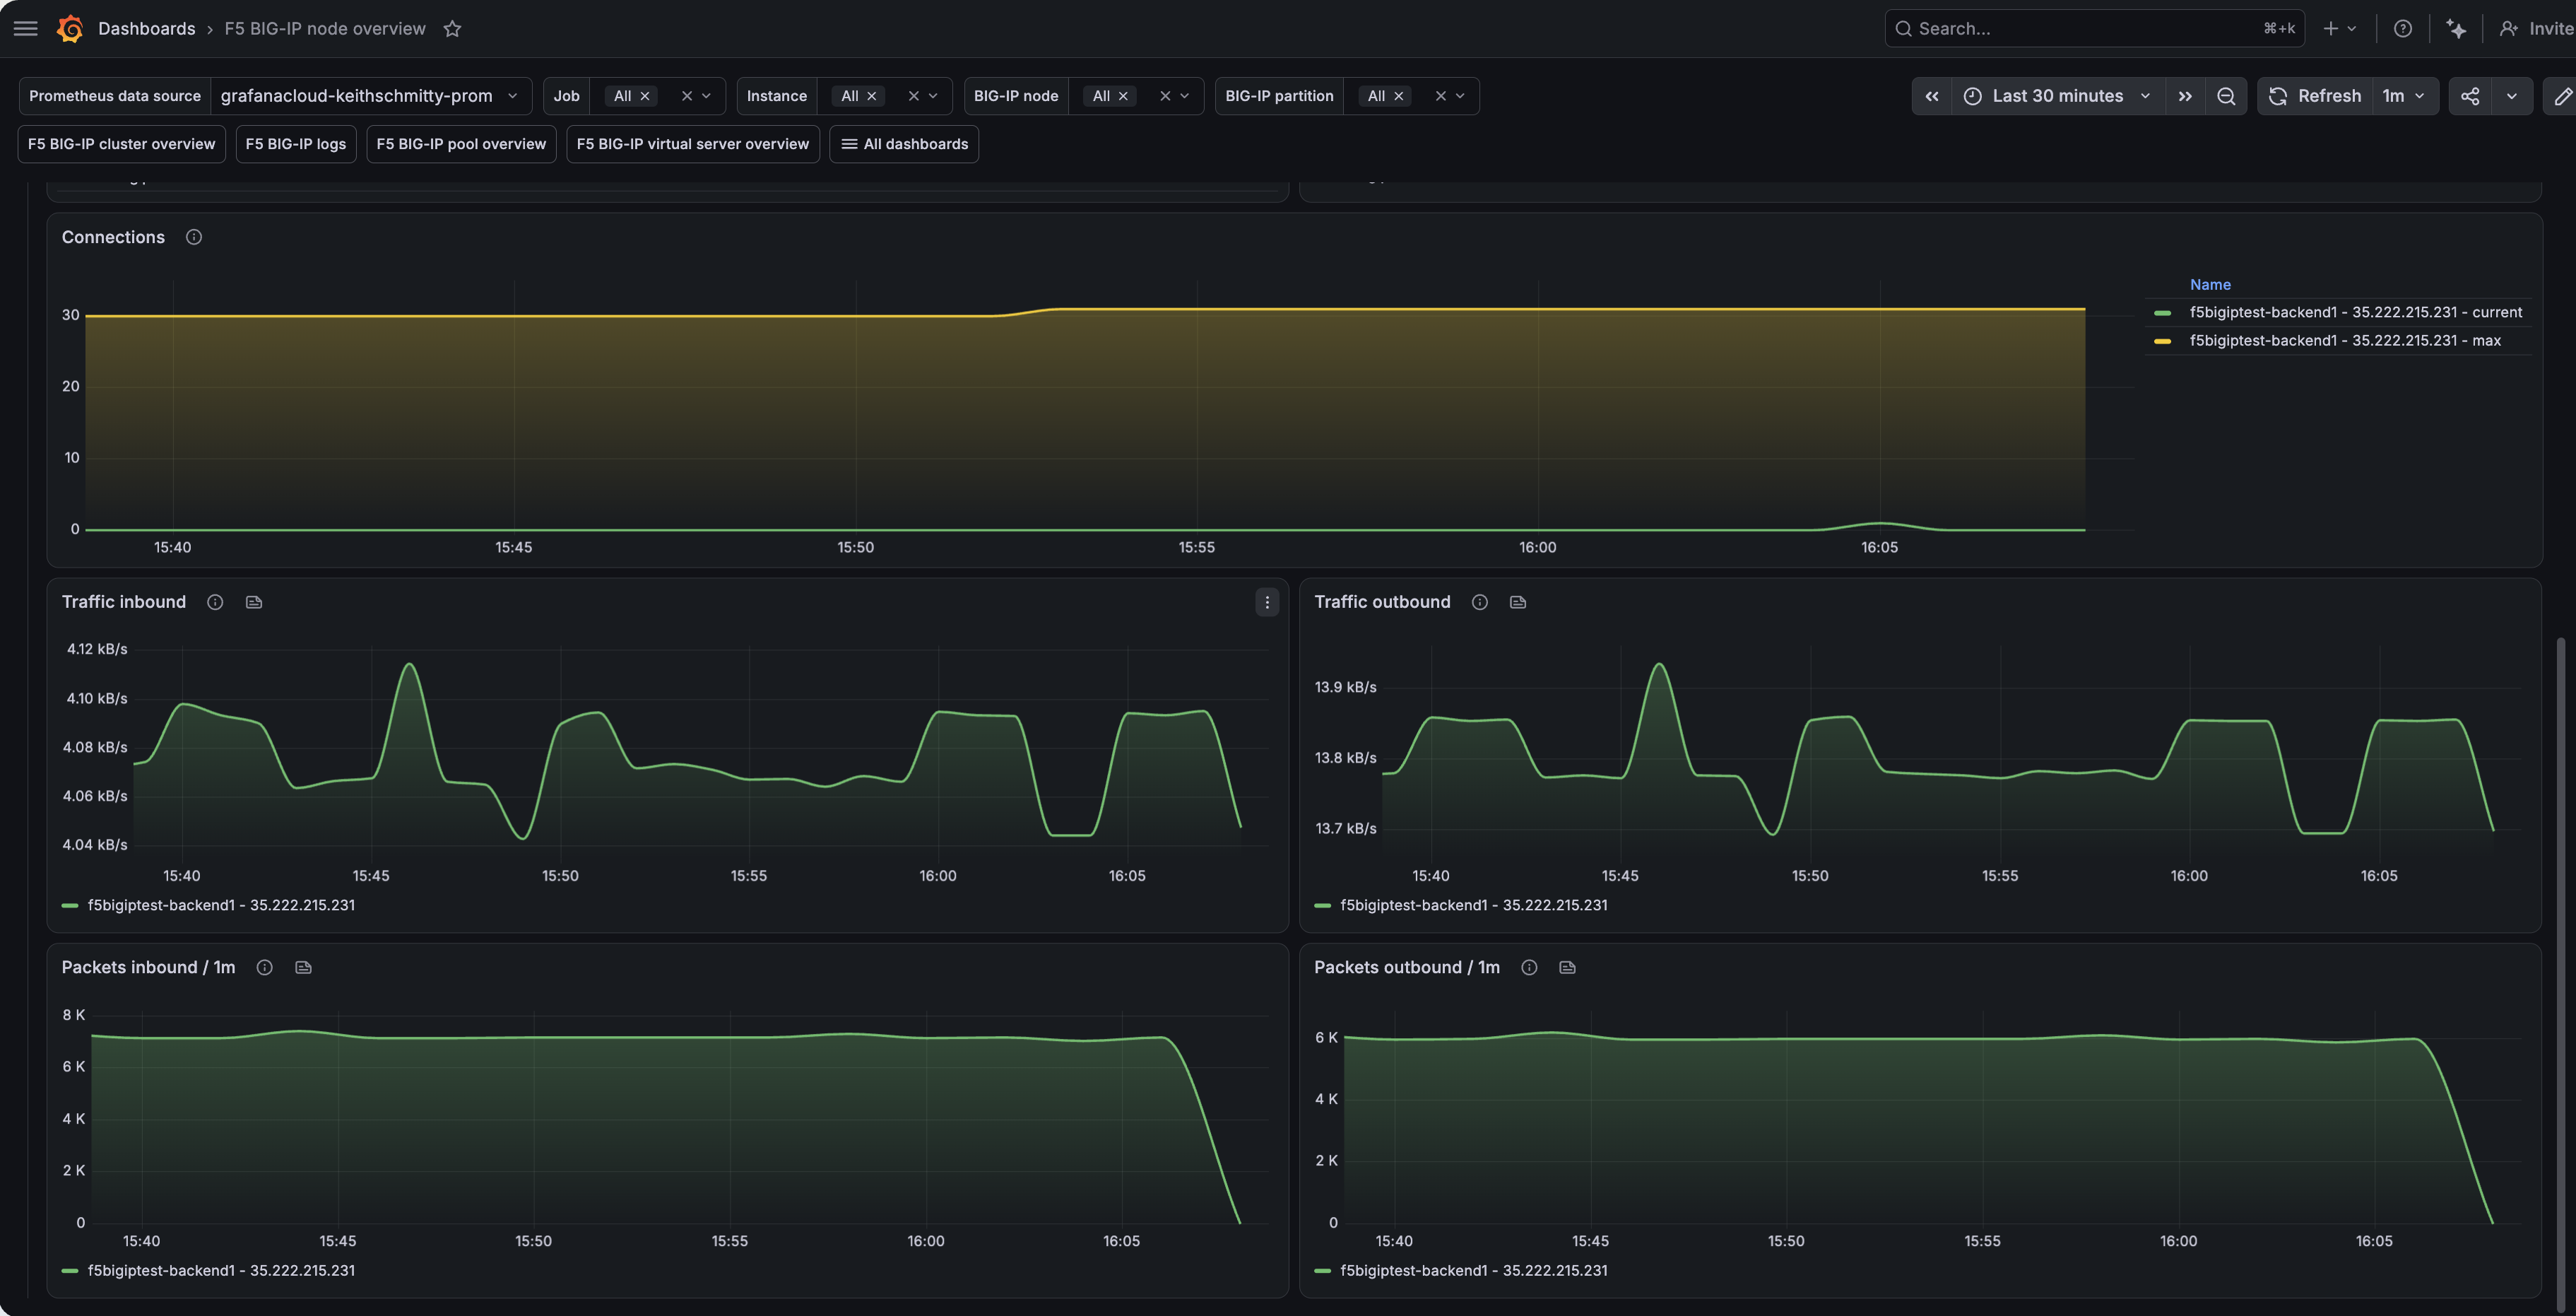
- BIG-IP node overview
- BIG-IP pool overview
- BIG-IP virtual server overview
F5 BIG-IP cluster overview
F5 BIG-IP node overview (1/2)
F5 BIG-IP node overview (2/2)
Alerts
The F5 BIG-IP integration includes the following useful alerts:
Metrics
The most important metrics provided by the F5 BIG-IP integration, which are used on the pre-built dashboards and Prometheus alerts, are as follows:
- bigip_node_cur_sessions
- bigip_node_serverside_bytes_in
- bigip_node_serverside_bytes_out
- bigip_node_serverside_cur_conns
- bigip_node_serverside_max_conns
- bigip_node_serverside_pkts_in
- bigip_node_serverside_pkts_out
- bigip_node_status_availability_state
- bigip_node_tot_requests
- bigip_pool_active_member_cnt
- bigip_pool_connq_depth
- bigip_pool_connq_serviced
- bigip_pool_min_active_members
- bigip_pool_serverside_bytes_in
- bigip_pool_serverside_bytes_out
- bigip_pool_serverside_cur_conns
- bigip_pool_serverside_max_conns
- bigip_pool_serverside_pkts_in
- bigip_pool_serverside_pkts_out
- bigip_pool_status_availability_state
- bigip_pool_tot_requests
- bigip_vs_clientside_bytes_in
- bigip_vs_clientside_bytes_out
- bigip_vs_clientside_cur_conns
- bigip_vs_clientside_evicted_conns
- bigip_vs_clientside_max_conns
- bigip_vs_clientside_pkts_in
- bigip_vs_clientside_pkts_out
- bigip_vs_cs_mean_conn_dur
- bigip_vs_ephemeral_bytes_in
- bigip_vs_ephemeral_bytes_out
- bigip_vs_ephemeral_cur_conns
- bigip_vs_ephemeral_evicted_conns
- bigip_vs_ephemeral_max_conns
- bigip_vs_ephemeral_pkts_in
- bigip_vs_ephemeral_pkts_out
- bigip_vs_status_availability_state
- bigip_vs_tot_requests
- up
Changelog
# 1.1.0 - June 2026

- Updated dashboards to follow new stylistic standards

# 1.0.2 - December 2024

- Only return latest metric in status panel check query
- Update mixin

# 1.0.1 - November 2024

- Update status panel check queries

# 1.0.0 - October 2023

* Initial release
Cost
By connecting your F5 BIG-IP instance to Grafana Cloud, you might incur charges. To view information on the number of active series that your Grafana Cloud account uses for metrics included in each Cloud tier, see Active series and dpm usage and Cloud tier pricing.


