Configure Spring Boot to generate Prometheus metrics
Spring Boot is a popular Java framework for building modern applications. With the help of the actuator module and the micrometer library, you can configure a Spring Boot application to expose performance metrics in the Prometheus format.
To configure Spring Boot to generate Prometheus metrics, complete the following steps.
Set up the actuator module to enable the management endpoints and set up the micrometer module to provide the Prometheus endpoint that exposes Prometheus metrics.
dependencies {
    implementation 'org.springframework.boot:spring-boot-starter-actuator',
    Implementation ‘io.micrometer:micrometer-registry-prometheus’
}
Enable the Prometheus endpoint in
application.properties`` orapplication.yml`.management.endpoint.prometheus.enabled=true management.endpoints.web.exposure.include=prometheusThe first line enables the endpoint that provides metrics in the Prometheus format. The second line tells Spring Boot to expose this endpoint as a Web API. You mighty have other endpoints listed here, such as
info,health, and so on.For more information, refer to Exposing Endpoints.
To determine that your setup is correct, access the
/actuator/prometheusendpoint of your web application, and verify that you see a list of metrics that look like the following example.jvm_memory_used_bytes{area="heap",id="PS Survivor Space",} 2.012508E7 … http_server_requests_seconds_count{exception="None",method="GET",outcome="SUCCESS",status="200",uri="/actuator/metrics",} 1.0 http_server_requests_seconds_sum{exception="None",method="GET",outcome="SUCCESS",status="200",uri="/actuator/metrics",} 0.084955379 … http_client_requests_seconds_count{clientName="chief.tsdb.dev.asserts.ai",method="POST",outcome="SUCCESS",status="200",uri="/select/0/prometheus/api/v1/query",} 4785.0 http_client_requests_seconds_sum{clientName="chief.tsdb.dev.asserts.ai",method="POST",outcome="SUCCESS",status="200",uri="/select/0/prometheus/api/v1/query",} 238.762194814 …The metrics shown usually include JVM, inbound HTTP requests, and outbound calls, among other metrics.
Optional setup to receive histogram metrics
By default, you only receive summary metrics. If you want the histogram metrics to calculate quantiles, enable them with following additional properties:
management.metrics.distribution.percentiles-histogram.http.server.requests=true
management.metrics.distribution.percentiles-histogram.http.client.requests=true
The first property enables the histogram for inbound requests, and the second property enables the histogram for outbound HTTP calls.
Note
Be aware histogram metrics can quickly increase the number of time series you receive, so enable them with caution.
Optional setup for custom instrumentation
Micrometer also provides annotations like @Timed and @Counted for you to monitor individual methods:
package ai.asserts.tasks;

@Bean
public class TimerTask {
    @Timed(description = "Time spent processing all tenants", histogram = true)
    public void run() {
        processAllTenants();
    }
    ...
}
These annotations produce method_timed_seconds metrics as Prometheus summary metrics and optionally histogram metrics if you set histogram = true.
method_timed_seconds_count{class="ai.asserts.tasks.TimerTask",exception="none",method="run",} 11.0
method_timed_seconds_sum{class="ai.asserts.tasks.TimerTask",exception="none",method="run",} 524.279248451
method_timed_seconds_bucket{class="ai.asserts.tasks.TimerTask",exception="none",method="run",le="0.001",} 0.0
…
Note
For these annotations to work, ensure the framework manages the object as a Java bean. If you are creating the preceding
TimerTaskobject with anewoperator, the@Timedannotation won’t work.
Cardinality considerations
JVM metrics are usually small, so you need to focus on the HTTP request metrics when considering how many metrics get published.
For summary metrics, one URI, status code combination has three series on its latency: count, sum, and max, but histogram metrics are much more. One combination might have 50~100 buckets, so if you have 20 URLs, you count 1000+ series per service instance. When the application reports status codes other than 200, such as 5xx or 4xx, then additional metrics are reported.
For inbound calls, the number of URIs usually matches the number of API endpoints your service provides. But for outbound calls, depending on how you customize your RestTemplate, URIs could contain query strings, which can cause a cardinality explosion. If you enable histogram for outbound calls, check the URIs and if necessary, fix the RestTemplate.
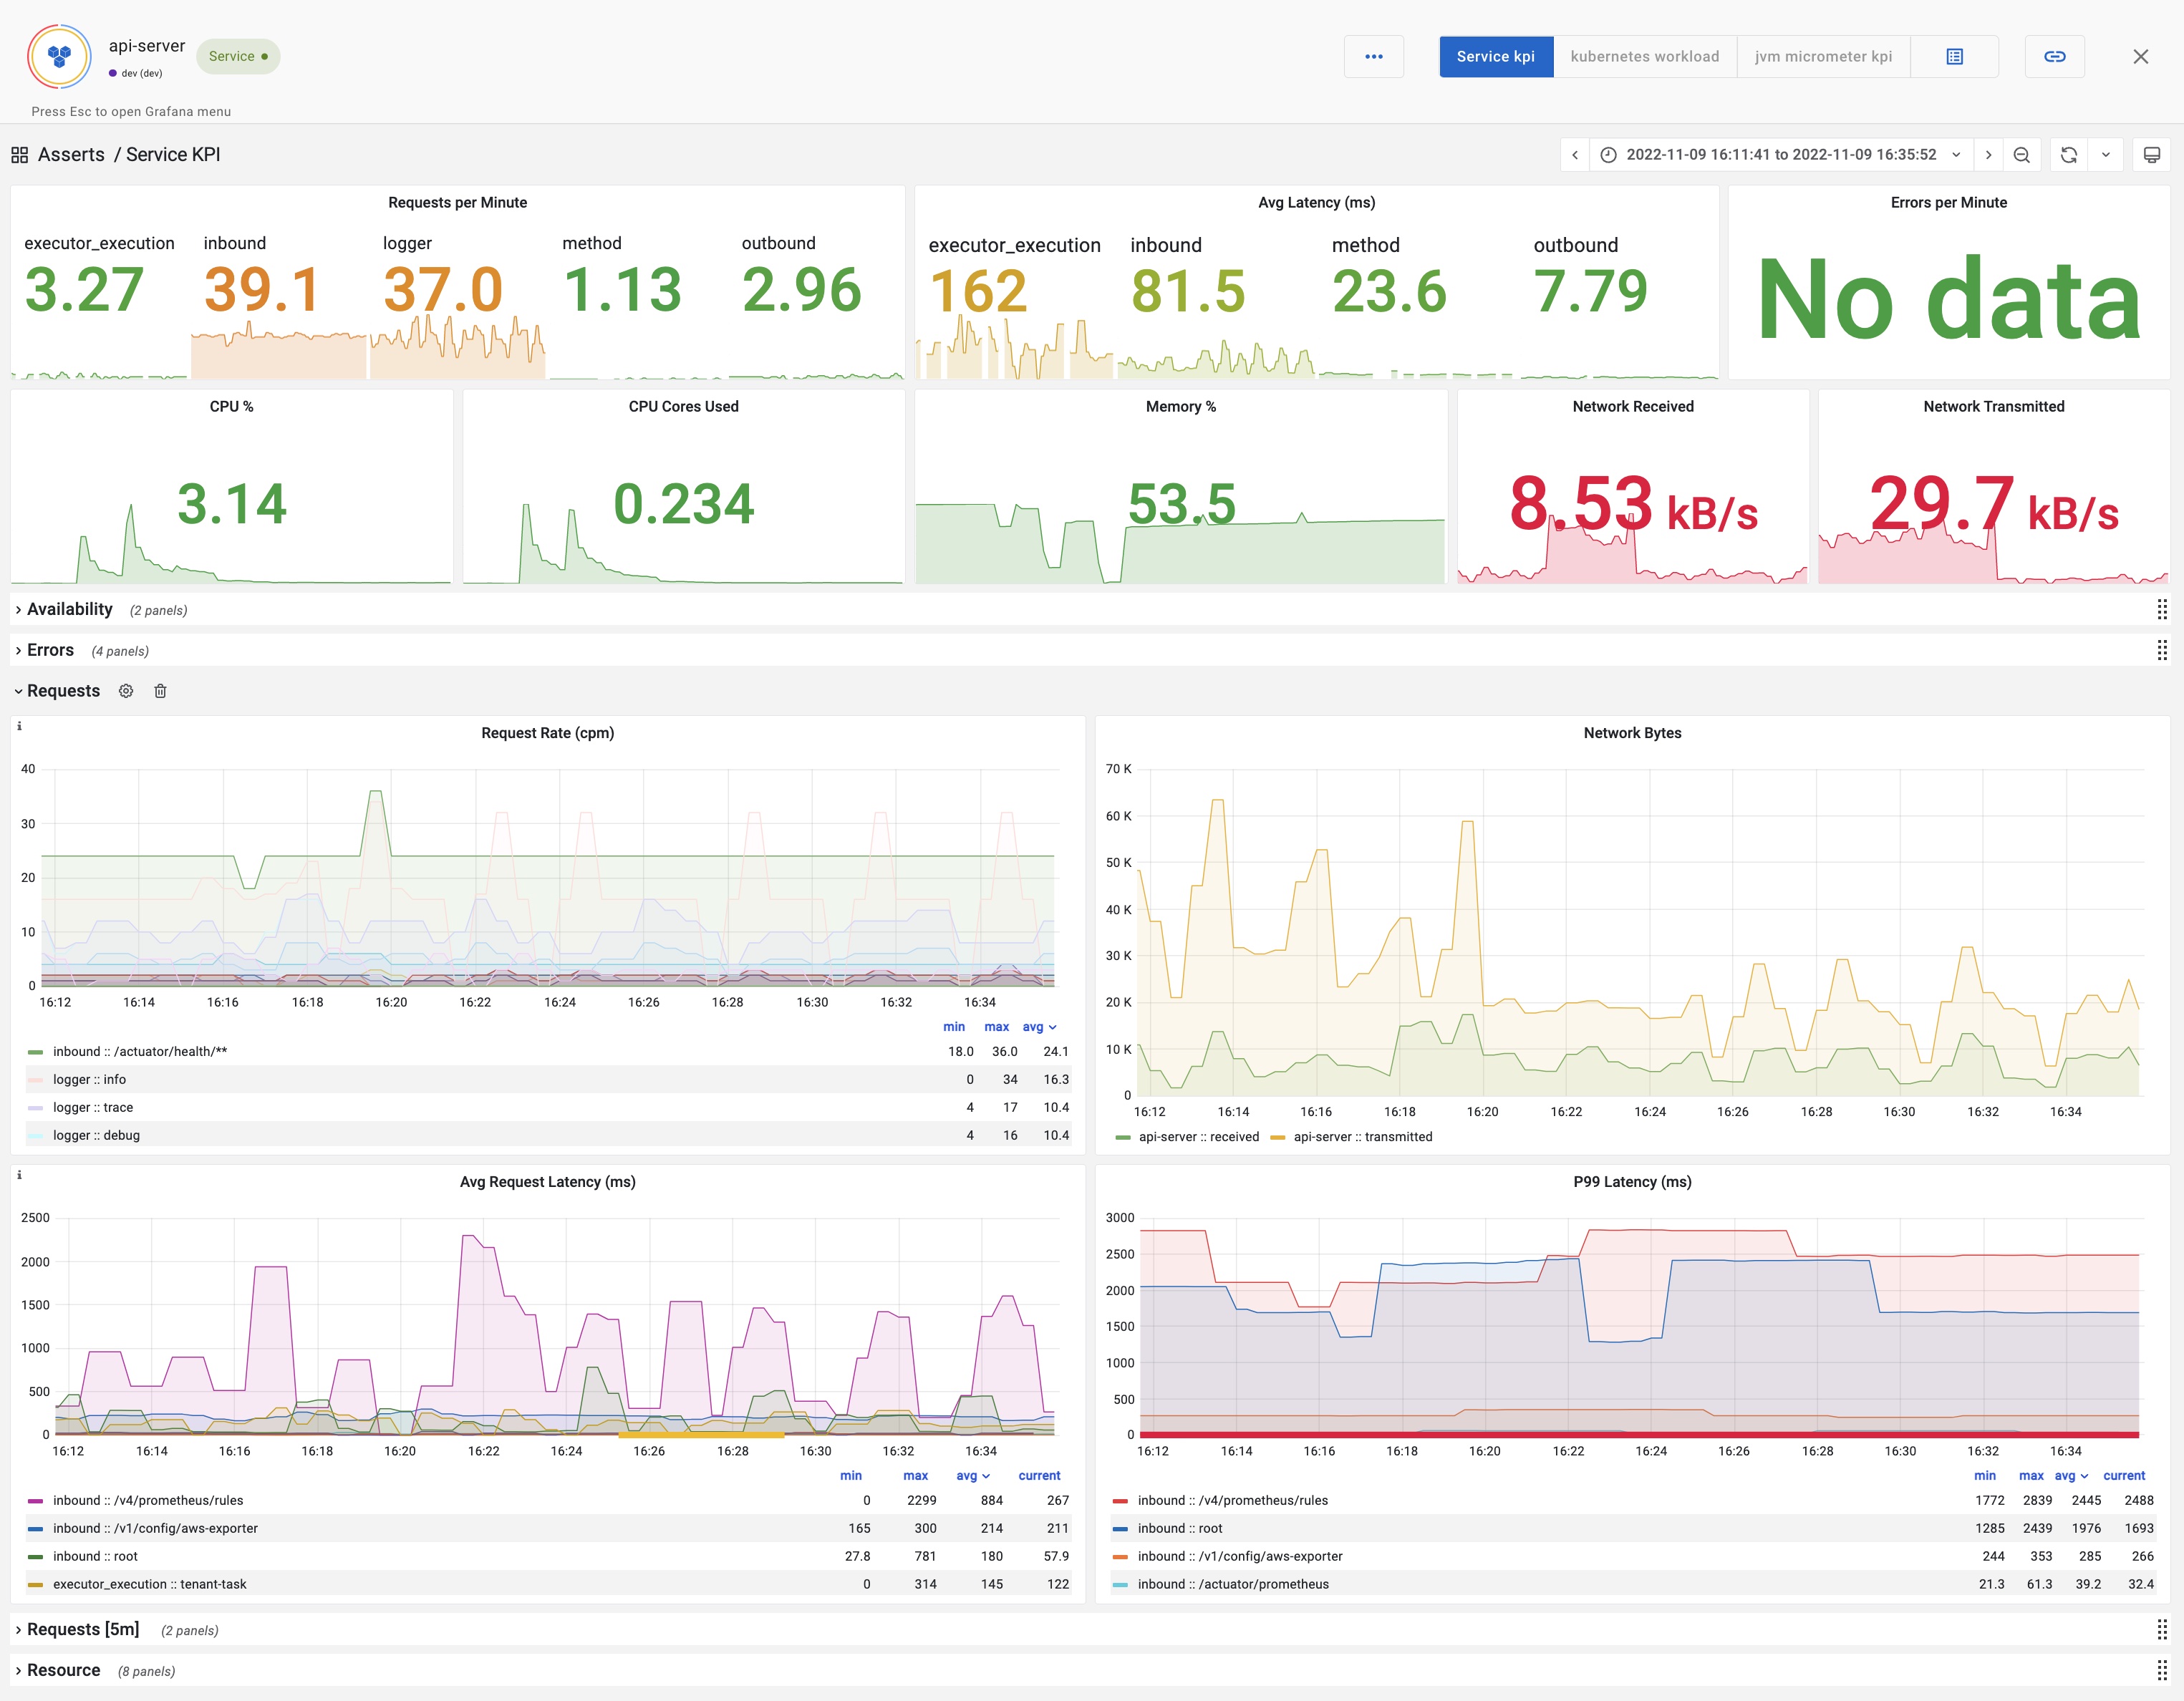
RED metric KPIs
The knowledge graph automatically tracks the following list of key performance indicators for Request, Error, and Duration (RED) metrics.
| Metric | |
|---|---|
Request Rate
| Request Counter http_server_requests_seconds_count |
Error Ratio - Inbound, Outbound and Method et al.
| Error Counter http_server_requests_seconds_count |
Latency - Inbound, Outbound, Method, Executor et al.
| Latency Histogram http_server_requests_seconds |
RED metrics alerts
The knowledge graph automatically tracks the short-term and long-term request and latency trends for Anomaly detection by URI and method names. Similarly, thresholds can be set for latency averages and P99 to record breaches. Error ratios are tracked against availability goals (default, 99.9%) and breaches (default, 10%).
| KPI | Alerts |
|---|---|
| Request Rate | RequestRateAnomaly - Inbound, Outbound, Method, Executor, Logger |
| Error Ratio | ErrorRatioBreach ErrorBuildup - availability goal 99.9 % |
Latency Average Latency P99 | LatencyAverageBreach LatencyAverageAnomaly LatencyP99ErrorBuildup |
| Error Log | ErrorLogRateBreach |
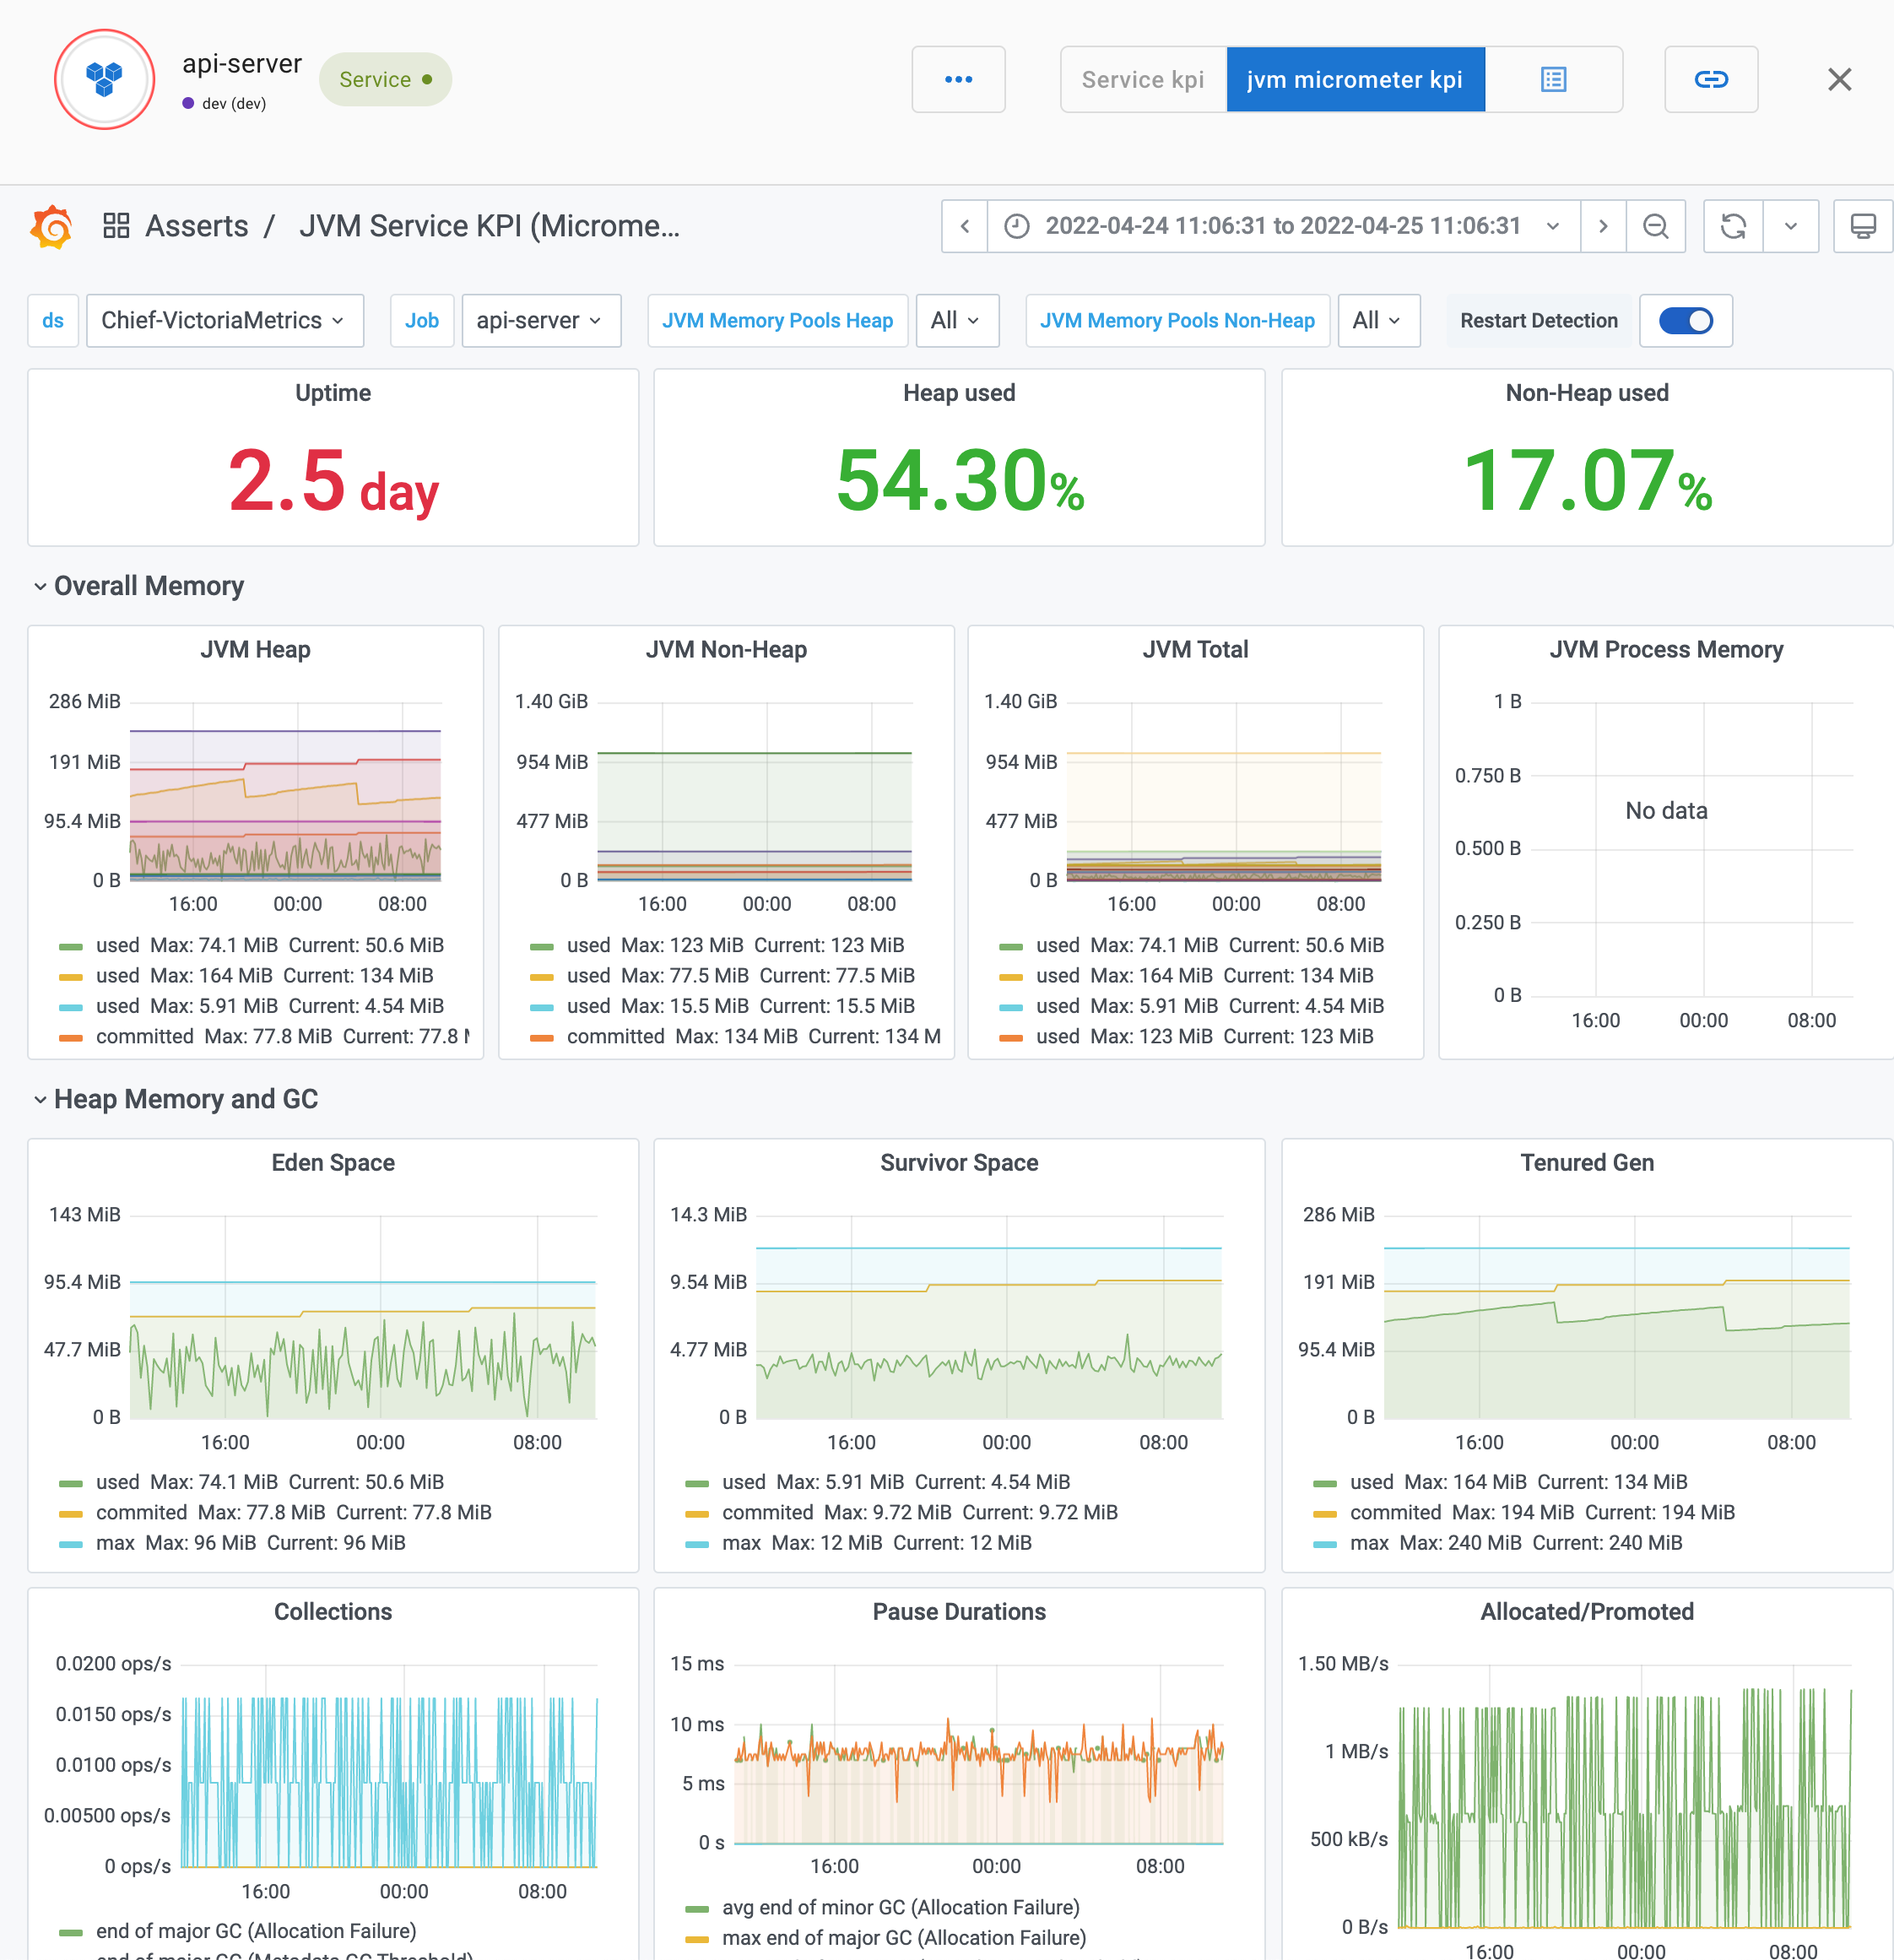
JVM GC alerts
The knowledge graph tracks the JVM GC Count and Time from micrometer metrics. You can tune these thresholds.
Service KPI dashboard
The knowledge graph aggregates data from Micrometer, cAdvisor, kubelet, and node-exporter to present a dashboard with the following KPIs:
- Request Rate
- Type: inbound, outbound, method, executor, logger, custom
- Context: URI, method name et al.
- Latency Average
- Latency P99
- Error Ratio and Error Rate
- CPU %
- CPU Cores Used
- CPU Throttle
- Memory %
- Memory Bytes
- Disk Usage
- Network Usage
JVM Micrometer KPI dashboard
The JVM Micrometer KPI dashboard includes the following KPIs:
- JVM memory
- CPU-Usage, Load, Threads, Thread States, File Descriptors, Log Events
- JVM Memory Pools (Heap, Non-Heap)
- Garbage Collection
- Classloading
- Direct-/Mapped-Buffer