PgBouncer integration for Grafana Cloud
PgBouncer is a lightweight connection pooler for PostgreSQL databases. It reduces the processing time and resources required by managing a pool of connections to the database server, allowing applications to share a limited number of connections more efficiently.
This integration includes 4 useful alerts and 3 pre-built dashboards to help monitor and visualize PgBouncer metrics and logs.
Before you begin
PgBouncer
For the exporter to work with PgBouncer, the pgbouncer.ini config file needs to have the additional line ignore_startup_parameters = extra_float_digits appended to it. Once this additional line is added, the PgBouncer service must be restarted to take effect.
PgBouncer Prometheus exporter
This integration supports metrics and logs from a PgBouncer instance. It is configured to work with the PgBouncer Prometheus Exporter, which must be installed and configured separately from Grafana Alloy.
The exporter must be built before running using make build. The exporter itself can then be run using ./pgbouncer_exporter. The exporter can be tested by checking the default metrics endpoint of http://localhost:9127/metrics.
PgBouncer logs
PgBouncer does not send logs to a file by default, the user must enable this by adding an additional setting in the pgbouncer.ini file. An example configuration may look like this: logfile = /var/log/postgresql/pgbouncer.log.
The path to the log file that is customized in pgbouncer.ini must be the same as the path to the logs that is set in the Alloy config.
Install PgBouncer integration for Grafana Cloud
- In your Grafana Cloud stack, click Connections in the left-hand menu.
- Find PgBouncer and click its tile to open the integration.
- Review the prerequisites in the Configuration Details tab and set up Grafana Alloy to send PgBouncer metrics and logs to your Grafana Cloud instance.
- Click Install to add this integration’s pre-built dashboards and alerts to your Grafana Cloud instance, and you can start monitoring your PgBouncer setup.
Configuration snippets for Grafana Alloy
Simple mode
These snippets are configured to scrape a single PgBouncer instance running locally with default ports.
First, manually copy and append the following snippets into your alloy configuration file.
Logs snippets
darwin
local.file_match "logs_integrations_integrations_pgbouncer" {
	path_targets = [{
		__address__       = "localhost",
		__path__          = "<path-to-user-set-pgbouncer-log>/pgbouncer.log",
		instance          = "<your-instance-name>:9127",
		job               = "integrations/pgbouncer",
		pgbouncer_cluster = "<your-pgbouncer-cluster-name>",
	}]
}

loki.process "logs_integrations_integrations_pgbouncer" {
	forward_to = []

	stage.multiline {
		firstline     = "\\d{4}-\\d{2}-\\d{2} \\d{2}:\\d{2}:\\d{2}\\.\\d{3}"
		max_lines     = 0
		max_wait_time = "3s"
	}

	stage.regex {
		expression = "\\d{4}-\\d{2}-\\d{2} \\d{2}:\\d{2}:\\d{2}\\.\\d{3} \\w+ \\[\\d+\\] (?P<level>LOG|ERROR|WARNING|INFO|DEBUG) .*"
	}

	stage.labels {
		values = {
			level = null,
		}
	}
}

loki.source.file "logs_integrations_integrations_pgbouncer" {
	targets    = local.file_match.logs_integrations_integrations_pgbouncer.targets
	forward_to = [loki.process.logs_integrations_integrations_pgbouncer.receiver]
}
linux
local.file_match "logs_integrations_integrations_pgbouncer" {
	path_targets = [{
		__address__       = "localhost",
		__path__          = "<path-to-user-set-pgbouncer-log>/pgbouncer.log",
		instance          = "<your-instance-name>:9127",
		job               = "integrations/pgbouncer",
		pgbouncer_cluster = "<your-pgbouncer-cluster-name>",
	}]
}

loki.process "logs_integrations_integrations_pgbouncer" {
	forward_to = []

	stage.multiline {
		firstline     = "\\d{4}-\\d{2}-\\d{2} \\d{2}:\\d{2}:\\d{2}\\.\\d{3}"
		max_lines     = 0
		max_wait_time = "3s"
	}

	stage.regex {
		expression = "\\d{4}-\\d{2}-\\d{2} \\d{2}:\\d{2}:\\d{2}\\.\\d{3} \\w+ \\[\\d+\\] (?P<level>LOG|ERROR|WARNING|INFO|DEBUG) .*"
	}

	stage.labels {
		values = {
			level = null,
		}
	}
}

loki.source.file "logs_integrations_integrations_pgbouncer" {
	targets    = local.file_match.logs_integrations_integrations_pgbouncer.targets
	forward_to = [loki.process.logs_integrations_integrations_pgbouncer.receiver]
}
windows
local.file_match "logs_integrations_integrations_pgbouncer" {
	path_targets = [{
		__address__       = "localhost",
		__path__          = "<path-to-user-set-pgbouncer-log>/pgbouncer.log",
		instance          = "<your-instance-name>:9127",
		job               = "integrations/pgbouncer",
		pgbouncer_cluster = "<your-pgbouncer-cluster-name>",
	}]
}

loki.process "logs_integrations_integrations_pgbouncer" {
	forward_to = []

	stage.multiline {
		firstline     = "\\d{4}-\\d{2}-\\d{2} \\d{2}:\\d{2}:\\d{2}\\.\\d{3}"
		max_lines     = 0
		max_wait_time = "3s"
	}

	stage.regex {
		expression = "\\d{4}-\\d{2}-\\d{2} \\d{2}:\\d{2}:\\d{2}\\.\\d{3} \\w+ \\[\\d+\\] (?P<level>LOG|ERROR|WARNING|INFO|DEBUG) .*"
	}

	stage.labels {
		values = {
			level = null,
		}
	}
}

loki.source.file "logs_integrations_integrations_pgbouncer" {
	targets    = local.file_match.logs_integrations_integrations_pgbouncer.targets
	forward_to = [loki.process.logs_integrations_integrations_pgbouncer.receiver]
}
Advanced mode
The following snippets provide examples to guide you through the configuration process.
To instruct Grafana Alloy to scrape your PgBouncer instances, manually copy and append the snippets to your alloy configuration file, then follow subsequent instructions.
Advanced metrics snippets
prometheus.scrape "metrics_integrations_integrations_pgbouncer" {
	targets = [{
		__address__       = "constants.hostname:9127",
		pgbouncer_cluster = "<your-pgbouncer-cluster-name>",
	}]
	forward_to = [prometheus.remote_write.metrics_service.receiver]
	job_name   = "integrations/pgbouncer"
}
To monitor your PgBouncer instance, you must use a discovery.relabel component to discover your PgBouncer Prometheus endpoint and apply appropriate labels, followed by a prometheus.scrape component to scrape it.
Configure the following properties within each discovery.relabel component:
__address__: The address to your PgBouncer Prometheus metrics endpoint.instancelabel:constants.hostnamesets theinstancelabel to your Grafana Alloy server hostname. If that is not suitable, change it to a value uniquely identifies this PgBouncer instance. Make sure this label value is the same for all telemetry data collected for this instance.
If you have multiple PgBouncer servers to scrape, configure one discovery.relabel for each and scrape them by including each under targets within the prometheus.scrape component.
Advanced logs snippets
darwin
local.file_match "logs_integrations_integrations_pgbouncer" {
	path_targets = [{
		__address__       = "localhost",
		__path__          = "<path-to-user-set-pgbouncer-log>/pgbouncer.log",
		instance          = "<your-instance-name>:9127",
		job               = "integrations/pgbouncer",
		pgbouncer_cluster = "<your-pgbouncer-cluster-name>",
	}]
}

loki.process "logs_integrations_integrations_pgbouncer" {
	forward_to = []

	stage.multiline {
		firstline     = "\\d{4}-\\d{2}-\\d{2} \\d{2}:\\d{2}:\\d{2}\\.\\d{3}"
		max_lines     = 0
		max_wait_time = "3s"
	}

	stage.regex {
		expression = "\\d{4}-\\d{2}-\\d{2} \\d{2}:\\d{2}:\\d{2}\\.\\d{3} \\w+ \\[\\d+\\] (?P<level>LOG|ERROR|WARNING|INFO|DEBUG) .*"
	}

	stage.labels {
		values = {
			level = null,
		}
	}
}

loki.source.file "logs_integrations_integrations_pgbouncer" {
	targets    = local.file_match.logs_integrations_integrations_pgbouncer.targets
	forward_to = [loki.process.logs_integrations_integrations_pgbouncer.receiver]
}
To monitor your PgBouncer instance logs, you will use a combination of the following components:
local.file_match defines where to find the log file to be scraped. Change the following properties according to your environment:
__address__: The PgBouncer instance address__path__: The path to the log file.instancelabel:constants.hostnamesets theinstancelabel to your Grafana Alloy server hostname. If that is not suitable, change it to a value uniquely identifies this PgBouncer instance. Make sure this label value is the same for all telemetry data collected for this instance.
loki.process defines how to process logs before sending it to Loki.
loki.source.file sends logs to Loki.
linux
local.file_match "logs_integrations_integrations_pgbouncer" {
	path_targets = [{
		__address__       = "localhost",
		__path__          = "<path-to-user-set-pgbouncer-log>/pgbouncer.log",
		instance          = "<your-instance-name>:9127",
		job               = "integrations/pgbouncer",
		pgbouncer_cluster = "<your-pgbouncer-cluster-name>",
	}]
}

loki.process "logs_integrations_integrations_pgbouncer" {
	forward_to = []

	stage.multiline {
		firstline     = "\\d{4}-\\d{2}-\\d{2} \\d{2}:\\d{2}:\\d{2}\\.\\d{3}"
		max_lines     = 0
		max_wait_time = "3s"
	}

	stage.regex {
		expression = "\\d{4}-\\d{2}-\\d{2} \\d{2}:\\d{2}:\\d{2}\\.\\d{3} \\w+ \\[\\d+\\] (?P<level>LOG|ERROR|WARNING|INFO|DEBUG) .*"
	}

	stage.labels {
		values = {
			level = null,
		}
	}
}

loki.source.file "logs_integrations_integrations_pgbouncer" {
	targets    = local.file_match.logs_integrations_integrations_pgbouncer.targets
	forward_to = [loki.process.logs_integrations_integrations_pgbouncer.receiver]
}
To monitor your PgBouncer instance logs, you will use a combination of the following components:
local.file_match defines where to find the log file to be scraped. Change the following properties according to your environment:
__address__: The PgBouncer instance address__path__: The path to the log file.instancelabel:constants.hostnamesets theinstancelabel to your Grafana Alloy server hostname. If that is not suitable, change it to a value uniquely identifies this PgBouncer instance. Make sure this label value is the same for all telemetry data collected for this instance.
loki.process defines how to process logs before sending it to Loki.
loki.source.file sends logs to Loki.
windows
local.file_match "logs_integrations_integrations_pgbouncer" {
	path_targets = [{
		__address__       = "localhost",
		__path__          = "<path-to-user-set-pgbouncer-log>/pgbouncer.log",
		instance          = "<your-instance-name>:9127",
		job               = "integrations/pgbouncer",
		pgbouncer_cluster = "<your-pgbouncer-cluster-name>",
	}]
}

loki.process "logs_integrations_integrations_pgbouncer" {
	forward_to = []

	stage.multiline {
		firstline     = "\\d{4}-\\d{2}-\\d{2} \\d{2}:\\d{2}:\\d{2}\\.\\d{3}"
		max_lines     = 0
		max_wait_time = "3s"
	}

	stage.regex {
		expression = "\\d{4}-\\d{2}-\\d{2} \\d{2}:\\d{2}:\\d{2}\\.\\d{3} \\w+ \\[\\d+\\] (?P<level>LOG|ERROR|WARNING|INFO|DEBUG) .*"
	}

	stage.labels {
		values = {
			level = null,
		}
	}
}

loki.source.file "logs_integrations_integrations_pgbouncer" {
	targets    = local.file_match.logs_integrations_integrations_pgbouncer.targets
	forward_to = [loki.process.logs_integrations_integrations_pgbouncer.receiver]
}
To monitor your PgBouncer instance logs, you will use a combination of the following components:
local.file_match defines where to find the log file to be scraped. Change the following properties according to your environment:
__address__: The PgBouncer instance address__path__: The path to the log file.instancelabel:constants.hostnamesets theinstancelabel to your Grafana Alloy server hostname. If that is not suitable, change it to a value uniquely identifies this PgBouncer instance. Make sure this label value is the same for all telemetry data collected for this instance.
loki.process defines how to process logs before sending it to Loki.
loki.source.file sends logs to Loki.
Kubernetes instructions
Before you begin with Kubernetes
Please note: These instructions assume the use of the Kubernetes Monitoring Helm chart
For the exporter to work with PgBouncer, the pgbouncer.ini config file needs to have the additional line ignore_startup_parameters = extra_float_digits appended to it. Once this additional line is added, the PgBouncer service must be restarted to take effect.
PgBouncer Prometheus exporter
This integration supports metrics and logs from a PgBouncer instance. It is configured to work with the PgBouncer Prometheus Exporter, which must be built and deployed with the PgBouncer pods.
The exporter must be built before running using make build. The exporter itself can then be run using ./pgbouncer_exporter. The exporter can be tested by checking the default metrics endpoint of http://localhost:9127/metrics.
PgBouncer logs
PgBouncer does not send logs to a file by default, the user must enable this by adding an additional setting in the pgbouncer.ini file. An example configuration may look like this: logfile = /var/log/postgresql/pgbouncer.log.
The path to the log file that is customized in pgbouncer.ini must be the same as the path to the logs that is set in the agent config.
Configuration snippets for Kubernetes Helm chart
The following snippets provide examples to guide you through the configuration process.
To scrape your PgBouncer instances, manually modify your Kubernetes Monitoring Helm chart with these configuration snippets.
Replace any values between the angle brackets <> in the provided snippets with your desired configuration values.
Metrics snippets
alloy-metrics:
    extraConfig: |-
        discovery.kubernetes "pgbouncer" {
            role = "pod"
            selectors {
                role = "pod"
                label = "app.kubernetes.io/name=pgbouncer"
            }
        }

        discovery.relabel "pgbouncer" {
        targets = discovery.kubernetes.pgbouncer.targets
            rule {
                source_labels = ["__meta_kubernetes_pod_container_port_number"]
                regex = "<pgbouncer_prometheus_port_number>"
                action = "keep"
            }
            rule {
                target_label = "pgbouncer_cluster"
                replacement = "<pgbouncer_cluster_label>"
            }
            rule {
                source_labels = ["__meta_kubernetes_namespace", "__meta_kubernetes_pod_container_name"]
                separator = "-"
                target_label = "instance"
            }
        }

        prometheus.scrape "pgbouncer" {
            targets      = discovery.relabel.pgbouncer.output
            metrics_path = "/metrics"
            job_name     = "integrations/pgbouncer"
            forward_to   = [prometheus.remote_write.grafana_cloud_metrics.receiver]
        }
Logs snippets
podLogs:
    extraDiscoveryRules: |-
        rule {
            source_labels = ["__meta_kubernetes_pod_label_app_kubernetes_io_name"]
            regex         = "pgbouncer"
            replacement   = "pgbouncer"
            target_label  = "integration"
        }

    extraLogProcessingStages: |-
        stage.match {
            selector = "{integration=\\"pgbouncer\\"}"

            stage.drop {
                expression = "^ts"
            }
            stage.multiline {
                firstline = \`\\d{4}-\\d{2}-\\d{2} \\d{2}:\\d{2}:\\d{2}\\.\\d{3}\`
            }
            stage.regex {
                expression = \`\\d{4}-\\d{2}-\\d{2} \\d{2}:\\d{2}:\\d{2}\\.\\d{3} \\w+ \\[\\d+\\] (?P<level>LOG|ERROR|WARNING|INFO|DEBUG) .*\`
            }
            stage.template {
                source   = "instance"
                template = "{{ .namespace }}-{{ .container }}"
            }
            stage.labels {
                values = {
                    level  = "",
                }
            }
            stage.static_labels {
                values = {
                    job = "integrations/pgbouncer",
                }
            }
        }
Dashboards
The PgBouncer integration installs the following dashboards in your Grafana Cloud instance to help monitor your system.
- PgBouncer cluster overview
- PgBouncer logs
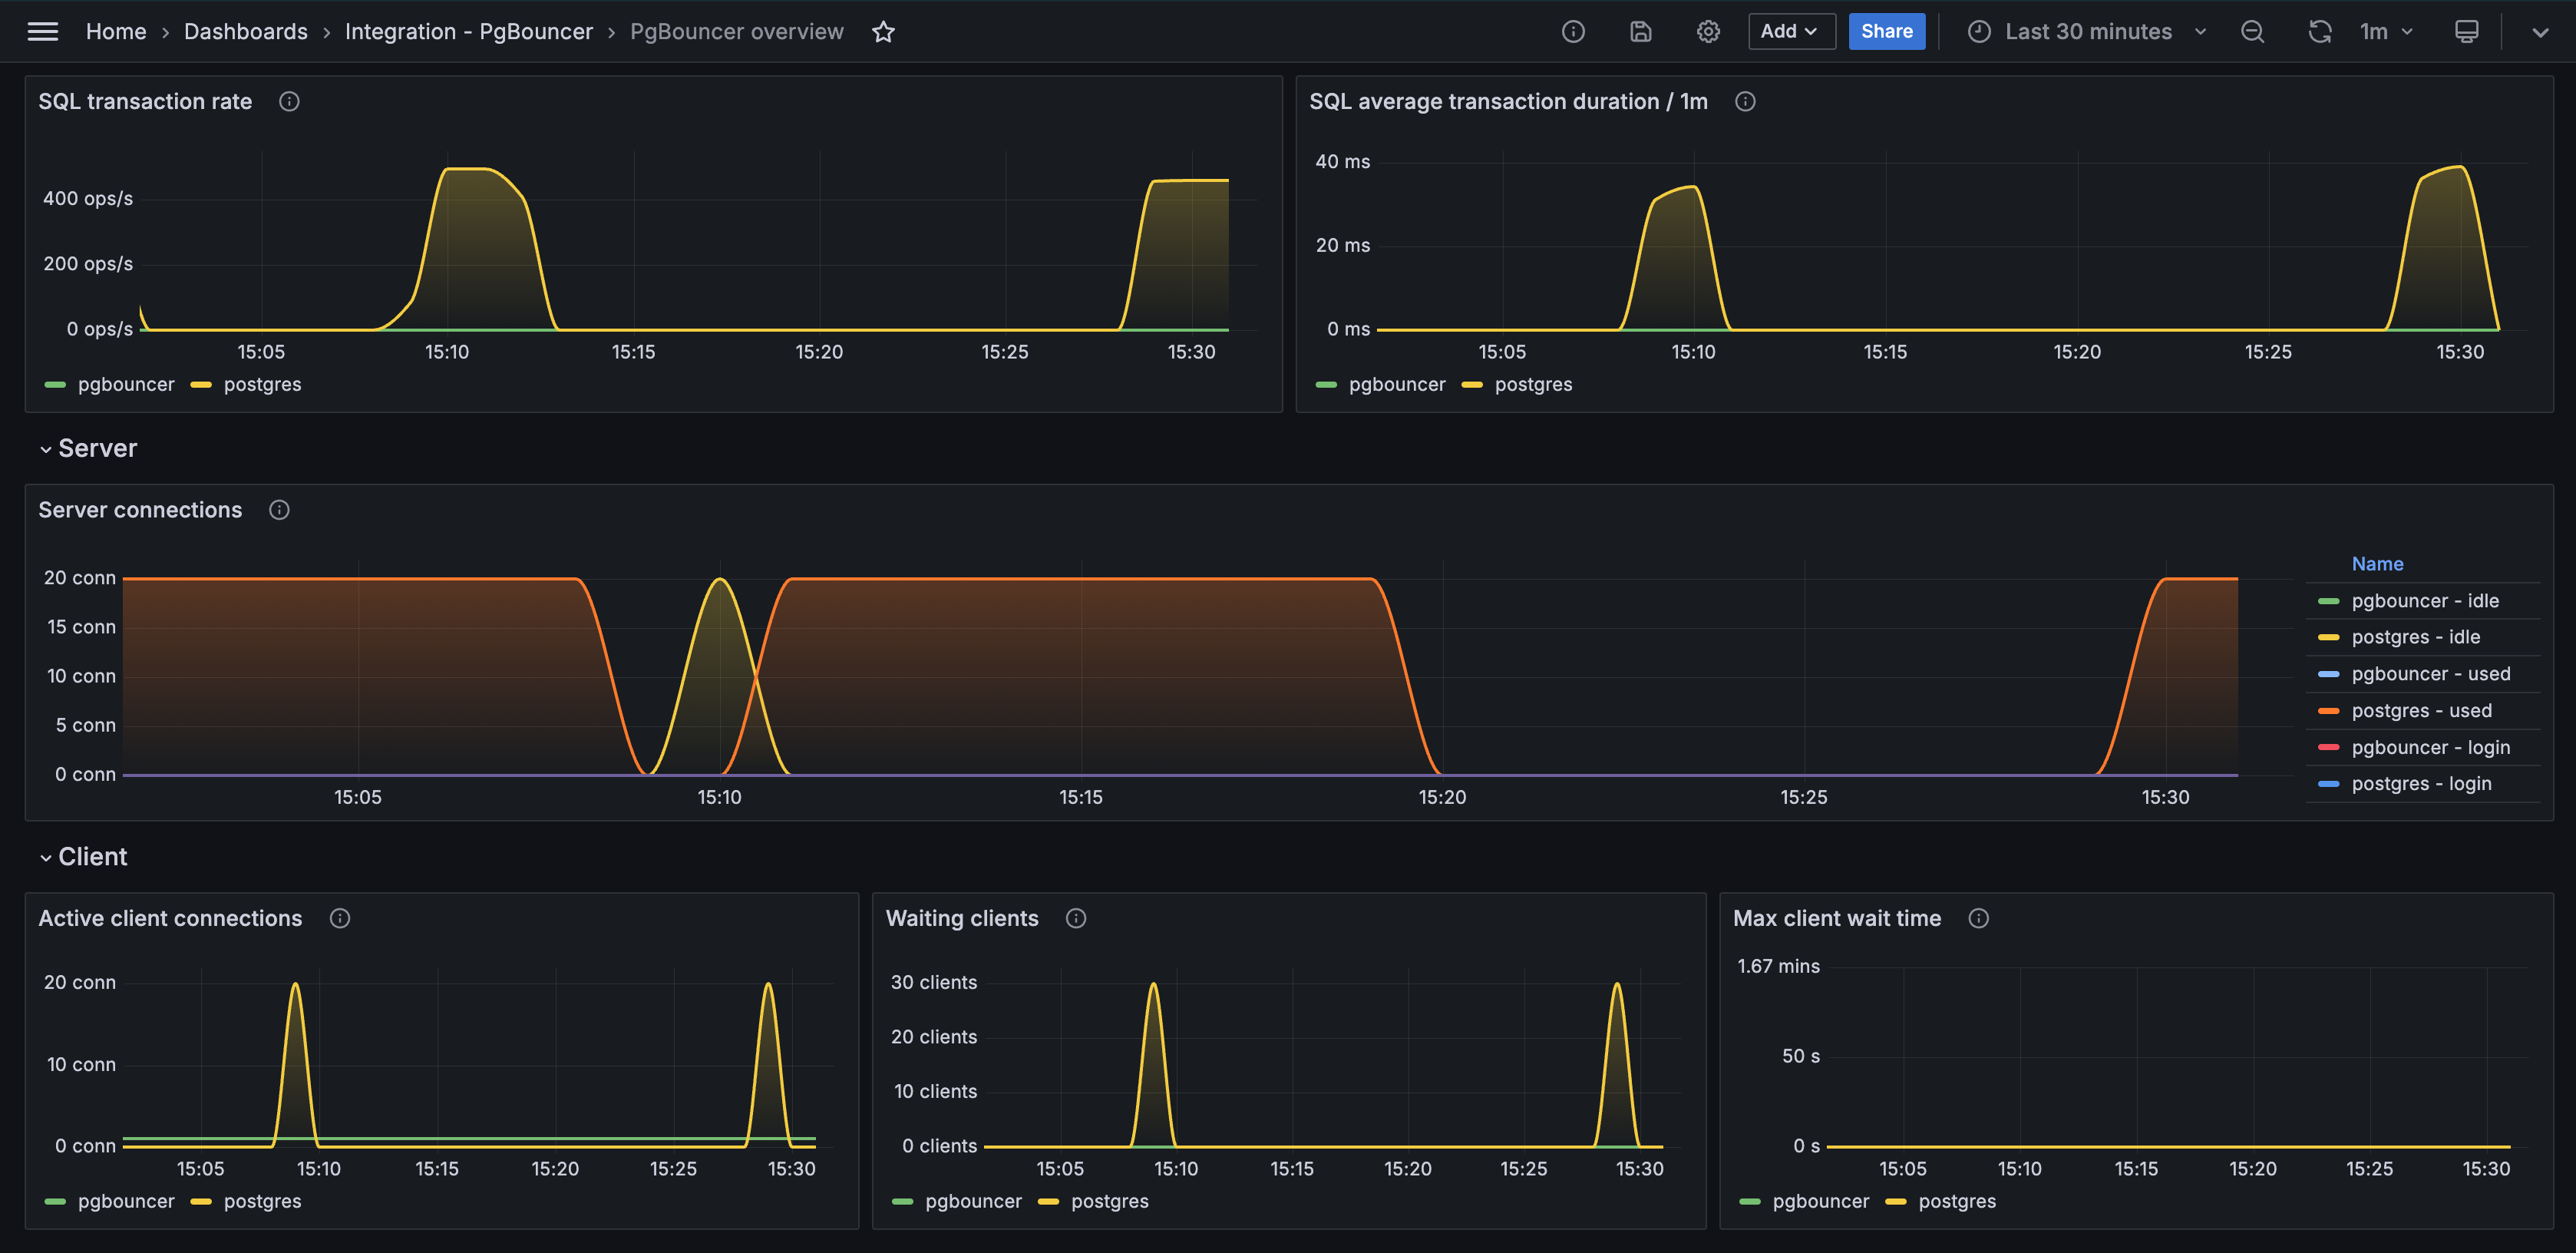
- PgBouncer overview
PgBouncer cluster overview

PgBouncer overview

PgBouncer overview (transaction)
Alerts
The PgBouncer integration includes the following useful alerts:
Metrics
The most important metrics provided by the PgBouncer integration, which are used on the pre-built dashboards and Prometheus alerts, are as follows:
- pgbouncer_config_max_client_connections
- pgbouncer_config_max_user_connections
- pgbouncer_databases_current_connections
- pgbouncer_databases_max_connections
- pgbouncer_pools_client_active_connections
- pgbouncer_pools_client_maxwait_seconds
- pgbouncer_pools_client_waiting_connections
- pgbouncer_pools_server_active_connections
- pgbouncer_pools_server_idle_connections
- pgbouncer_pools_server_login_connections
- pgbouncer_pools_server_testing_connections
- pgbouncer_pools_server_used_connections
- pgbouncer_stats_queries_duration_seconds_total
- pgbouncer_stats_queries_pooled_total
- pgbouncer_stats_received_bytes_total
- pgbouncer_stats_sent_bytes_total
- pgbouncer_stats_server_in_transaction_seconds_total
- pgbouncer_stats_sql_transactions_pooled_total
- up
Changelog
# 1.0.1 - November 2024

- Update status panel check queries

# 1.0.0 - March 2024

- Initial release
Cost
By connecting your PgBouncer instance to Grafana Cloud, you might incur charges. To view information on the number of active series that your Grafana Cloud account uses for metrics included in each Cloud tier, see Active series and dpm usage and Cloud tier pricing.


