Visualization and monitoring integrations
Visualization and monitoring integrations
/
Monitor PostgreSQLMonitor PostgreSQL easily with Grafana
Easily monitor your deployment of PostgreSQL, the open source relational database, with Grafana Cloud’s out-of-the-box monitoring solution. The Grafana Cloud forever-free tier includes 3 users and up to 10k metrics series to support your monitoring needs.
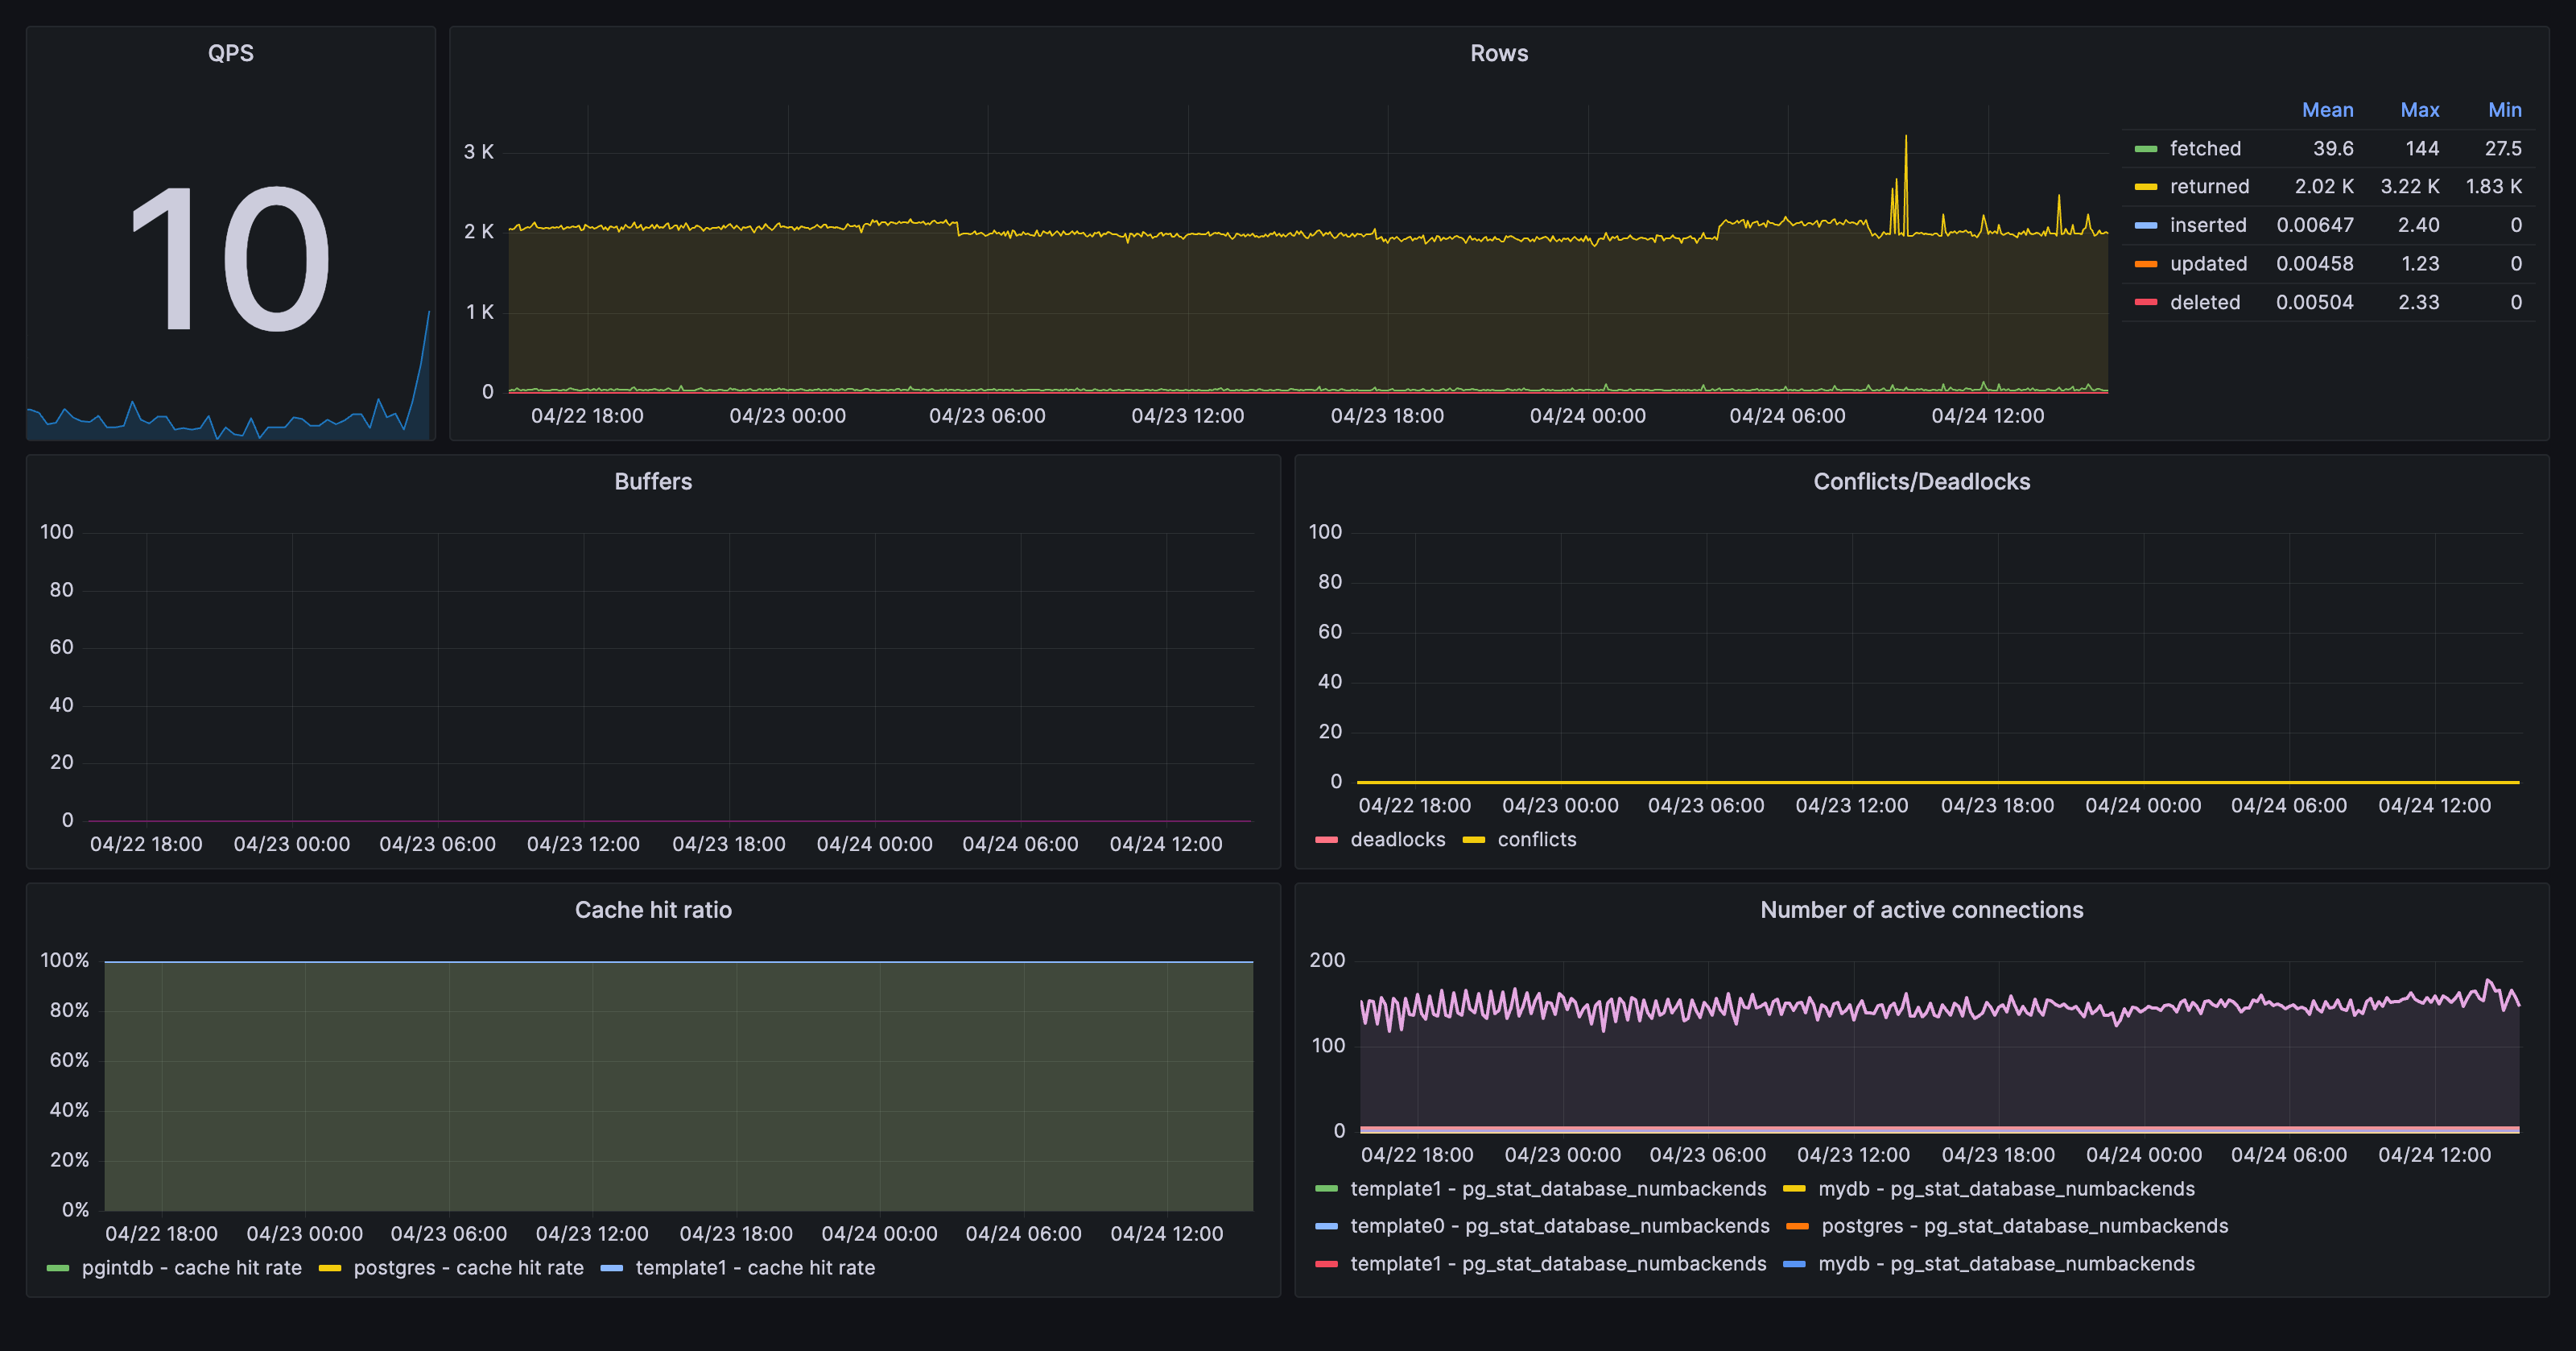
Key metrics
pg_stat_bgwriter_buffers_alloc
pg_stat_bgwriter_buffers_backend
pg_stat_bgwriter_buffers_backend_fsync
pg_stat_bgwriter_buffers_checkpoint
pg_stat_bgwriter_buffers_clean
pg_stat_database_blks_hit
pg_stat_database_blks_read
pg_stat_database_conflicts
pg_stat_database_deadlocks
pg_stat_database_numbackends
pg_stat_database_tup_deleted
pg_stat_database_tup_fetched
pg_stat_database_tup_inserted
pg_stat_database_tup_returned
pg_stat_database_tup_updated
pg_stat_database_xact_commit
pg_stat_database_xact_rollback
pg_up
Key alerting rules included
PostgreSQLMaxConnectionsReached
PostgreSQLHighConnections
PostgreSQLDown
PostgreSQLSlowQueries
PostgreSQLQPS
PostgreSQLCacheHitRatio