Menu
Grafana Cloud
Manage SLOs
The Manage SLOs page lists all the SLOs you’ve created.
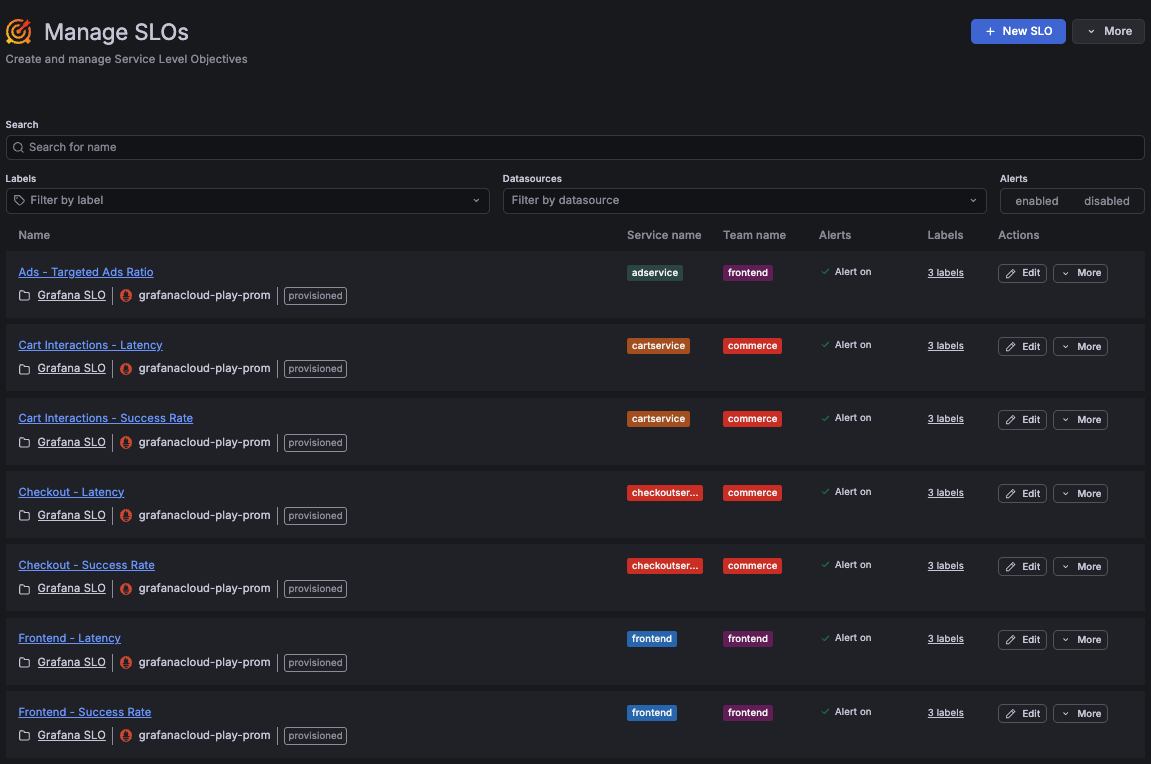
Here you can navigate to the SLO dashboard, as well as edit, filter, and manage your SLOs.
Filter SLOs
You can filter the SLOs in a number of ways on the Manage SLOs page:
- Search by name or uuid in the Search bar.
- Filter by SLO label in the Labels bar.
- Filter by SLO status to see only SLOs with critical status or with alarms firing.
- Filter by enabled or disabled alarm status.
- Sort by SLO metric trends.
Edit or delete SLOs
You can view and edit the details of your SLO, its labels, and its related rules from the Manage SLOs page.
To edit an SLO, click the Edit icon for the SLO.
The Review SLO screen opens and from there you can view the details of the SLO and edit components of it.
To delete an SLO, click the Remove icon.


