Configure a MongoDB exporter to generate Prometheus metrics
Use the recommended Percona MongoDB Exporter to export MongoDB metrics in Prometheus format.
To configure a MongoDB exporter, complete the following steps:
Run the following command to start the Docker version of the exporter:
docker run -d -p 9216:9216 -p 17001:17001 percona/mongodb_exporter:0.39 --mongodb.uri=mongodb://mongodb:17001Use
MONGODB_USERandMONGODB_PASSWORDto pass credentials.Alternatively, you can use the MongoDB exporter Prometheus community helm chart.
Request and error metrics
| Metric | Key Performance Indicator |
|---|
|
mongodb_op_counters_total
Request Rate
rate(mongodb_op_counters_total[5m])
mongodb_op_counters_repl_total
mongodb_mongod_op_counters_repl_total
Request Rate
rate(…[5m])
mongodb_mongod_op_latencies_ops/latencies_total
Latency Average
rate(mongodb_mongod_op_latencies_latency_total[5m])
/
rate(mongodb_mongod_op_latencies_ops_total[5m])
Resource metrics
| Metric | Key Performance Indicator |
|---|---|
Connection Counts mongodb_ss_connections | Connection Usage |
/ ignoring(conn_type) (mongodb_ss_connections{conn_type=“current”} + ignoring(conn_type) mongodb_ss_connections{conn_type=“available”}) |
Alerts
| KPI | Alert |
|---|---|
| Request Rate | RequestRateAnomaly |
| Latency Average | LatencyAverageAnomaly, LatencyAverageBreach |
| Connection Usage | Saturation with a severity level of critical when utilization exceeds 90% |
Failure alerts
| Alert | Description |
|---|---|
| MongodbDown | Fires when Mongo DB is down |
| MongodbReplicaMemberUnhealthy | Fires when a replica in a replication set is unhealthy |
| MongodbReplicationLag | Fires when the replication lag of a secondary is more than a configured time duration. Severity is set to warning when lag > 60s and critical when lag > 240s. |
| MongodbReplicationHeadroom | Fires when the replication lag of a secondary is more than a configured time duration. Severity is set to warning when lag > 60s and critical when lag > 240s. |
| MongodbTooManyCursorsOpen | Fires when the number of open cursors is above a given threshold. By default, the threshold is set to 10000. Severity is set to warning. |
| MongodbTooManyCursorTimeouts | Fires if the rate of cursor timeout is above a certain threshold. By default, the threshold is set to 100. Severity is set to warning. |
| MongodbInternalErrors | Fires when the count of internal errors keeps growing for 5m. Severity is set to warning. |
| MongodbUserErrors | Fires when the count of user errors keeps growing for 5m. Severity is set to warning. |
| ReadRequestsQueueingUp | If the read queue keeps growing for 5m. Severity is set to warning. |
| WriteRequestsQueueingUp | If the write queue keeps growing for 5m. Severity is set to warning. |
Dashboard
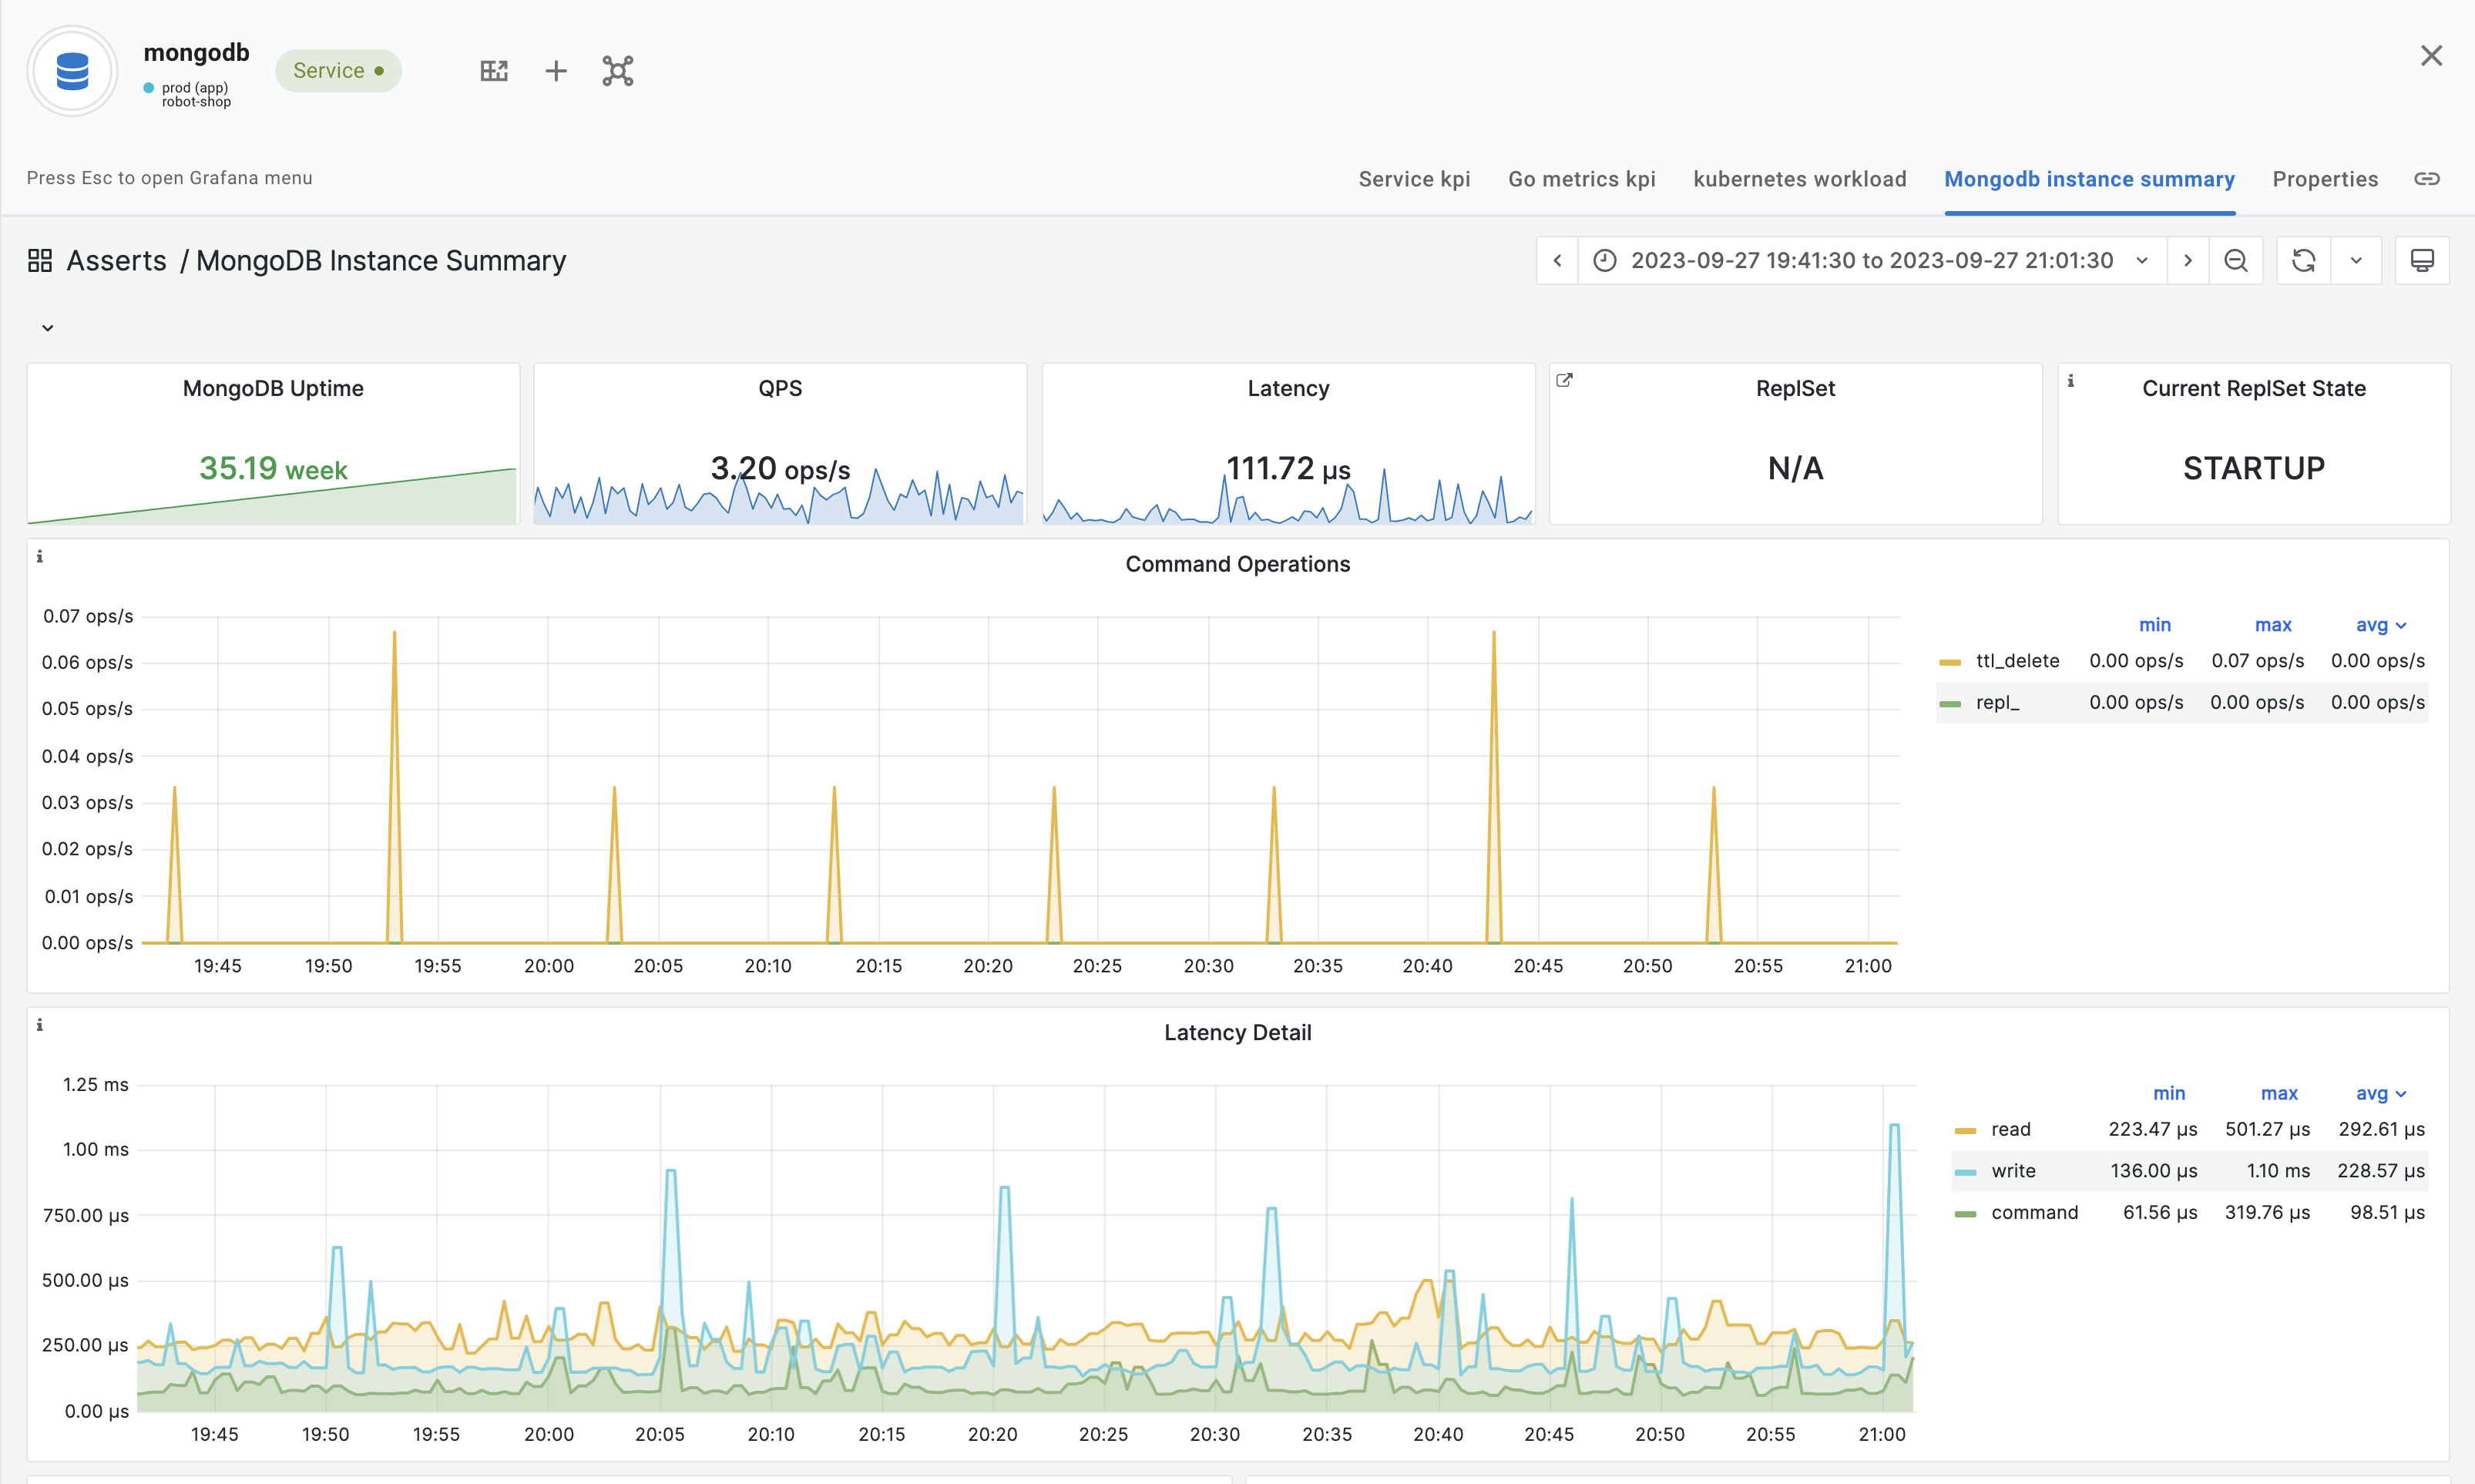
The following image shows an example of the MongoDB Instance Summary Dashboard.


