Apache ActiveMQ integration for Grafana Cloud
Apache ActiveMQ is an open-source message broker software that facilitates the communication between different applications or components using messaging patterns. Message brokers like ActiveMQ play a crucial role in distributed systems by enabling asynchronous communication and decoupling producers and consumers of messages. They serve as intermediaries that receive, store, and route messages between different components, applications, or services. The integration with Grafana Cloud enables users to oversee an ActiveMQ environment using five distinct dashboards. These dashboards display metrics and logs for ActiveMQ clusters, instances, topics, and queue components.
This integration supports Apache ActiveMQ version 5.x+
This integration supports the JMX exporter 0.17.0+
This integration includes 4 useful alerts and 5 pre-built dashboards to help monitor and visualize Apache ActiveMQ metrics and logs.
Before you begin
In order for the integration to properly work, you must set up the JMX Exporter for Prometheus on each instance in your cluster.
Setup JMX Exporter
To expose the JMX remotely, it needs to be enabled for the instances being monitored. A configuration option enables JMX, which exists in a env file located in the <apache-activemq-installation-dir>/bin/env directory. Within the env file, the following lines should be added:
ACTIVEMQ_SUNJMX_START="$ACTIVEMQ_SUNJMX_START -Dcom.sun.management.jmxremote.port=11099"
ACTIVEMQ_SUNJMX_START="$ACTIVEMQ_SUNJMX_START -Dcom.sun.management.jmxremote.authenticate=false"
ACTIVEMQ_SUNJMX_START="$ACTIVEMQ_SUNJMX_START -Dcom.sun.management.jmxremote.ssl=false"
ACTIVEMQ_SUNJMX_START="$ACTIVEMQ_SUNJMX_START -Dcom.sun.management.jmxremote"
Change the jmxremote.port on the first command above for each instance you run, then save the configuration files. For more details, refer to the official documentation.
Connect JMX to the Prometheus Exporter
In order to connect JMX to the Prometheus Exporter, a collector is configured in a config file. This config.yaml file can be placed anywhere and named anything. The contents of this file will be the following
lowercaseOutputLabelNames: true
lowercaseOutputName: true
rules:
  - pattern: org.apache.activemq<type=Broker, brokerName=(\S*), destinationType=Queue, destinationName=(\S*)><>(\w+)
    name: activemq_queue_$3
    attrNameSnakeCase: true
    labels:
      destination: $2

  - pattern: org.apache.activemq<type=Broker, brokerName=(\S*), destinationType=Topic, destinationName=(\S*)><>(\w+)
    name: activemq_topic_$3
    attrNameSnakeCase: true
    labels:
      destination: $2

  - pattern: org.apache.activemq<type=Broker, brokerName=(\S*)><>CurrentConnectionsCount
    name: activemq_connections
    type: GAUGE

  - pattern: org.apache.activemq<type=Broker, brokerName=(\S*)><>Total(.*)Count
    name: activemq_$2_total
    type: COUNTER

  - pattern: org.apache.activemq<type=Broker, brokerName=(\S*)><>(.*)PercentUsage
    name: activemq_$2_usage_ratio
    type: GAUGE
    valueFactor: 0.01

  - pattern: 'java.lang<name=([^>]+), type=GarbageCollector><LastGcInfo>duration: (\d+)'
    name: jvm_gc_duration_seconds
    value: $2
    labels:
      name: $1
    type: GAUGE
    # Convert ms to s
    valueFactor: 0.001

  - pattern: 'java.lang<name=([^>]+), type=GarbageCollector><>CollectionCount: (\d+)'
    name: jvm_gc_collection_count
    value: $2
    labels:
      name: $1
    type: GAUGE
Run the Prometheus Exporter
To run the JMX to Prometheus Exporter, the Java agent is used. The command requires two arguments: a <CONFIG>.yaml file that was created above, and the <JMX_EXPORTER_PORT> that exposes the metrics.
The following command runs the JMX to Prometheus Exporter as a Java agent:
java -javaagent:./jmx_prometheus_javaagent-0.19.0.jar=<JMX_EXPORTER_PORT>:/path/to/config/<CONFIG>.yaml -jar yourJar.jarTo validate that the JMX Exporter is setup correctly, the Prometheus metrics should be available locally via curl:
curl http://localhost:<JMX_EXPORTER_PORT>/metricsInstall Apache ActiveMQ integration for Grafana Cloud
- In your Grafana Cloud stack, click Connections in the left-hand menu.
- Find Apache ActiveMQ and click its tile to open the integration.
- Review the prerequisites in the Configuration Details tab and set up Grafana Alloy to send Apache ActiveMQ metrics and logs to your Grafana Cloud instance.
- Click Install to add this integration’s pre-built dashboards and alerts to your Grafana Cloud instance, and you can start monitoring your Apache ActiveMQ setup.
Configuration snippets for Grafana Alloy
Advanced mode
The following snippets provide examples to guide you through the configuration process.
To instruct Grafana Alloy to scrape your Apache ActiveMQ instances, manually copy and append the snippets to your alloy configuration file, then follow subsequent instructions.
Advanced metrics snippets
prometheus.scrape "metrics_integrations_integrations_apache_activemq" {
	targets = [{
		__address__      = "<instance-name>:<instance-port>",
		activemq_cluster = "<activemq-cluster-name>",
	}]
	forward_to = [prometheus.remote_write.metrics_service.receiver]
	job_name   = "integrations/apache-activemq"
}
To monitor your Apache ActiveMQ instance, you must use a discovery.relabel component to discover your Apache ActiveMQ Prometheus endpoint and apply appropriate labels, followed by a prometheus.scrape component to scrape it.
Configure the following properties within each discovery.relabel component:
__address__: The address to your Apache ActiveMQ Prometheus metrics endpoint.instancelabel:constants.hostnamesets theinstancelabel to your Grafana Alloy server hostname. If that is not suitable, change it to a value uniquely identifies this Apache ActiveMQ instance. Make sure this label value is the same for all telemetry data collected for this instance.activemq_cluster: Theactivemq_clusterlabel to group your ActiveMQ instances within a cluster. Set the same value for all nodes within your cluster.
If you have multiple Apache ActiveMQ servers to scrape, configure one discovery.relabel for each and scrape them by including each under targets within the prometheus.scrape component.
Advanced logs snippets
darwin
local.file_match "logs_integrations_integrations_apache_activemq" {
	path_targets = [{
		__address__      = "localhost",
		__path__         = "<activemq_install_dir>/data/activemq.log",
		activemq_cluster = "<activemq-cluster-name>",
		instance         = "<instance-name>:<instance-port>",
		job              = "integrations/apache-activemq",
	}]
}

loki.process "logs_integrations_integrations_apache_activemq" {
	forward_to = [loki.write.grafana_cloud_loki.receiver]

	stage.multiline {
		firstline     = "(TRACE|DEBUG|INFO|WARN|ERROR|FATAL)"
		max_lines     = 0
		max_wait_time = "3s"
	}

	stage.regex {
		expression = "(?P<level>TRACE|DEBUG|INFO|WARN|ERROR|FATAL)\\s*[\\|:]\\s*(?P<message>.+)"
	}

	stage.labels {
		values = {
			level = null,
		}
	}
}

loki.source.file "logs_integrations_integrations_apache_activemq" {
	targets    = local.file_match.logs_integrations_integrations_apache_activemq.targets
	forward_to = [loki.process.logs_integrations_integrations_apache_activemq.receiver]
}
To monitor your Apache ActiveMQ instance logs, you will use a combination of the following components:
local.file_match defines where to find the log file to be scraped. Change the following properties according to your environment:
__address__: The Apache ActiveMQ instance address__path__: The path to the log file, which is typically in thedatafile within the Apache ActiveMQ installation directory. An example log location looks like/apache-activemq-5.18.2/data/activemq.logon Unix based systems and likeC:\apache-activemq-x.x.x\data\activemq.logon Windows.instancelabel:constants.hostnamesets theinstancelabel to your Grafana Alloy server hostname. If that is not suitable, change it to a value uniquely identifies this Apache ActiveMQ instance. Make sure this label value is the same for all telemetry data collected for this instance.activemq_cluster: Theactivemq_clusterlabel to group your ActiveMQ instances within a cluster. Set the same value for all nodes within your cluster.
loki.process defines how to process logs before sending it to Loki.
loki.source.file sends logs to Loki.
linux
local.file_match "logs_integrations_integrations_apache_activemq" {
	path_targets = [{
		__address__      = "localhost",
		__path__         = "<activemq_install_dir>/data/activemq.log",
		activemq_cluster = "<activemq-cluster-name>",
		instance         = "<instance-name>:<instance-port>",
		job              = "integrations/apache-activemq",
	}]
}

loki.process "logs_integrations_integrations_apache_activemq" {
	forward_to = [loki.write.grafana_cloud_loki.receiver]

	stage.multiline {
		firstline     = "(TRACE|DEBUG|INFO|WARN|ERROR|FATAL)"
		max_lines     = 0
		max_wait_time = "3s"
	}

	stage.regex {
		expression = "(?P<level>TRACE|DEBUG|INFO|WARN|ERROR|FATAL)\\s*[\\|:]\\s*(?P<message>.+)"
	}

	stage.labels {
		values = {
			level = null,
		}
	}
}

loki.source.file "logs_integrations_integrations_apache_activemq" {
	targets    = local.file_match.logs_integrations_integrations_apache_activemq.targets
	forward_to = [loki.process.logs_integrations_integrations_apache_activemq.receiver]
}
To monitor your Apache ActiveMQ instance logs, you will use a combination of the following components:
local.file_match defines where to find the log file to be scraped. Change the following properties according to your environment:
__address__: The Apache ActiveMQ instance address__path__: The path to the log file, which is typically in thedatafile within the Apache ActiveMQ installation directory. An example log location looks like/apache-activemq-5.18.2/data/activemq.logon Unix based systems and likeC:\apache-activemq-x.x.x\data\activemq.logon Windows.instancelabel:constants.hostnamesets theinstancelabel to your Grafana Alloy server hostname. If that is not suitable, change it to a value uniquely identifies this Apache ActiveMQ instance. Make sure this label value is the same for all telemetry data collected for this instance.activemq_cluster: Theactivemq_clusterlabel to group your ActiveMQ instances within a cluster. Set the same value for all nodes within your cluster.
loki.process defines how to process logs before sending it to Loki.
loki.source.file sends logs to Loki.
windows
local.file_match "logs_integrations_integrations_apache_activemq" {
	path_targets = [{
		__address__      = "localhost",
		__path__         = "<activemq_install_dir>/data/activemq.log",
		activemq_cluster = "<activemq-cluster-name>",
		instance         = "<instance-name>:<instance-port>",
		job              = "integrations/apache-activemq",
	}]
}

loki.process "logs_integrations_integrations_apache_activemq" {
	forward_to = [loki.write.grafana_cloud_loki.receiver]

	stage.multiline {
		firstline     = "(TRACE|DEBUG|INFO|WARN|ERROR|FATAL)"
		max_lines     = 0
		max_wait_time = "3s"
	}

	stage.regex {
		expression = "(?P<level>TRACE|DEBUG|INFO|WARN|ERROR|FATAL)\\s*[\\|:]\\s*(?P<message>.+)"
	}

	stage.labels {
		values = {
			level = null,
		}
	}
}

loki.source.file "logs_integrations_integrations_apache_activemq" {
	targets    = local.file_match.logs_integrations_integrations_apache_activemq.targets
	forward_to = [loki.process.logs_integrations_integrations_apache_activemq.receiver]
}
To monitor your Apache ActiveMQ instance logs, you will use a combination of the following components:
local.file_match defines where to find the log file to be scraped. Change the following properties according to your environment:
__address__: The Apache ActiveMQ instance address__path__: The path to the log file, which is typically in thedatafile within the Apache ActiveMQ installation directory. An example log location looks like/apache-activemq-5.18.2/data/activemq.logon Unix based systems and likeC:\apache-activemq-x.x.x\data\activemq.logon Windows.instancelabel:constants.hostnamesets theinstancelabel to your Grafana Alloy server hostname. If that is not suitable, change it to a value uniquely identifies this Apache ActiveMQ instance. Make sure this label value is the same for all telemetry data collected for this instance.activemq_cluster: Theactivemq_clusterlabel to group your ActiveMQ instances within a cluster. Set the same value for all nodes within your cluster.
loki.process defines how to process logs before sending it to Loki.
loki.source.file sends logs to Loki.
Kubernetes instructions
Before you begin with Kubernetes
Please note: These instructions assume the use of the Kubernetes Monitoring Helm chart
In order for the integration to properly work, you must set up the JMX Exporter for Prometheus on each instance in your cluster.
Setup JMX Exporter
To expose the JMX remotely, it needs to be enabled for the instances being monitored. A configuration option enables JMX, which exists in a env file located in the <apache-activemq-installation-dir>/bin/env directory. Within the env file, the following lines should be added:
ACTIVEMQ_SUNJMX_START="$ACTIVEMQ_SUNJMX_START -Dcom.sun.management.jmxremote.port=11099"
ACTIVEMQ_SUNJMX_START="$ACTIVEMQ_SUNJMX_START -Dcom.sun.management.jmxremote.authenticate=false"
ACTIVEMQ_SUNJMX_START="$ACTIVEMQ_SUNJMX_START -Dcom.sun.management.jmxremote.ssl=false"
ACTIVEMQ_SUNJMX_START="$ACTIVEMQ_SUNJMX_START -Dcom.sun.management.jmxremote"
Change the jmxremote.port on the first command above for each instance you run, then save the configuration files. For more details, refer to the official documentation.
Connect JMX to the Prometheus Exporter
In order to connect JMX to the Prometheus Exporter, a collector is configured in a config file. This config.yaml file can be placed anywhere and named anything. The contents of this file will be the following
lowercaseOutputLabelNames: true
lowercaseOutputName: true
rules:
  - pattern: org.apache.activemq<type=Broker, brokerName=(\S*), destinationType=Queue, destinationName=(\S*)><>(\w+)
    name: activemq_queue_$3
    attrNameSnakeCase: true
    labels:
      destination: $2

  - pattern: org.apache.activemq<type=Broker, brokerName=(\S*), destinationType=Topic, destinationName=(\S*)><>(\w+)
    name: activemq_topic_$3
    attrNameSnakeCase: true
    labels:
      destination: $2

  - pattern: org.apache.activemq<type=Broker, brokerName=(\S*)><>CurrentConnectionsCount
    name: activemq_connections
    type: GAUGE

  - pattern: org.apache.activemq<type=Broker, brokerName=(\S*)><>Total(.*)Count
    name: activemq_$2_total
    type: COUNTER

  - pattern: org.apache.activemq<type=Broker, brokerName=(\S*)><>(.*)PercentUsage
    name: activemq_$2_usage_ratio
    type: GAUGE
    valueFactor: 0.01

  - pattern: 'java.lang<name=([^>]+), type=GarbageCollector><LastGcInfo>duration: (\d+)'
    name: jvm_gc_duration_seconds
    value: $2
    labels:
      name: $1
    type: GAUGE
    # Convert ms to s
    valueFactor: 0.001

  - pattern: 'java.lang<name=([^>]+), type=GarbageCollector><>CollectionCount: (\d+)'
    name: jvm_gc_collection_count
    value: $2
    labels:
      name: $1
    type: GAUGE
Run the Prometheus Exporter
To run the JMX to Prometheus Exporter, the Java agent is used. The command requires two arguments: a <CONFIG>.yaml file that was created above, and the <JMX_EXPORTER_PORT> that exposes the metrics.
The following command runs the JMX to Prometheus Exporter as a Java agent:
java -javaagent:./jmx_prometheus_javaagent-0.19.0.jar=<JMX_EXPORTER_PORT>:/path/to/config/<CONFIG>.yaml -jar yourJar.jarTo validate that the JMX Exporter is setup correctly, the Prometheus metrics should be available locally via curl:
curl http://localhost:<JMX_EXPORTER_PORT>/metricsConfiguration snippets for Kubernetes Helm chart
The following snippets provide examples to guide you through the configuration process.
To scrape your Apache ActiveMQ instances, manually modify your Kubernetes Monitoring Helm chart with these configuration snippets.
Replace any values between the angle brackets <> in the provided snippets with your desired configuration values.
Metrics snippets
alloy-metrics:
    extraConfig: |-
        discovery.kubernetes "activemq" {
            role = "pod"
            selectors {
                role = "pod"
                label = "<activemq_pod_label>=<activemq_pod_label_value>"
            }
        }

        discovery.relabel "activemq" {
            targets = discovery.kubernetes.activemq.targets
            rule {
                source_labels = ["__meta_kubernetes_pod_container_port_number"]
                regex = "<activemq_jmx_port_number>"
                action = "keep"
            }
            rule {
                source_labels = ["__meta_kubernetes_namespace", "__meta_kubernetes_pod_container_name"]
                separator = "-"
                target_label = "instance"
            }
            rule {
                replacement = "<your-activemq-cluster-name>"
                target_label = "activemq_cluster"
            }
            rule {
                replacement = "integrations/apache-activemq"
                target_label = "job"
            }
        }

        prometheus.scrape "activemq" {
            targets      = discovery.relabel.activemq.output
            honor_labels = true
            forward_to   = [prometheus.remote_write.grafana_cloud_metrics.receiver]
        }
Logs snippets
podLogs:
    extraDiscoveryRules: |-
        rule {
            source_labels = ["__meta_kubernetes_pod_label_<activemq_pod_label>"]
            regex         = "<activemq_pod_label_value>"
            replacement   = "activemq"
            target_label  = "integration"
        }

    extraLogProcessingStages: |-
        stage.match {
            selector = "{integration=\\"activemq\\"}"

            stage.multiline {
                firstline     = "(TRACE|DEBUG|INFO|WARN|ERROR|FATAL)"
                max_lines     = 0
                max_wait_time = "3s"
            }

            stage.regex {
                expression = "(?P<level>TRACE|DEBUG|INFO|WARN|ERROR|FATAL)\\\\s*[\\\\|:]\\\\s*(?P<message>.+)"
            }

            stage.template {
                source   = "instance"
                template = "{{ .namespace }}-{{ .container }}"
            }

            stage.static_labels {
                values = {
                    activemq_cluster = "<your-activemq-cluster-name>",
                    job              = "integrations/apache-activemq",
                }
            }

            stage.labels {
                values = {
                    instance = null,
                    level = null,
                }
            }
        }
Dashboards
The Apache ActiveMQ integration installs the following dashboards in your Grafana Cloud instance to help monitor your system.
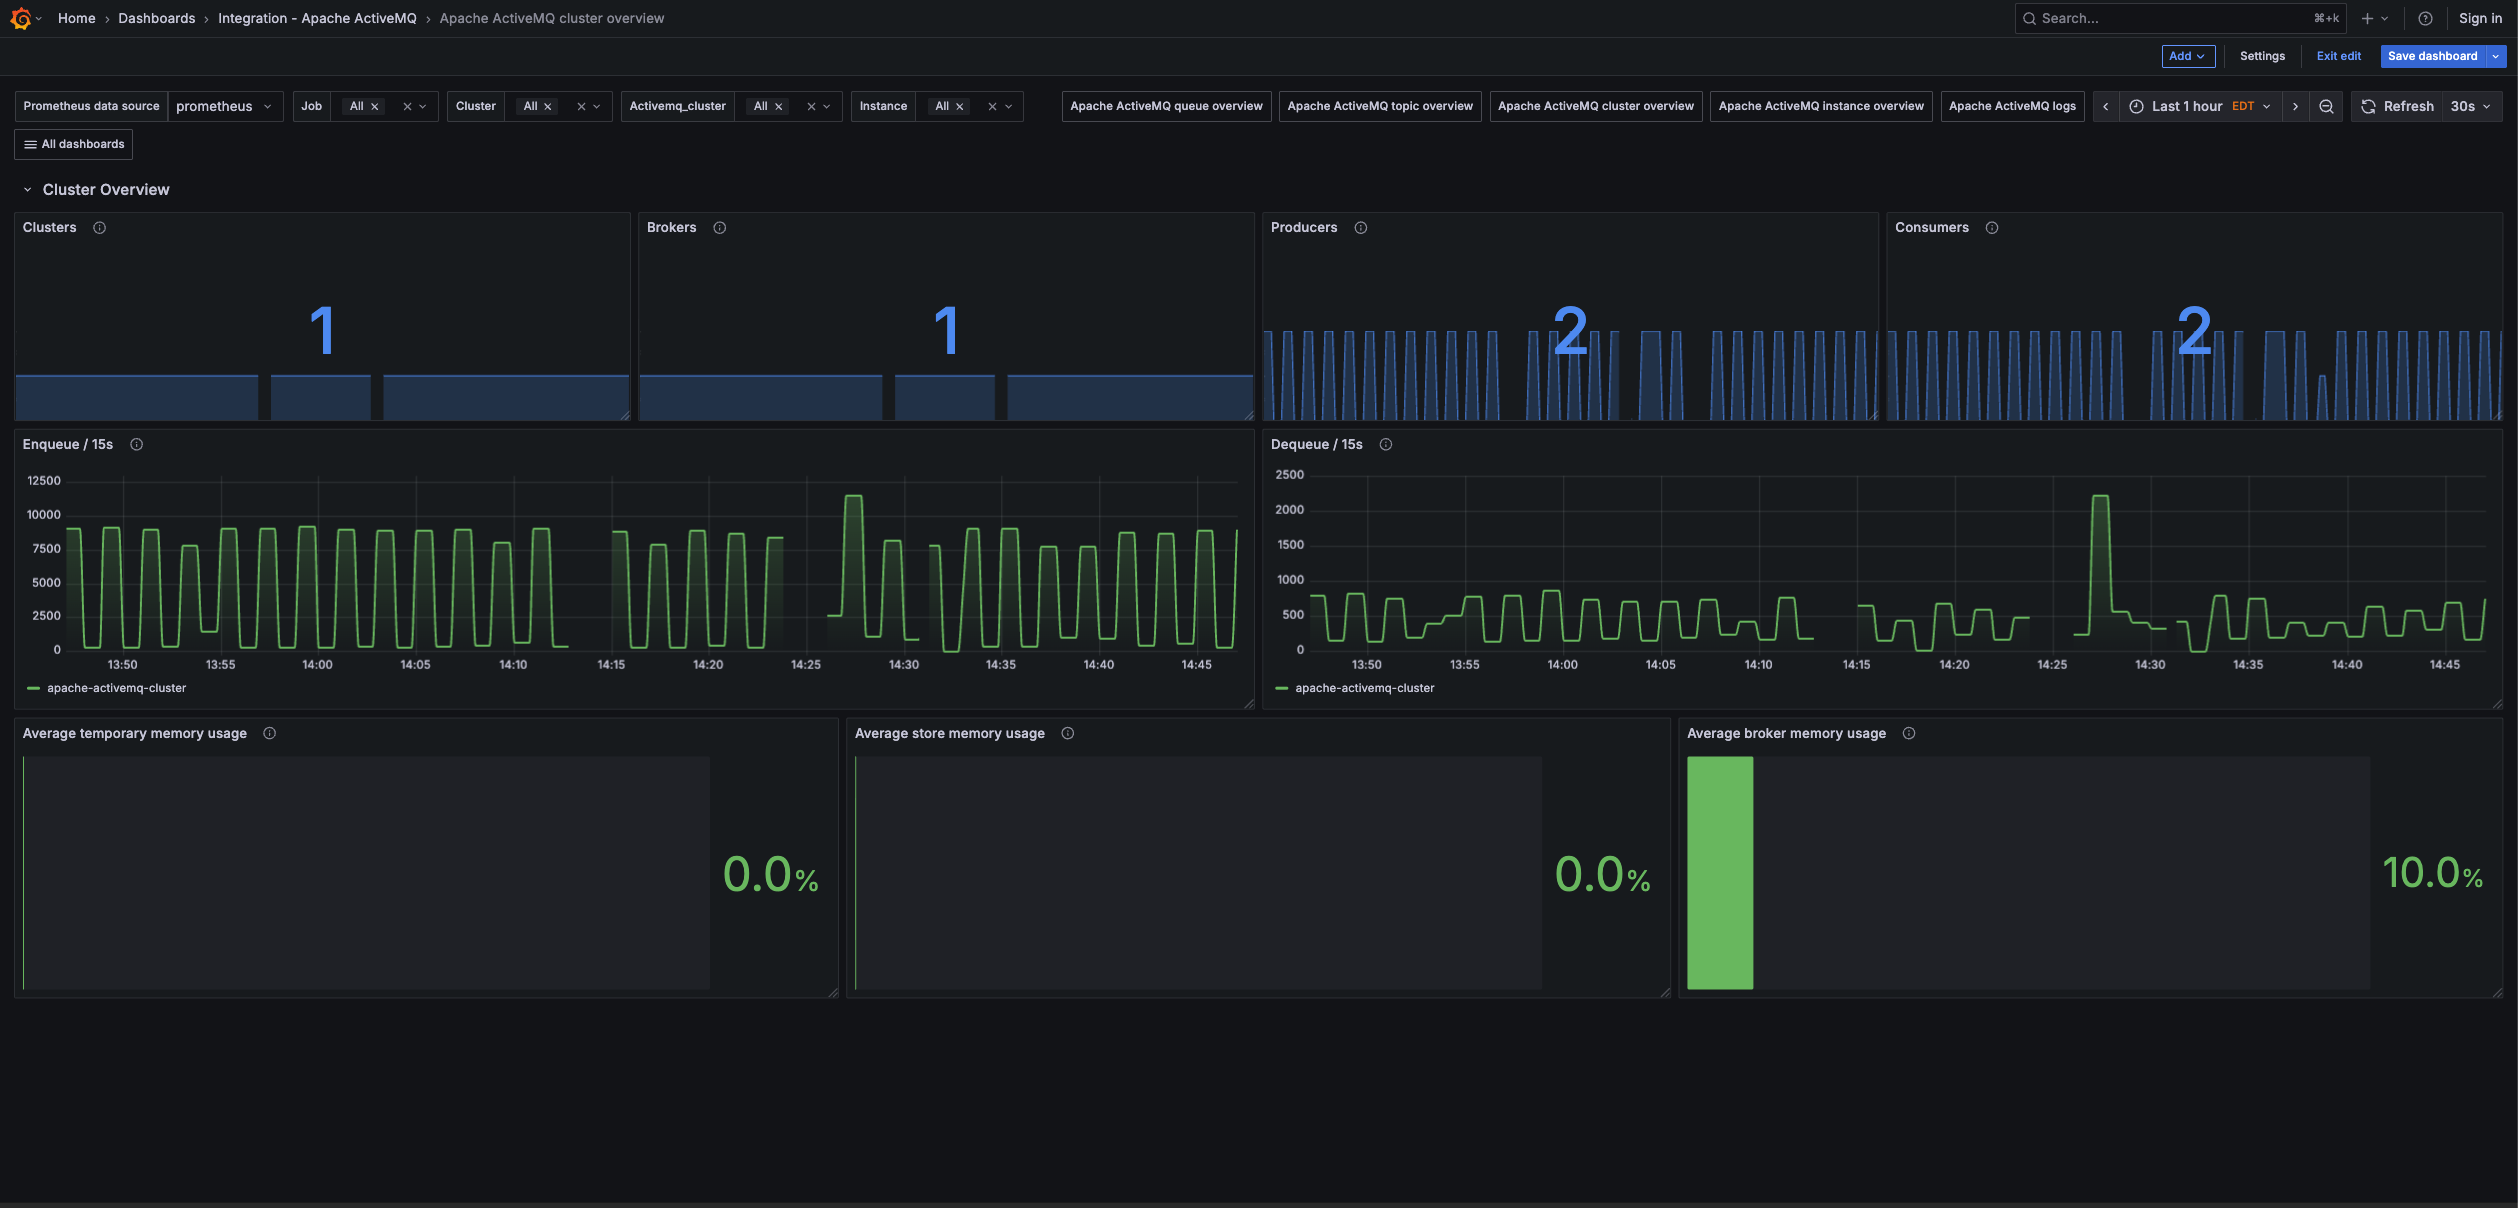
- Apache ActiveMQ cluster overview
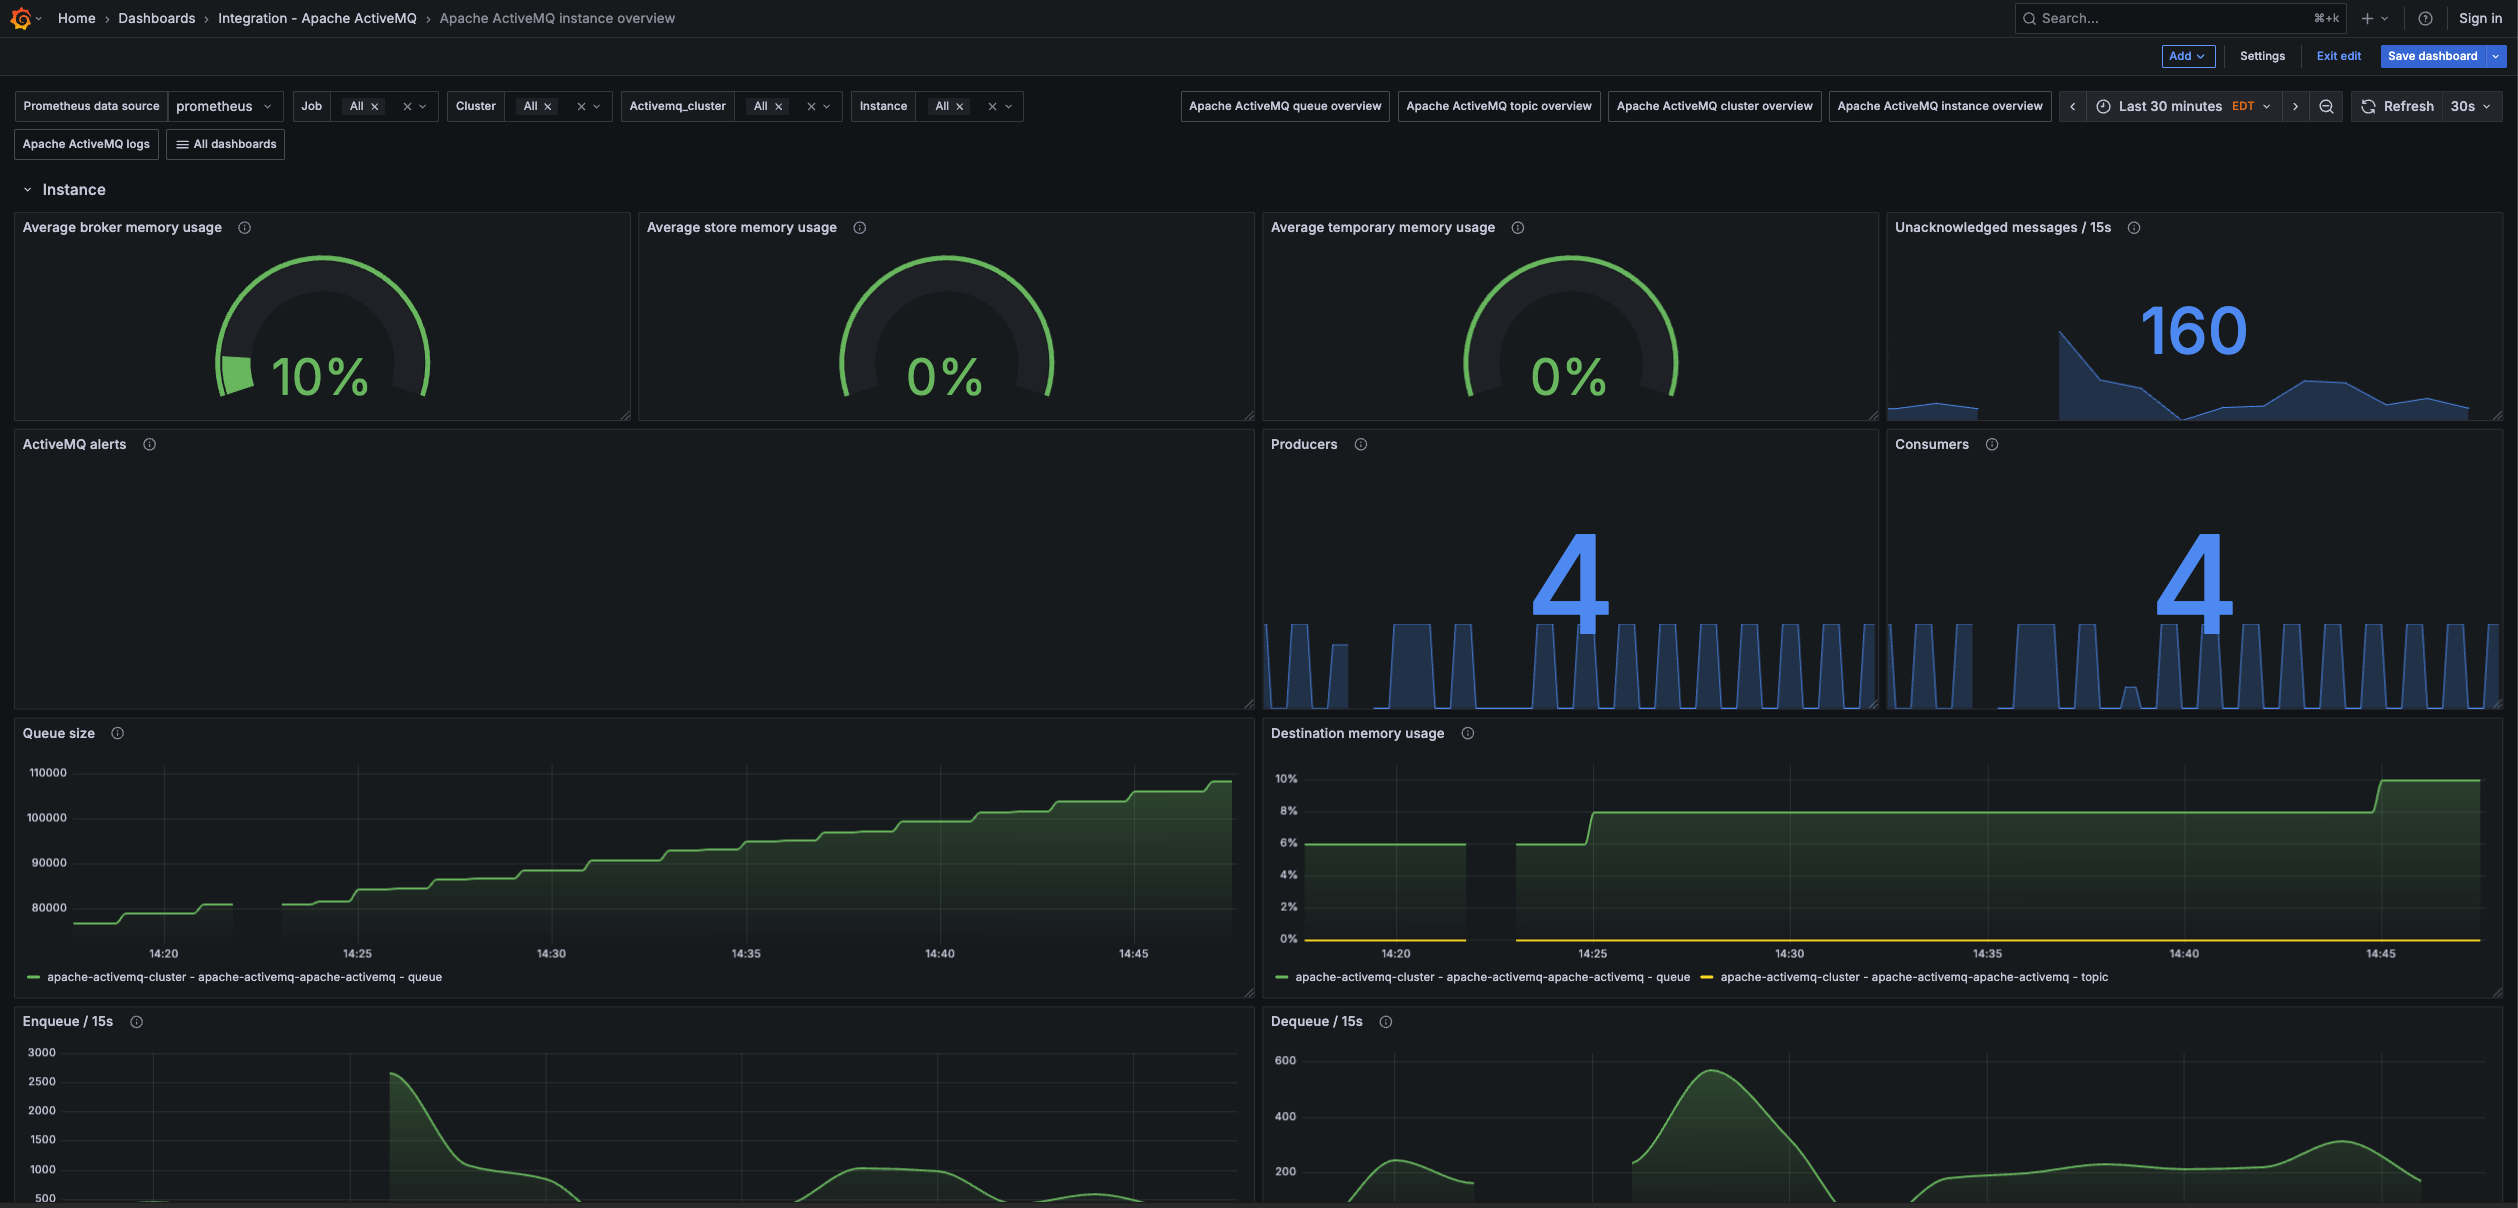
- Apache ActiveMQ instance overview
- Apache ActiveMQ logs
- Apache ActiveMQ queue overview
- Apache ActiveMQ topic overview
Apache ActiveMQ cluster overview
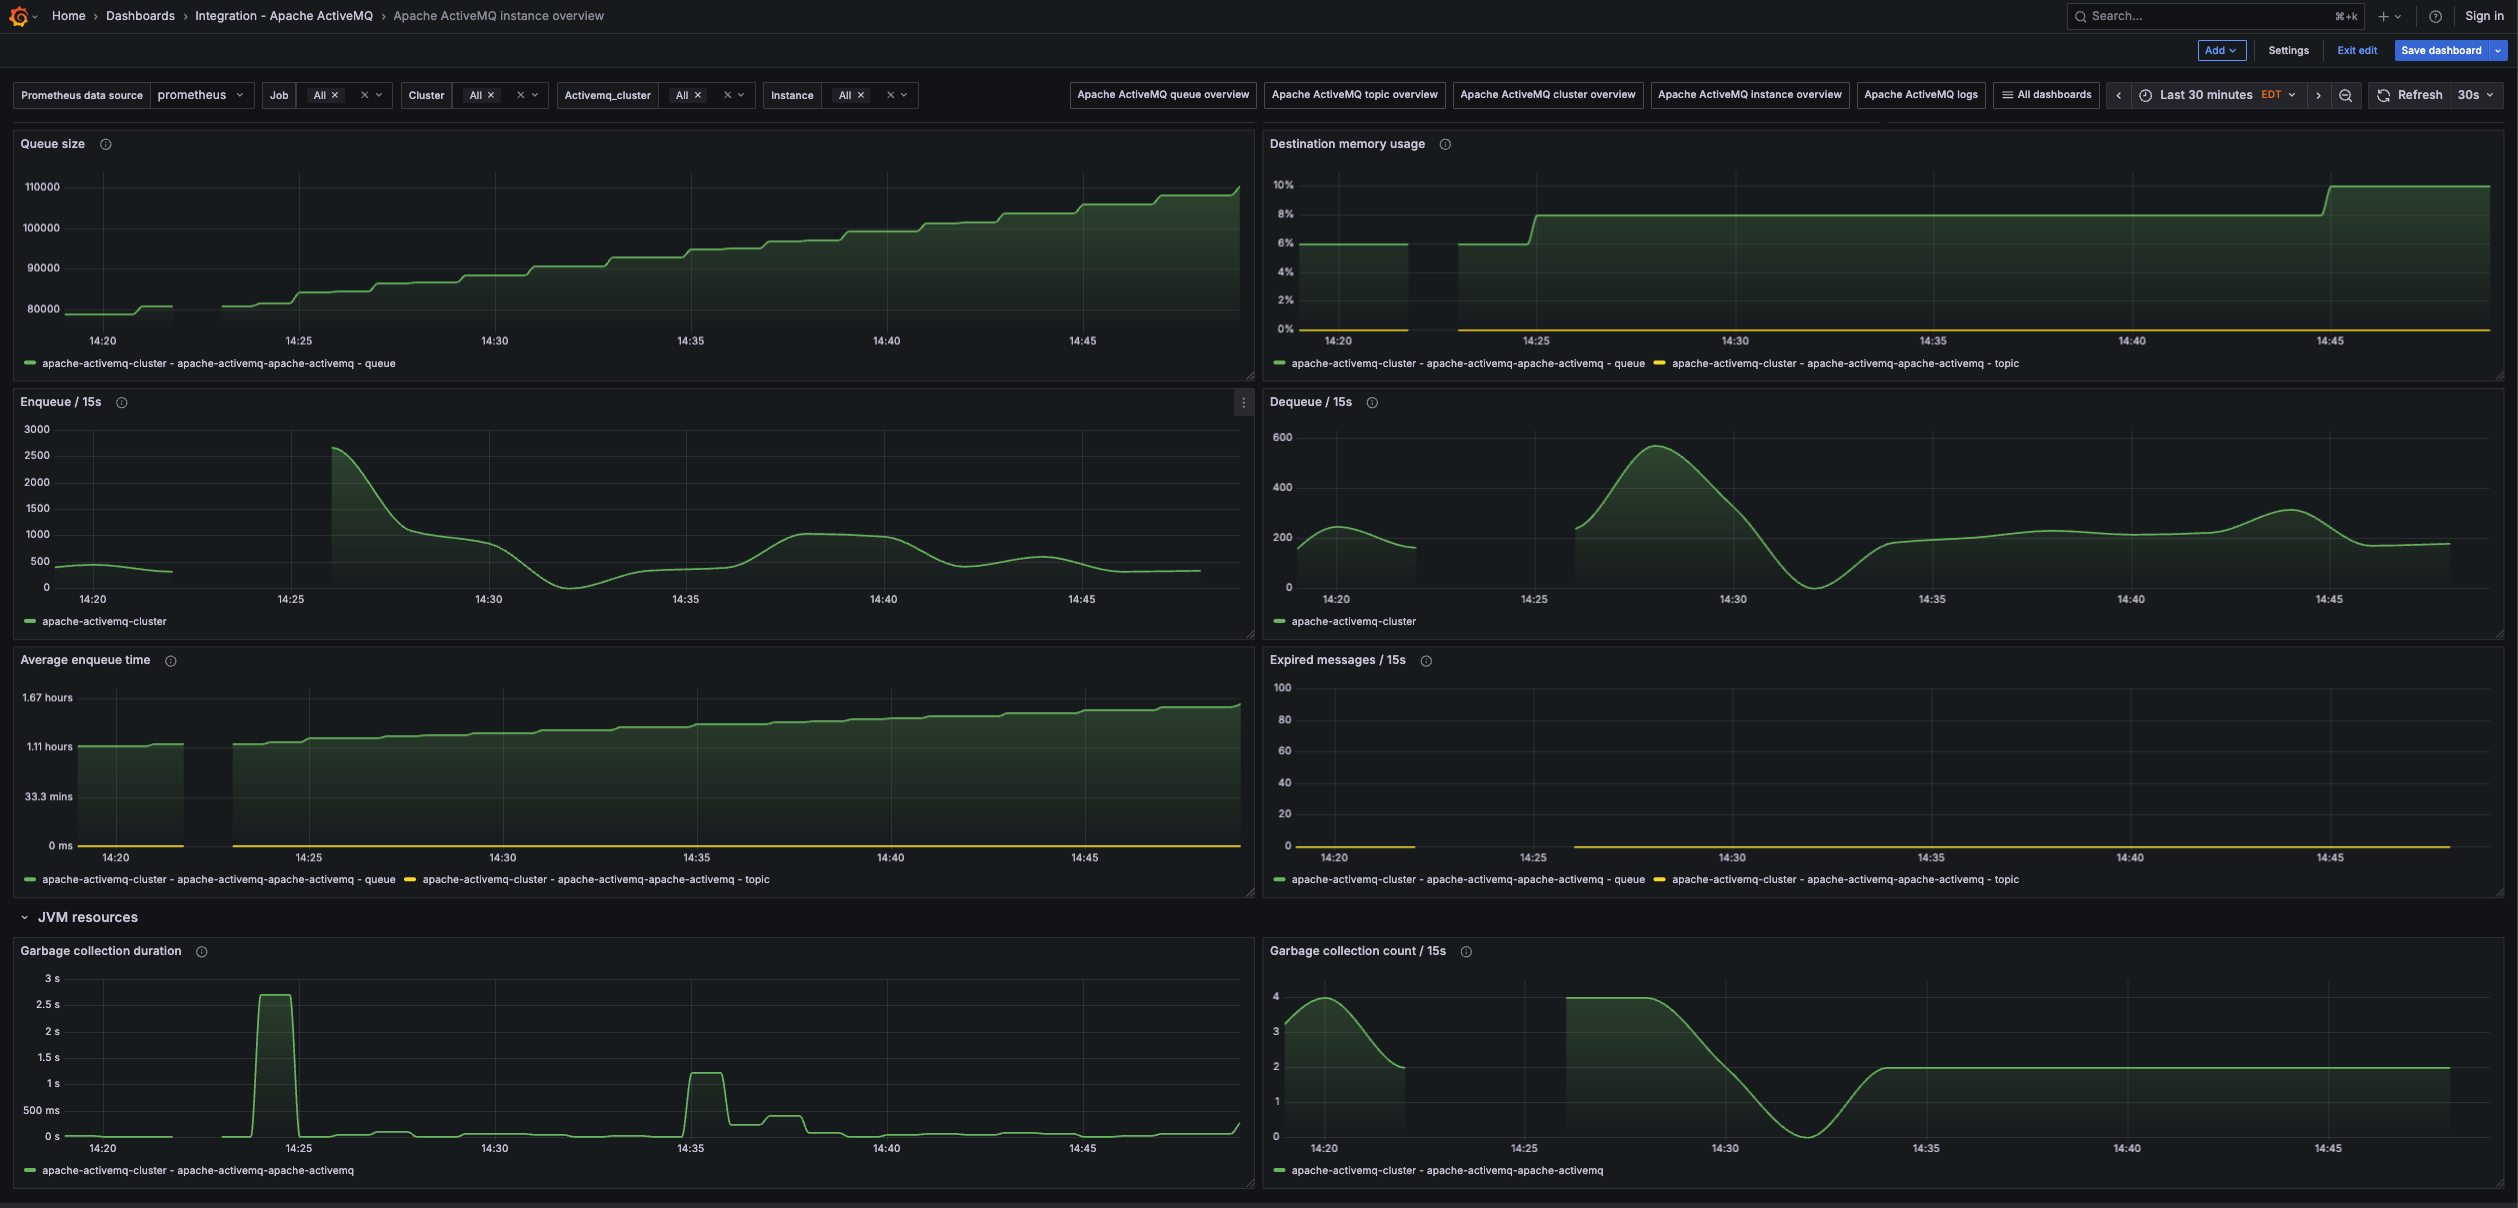
Apache ActiveMQ instance overview
Apache ActiveMQ instance overview (jvm)
Alerts
The Apache ActiveMQ integration includes the following useful alerts:
Metrics
The most important metrics provided by the Apache ActiveMQ integration, which are used on the pre-built dashboards and Prometheus alerts, are as follows:
- activemq_memory_usage_ratio
- activemq_message_total
- activemq_queue_average_enqueue_time
- activemq_queue_average_message_size
- activemq_queue_consumer_count
- activemq_queue_dequeue_count
- activemq_queue_enqueue_count
- activemq_queue_expired_count
- activemq_queue_memory_percent_usage
- activemq_queue_producer_count
- activemq_queue_queue_size
- activemq_store_usage_ratio
- activemq_temp_usage_ratio
- activemq_topic_average_enqueue_time
- activemq_topic_average_message_size
- activemq_topic_consumer_count
- activemq_topic_dequeue_count
- activemq_topic_enqueue_count
- activemq_topic_expired_count
- activemq_topic_memory_percent_usage
- activemq_topic_producer_count
- activemq_topic_queue_size
- jvm_gc_collection_count
- jvm_gc_duration_seconds
- up
Changelog
# 1.1.0 - April 2026

* Updated dashboards to follow new stylistic standards

# 1.0.1 - November 2024

- Update status panel check queries

# 1.0.0 - October 2023

- Initial release
Cost
By connecting your Apache ActiveMQ instance to Grafana Cloud, you might incur charges. To view information on the number of active series that your Grafana Cloud account uses for metrics included in each Cloud tier, see Active series and dpm usage and Cloud tier pricing.


