OpenSearch integration for Grafana Cloud
OpenSearch is an open-source project and a fork of Elasticsearch that provides a fully-featured and compatible alternative. It uses the same core technologies as Elasticsearch, including the Lucene search engine, and offers similar features such as distributed search, indexing, and analytics. This integration for Grafana Cloud allows users to monitor an OpenSearch clustered deployment with 3 separate dashboards for visualizing metric details at the cluster, node, and index levels.
This integration supports OpenSearch version 2.5.0+
This integration supports Prometheus exporter plugin for OpenSearch version 2.5.0.0+
This integration includes 12 useful alerts and 4 pre-built dashboards to help monitor and visualize OpenSearch metrics and logs.
Before you begin
In order for the integration to properly work, you must set up the Prometheus Exporter Plugin for OpenSearch.
Set up Prometheus Exporter Plugin for OpenSearch
To ensure compatibility, it is recommended that you refer to the Prometheus exporter plugins compatibility matrix and download the appropriate version based on your OpenSearch version.
You can find where to install the OpenSearch Prometheus exporter plugin by running:
sudo find / -name opensearch-pluginThis should give a location like /usr/share/opensearch/bin/opensearch-plugin which you can then change directory into with cd /usr/share/opensearch.
The Prometheus Exporter for OpenSearch version 2.5.0 can be installed via:
./bin/opensearch-plugin install https://github.com/aiven/prometheus-exporter-plugin-for-opensearch/releases/download/2.5.0.0/prometheus-exporter-2.5.0.0.zipFor more information on how to configure the Prometheus exporter plugin on each node, please refer to the Plugin Configuration documentation for further configuration details.
To validate the plugin is working correctly, Prometheus metrics should be available locally via curl:
curl http://localhost:9200/_prometheus/metricsIf you are unable to collect Prometheus metrics, then the OpenSearch configuration needs to be updated. This can be achieved by editing /etc/opensearch/opensearch.yml config.
To get running quickly, add plugins.security.disabled: true to the bottom of the file. Once this is done, OpenSearch can be restarted with sudo systemctl restart opensearch. Validate that Prometheus metrics can be collected via curl.
Install OpenSearch integration for Grafana Cloud
- In your Grafana Cloud stack, click Connections in the left-hand menu.
- Find OpenSearch and click its tile to open the integration.
- Review the prerequisites in the Configuration Details tab and set up Grafana Alloy to send OpenSearch metrics and logs to your Grafana Cloud instance.
- Click Install to add this integration’s pre-built dashboards and alerts to your Grafana Cloud instance, and you can start monitoring your OpenSearch setup.
Configuration snippets for Grafana Alloy
Advanced mode
The following snippets provide examples to guide you through the configuration process.
To instruct Grafana Alloy to scrape your OpenSearch instances, manually copy and append the snippets to your alloy configuration file, then follow subsequent instructions.
Note on the exporter plugin
The Prometheus exporter plugin provides the label
clusteron the metrics, which represents the name given to the OpenSearch cluster. The mixin is looking foropensearch_clusterand the configuration snippets will include rules for creating theopensearch_clusterlabel and dropping theclusterlabel.
Advanced metrics snippets
discovery.relabel "metrics_integrations_integrations_opensearch" {
	targets = [{
		__address__ = "<your-host-name>:9200",
	}]

	rule {
		target_label = "node"
		replacement  = constants.hostname
	}
}

prometheus.scrape "metrics_integrations_integrations_opensearch" {
	targets      = discovery.relabel.metrics_integrations_integrations_opensearch.output
	forward_to   = [prometheus.relabel.metrics_integrations_integrations_opensearch.receiver]
	job_name     = "integrations/opensearch"
	metrics_path = "/_prometheus/metrics"
}

prometheus.relabel "metrics_integrations_integrations_opensearch" {
	forward_to = [prometheus.remote_write.metrics_service.receiver]

  rule {
    action      = "labelmap"
    regex       = "cluster"
    replacement = "opensearch_cluster"
  }

  rule {
    action = "labeldrop"
    regex  = "cluster"
  }

  // Asserts-specific rules
  rule {
    target_label = "instance"
    replacement  = constants.hostname
  }

  // this should either be
  // 1. k8s deployment name
  // 2. opensearch_cluster name in case of non-k8s environment
  rule {
    target_label = "service"
    replacement = <service-name>
  }

  // this should either be
  // 1. k8s deployment name
  // 2. opensearch_cluster name in case of non-k8s environment
  rule {
    target_label = "workload"
    replacement = <workload-name>
  }

  // k8s-specific rules
  rule {
    target_label = "namespace"
    replacement  = <k8s-namespace>
  }

  rule {
    target_label = "pod"
    replacement  = constants.hostname
  }
}
To monitor your OpenSearch instance, you must use a discovery.relabel component to discover your OpenSearch Prometheus endpoint and apply appropriate labels, followed by a prometheus.scrape component to scrape it.
Configure the following properties within each discovery.relabel component:
__address__: The address to your OpenSearch Prometheus metrics endpoint.nodelabel:constants.hostnamesets theinstancelabel to your Grafana Alloy server hostname. If that is not suitable, change it to a value uniquely identifies this OpenSearch instance. Make sure this label value is the same for all telemetry data collected for this instance.opensearch_clusterlabel: The name of your OpenSearch cluster. This value should be set by the configuration usinglabelmapandlabeldropinstructions. The value originates from thecluster.namesetting in the OpenSearch configuration.
If you have multiple OpenSearch servers to scrape, configure one discovery.relabel for each and scrape them by including each under targets within the prometheus.scrape component.
Advanced logs snippets
linux
local.file_match "logs_integrations_integrations_opensearch" {
  path_targets = [{
    __address__        = "localhost",
    __path__           = "/var/log/opensearch/opensearch.log",
    job                = "integrations/opensearch",
    opensearch_cluster = "<your-cluster-name>",
    node               = constants.hostname,
  }]
}

loki.source.file "logs_integrations_integrations_opensearch" {
  targets    = local.file_match.logs_integrations_integrations_opensearch.targets
  forward_to = [loki.write.grafana_cloud_loki.receiver]
}
To monitor your OpenSearch instance logs, you will use a combination of the following components:
local.file_match defines where to find the log file to be scraped. Change the following properties according to your environment:
__address__: The OpenSearch instance address__path__: The path to the log file.nodelabel:constants.hostnamesets theinstancelabel to your Grafana Alloy server hostname. If that is not suitable, change it to a value uniquely identifies this OpenSearch instance. Make sure this label value is the same for all telemetry data collected for this instance.opensearch_clusterlabel: The name of your OpenSearch cluster.
loki.source.file sends logs to Loki.
On Linux, you will also need to add the alloy user to the opensearch group to get logs. Run the following command to configure the user as required:
sudo usermod -a -G opensearch alloyKubernetes instructions
Before you begin with Kubernetes
Please note: These instructions assume the use of the Kubernetes Monitoring Helm chart
In order for the integration to properly work, you must set up the Prometheus Exporter Plugin for OpenSearch.
Set up Prometheus Exporter Plugin for OpenSearch
To ensure compatibility, it is recommended that you refer to the Prometheus exporter plugins compatibility matrix and download the appropriate version based on your OpenSearch version.
You can find where to install the OpenSearch Prometheus exporter plugin by running:
sudo find / -name opensearch-pluginThis should give a location like /usr/share/opensearch/bin/opensearch-plugin which you can then change directory into with cd /usr/share/opensearch.
The Prometheus Exporter for OpenSearch version 2.5.0 can be installed via:
./bin/opensearch-plugin install https://github.com/aiven/prometheus-exporter-plugin-for-opensearch/releases/download/2.5.0.0/prometheus-exporter-2.5.0.0.zipFor more information on how to configure the Prometheus exporter plugin on each node, please refer to the Plugin Configuration documentation for further configuration details.
To validate the plugin is working correctly, Prometheus metrics should be available locally via curl:
curl http://localhost:9200/_prometheus/metricsIf you are unable to collect Prometheus metrics, then the OpenSearch configuration needs to be updated. This can be achieved by editing /etc/opensearch/opensearch.yml config.
To get running quickly, add plugins.security.disabled: true to the bottom of the file. Once this is done, OpenSearch can be restarted with sudo systemctl restart opensearch. Validate that Prometheus metrics can be collected via curl.
Configuration snippets for Kubernetes Helm chart
The following snippets provide examples to guide you through the configuration process.
To scrape your OpenSearch instances, manually modify your Kubernetes Monitoring Helm chart with these configuration snippets.
Replace any values between the angle brackets <> in the provided snippets with your desired configuration values.
Metrics snippets
alloy-metrics:
    extraConfig: |-
        discovery.kubernetes "opensearch_metrics" {
            role = "pod"
            selectors {
                role = "pod"
                label = "<opensearch_pod_label_name>=<opensearch_pod_label_value>"
            }
        }

        discovery.relabel "opensearch_metrics" {
            targets = discovery.kubernetes.opensearch_metrics.targets

            rule {
                source_labels = ["__address__"]
                regex         = "([^:]+)(:[0-9]+)?"
                target_label  = "instance"
                replacement   = "\${1}"
            }
        }

        prometheus.scrape "opensearch_metrics" {
            targets      = discovery.relabel.opensearch_metrics.output
            metrics_path = "/monitoring/prometheus/metrics"
            job_name     = "integrations/opensearch"
            forward_to   = [prometheus.relabel.integrations_opensearch_cluster_label.receiver]
        }

        prometheus.relabel "integrations_opensearch_cluster_label" {
            rule {
                action      = "labelmap"
                regex       = "cluster"
                replacement = "opensearch_cluster"
            }

            rule {
                action = "labeldrop"
                regex  = "cluster"
            }

            forward_to = [prometheus.remote_write.grafana_cloud_metrics.receiver]
        }
Logs snippets
podLogs:
    extraDiscoveryRules: |-
        rule {
            source_labels = ["__meta_kubernetes_namespace", "__meta_kubernetes_pod_name"]
            separator     = ":"
            regex         = "(<opensearch_namespace>:opensearch.*)"
            replacement   = "opensearch"
            target_label  = "integration"
        }

        rule {
            source_labels = ["integration", "__meta_kubernetes_pod_ip"]
            separator = ":"
            regex = "opensearch:(.*)"
            target_label = "instance"
        }

        rule {
            source_labels = ["integration", "__meta_kubernetes_pod_node_name"]
            separator = ":"
            regex = "opensearch:(.*)"
            target_label = "node"
        }

        rule {
            source_labels = ["integration"]
            regex = "opensearch"
            replacement = "integrations/opensearch"
            target_label = "job"
        }

        rule {
            source_labels = ["integration"]
            regex = "opensearch"
            replacement = "<your-opensearch-cluster-name>"
            target_label = "opensearch_cluster"
        }
Dashboards
The OpenSearch integration installs the following dashboards in your Grafana Cloud instance to help monitor your system.
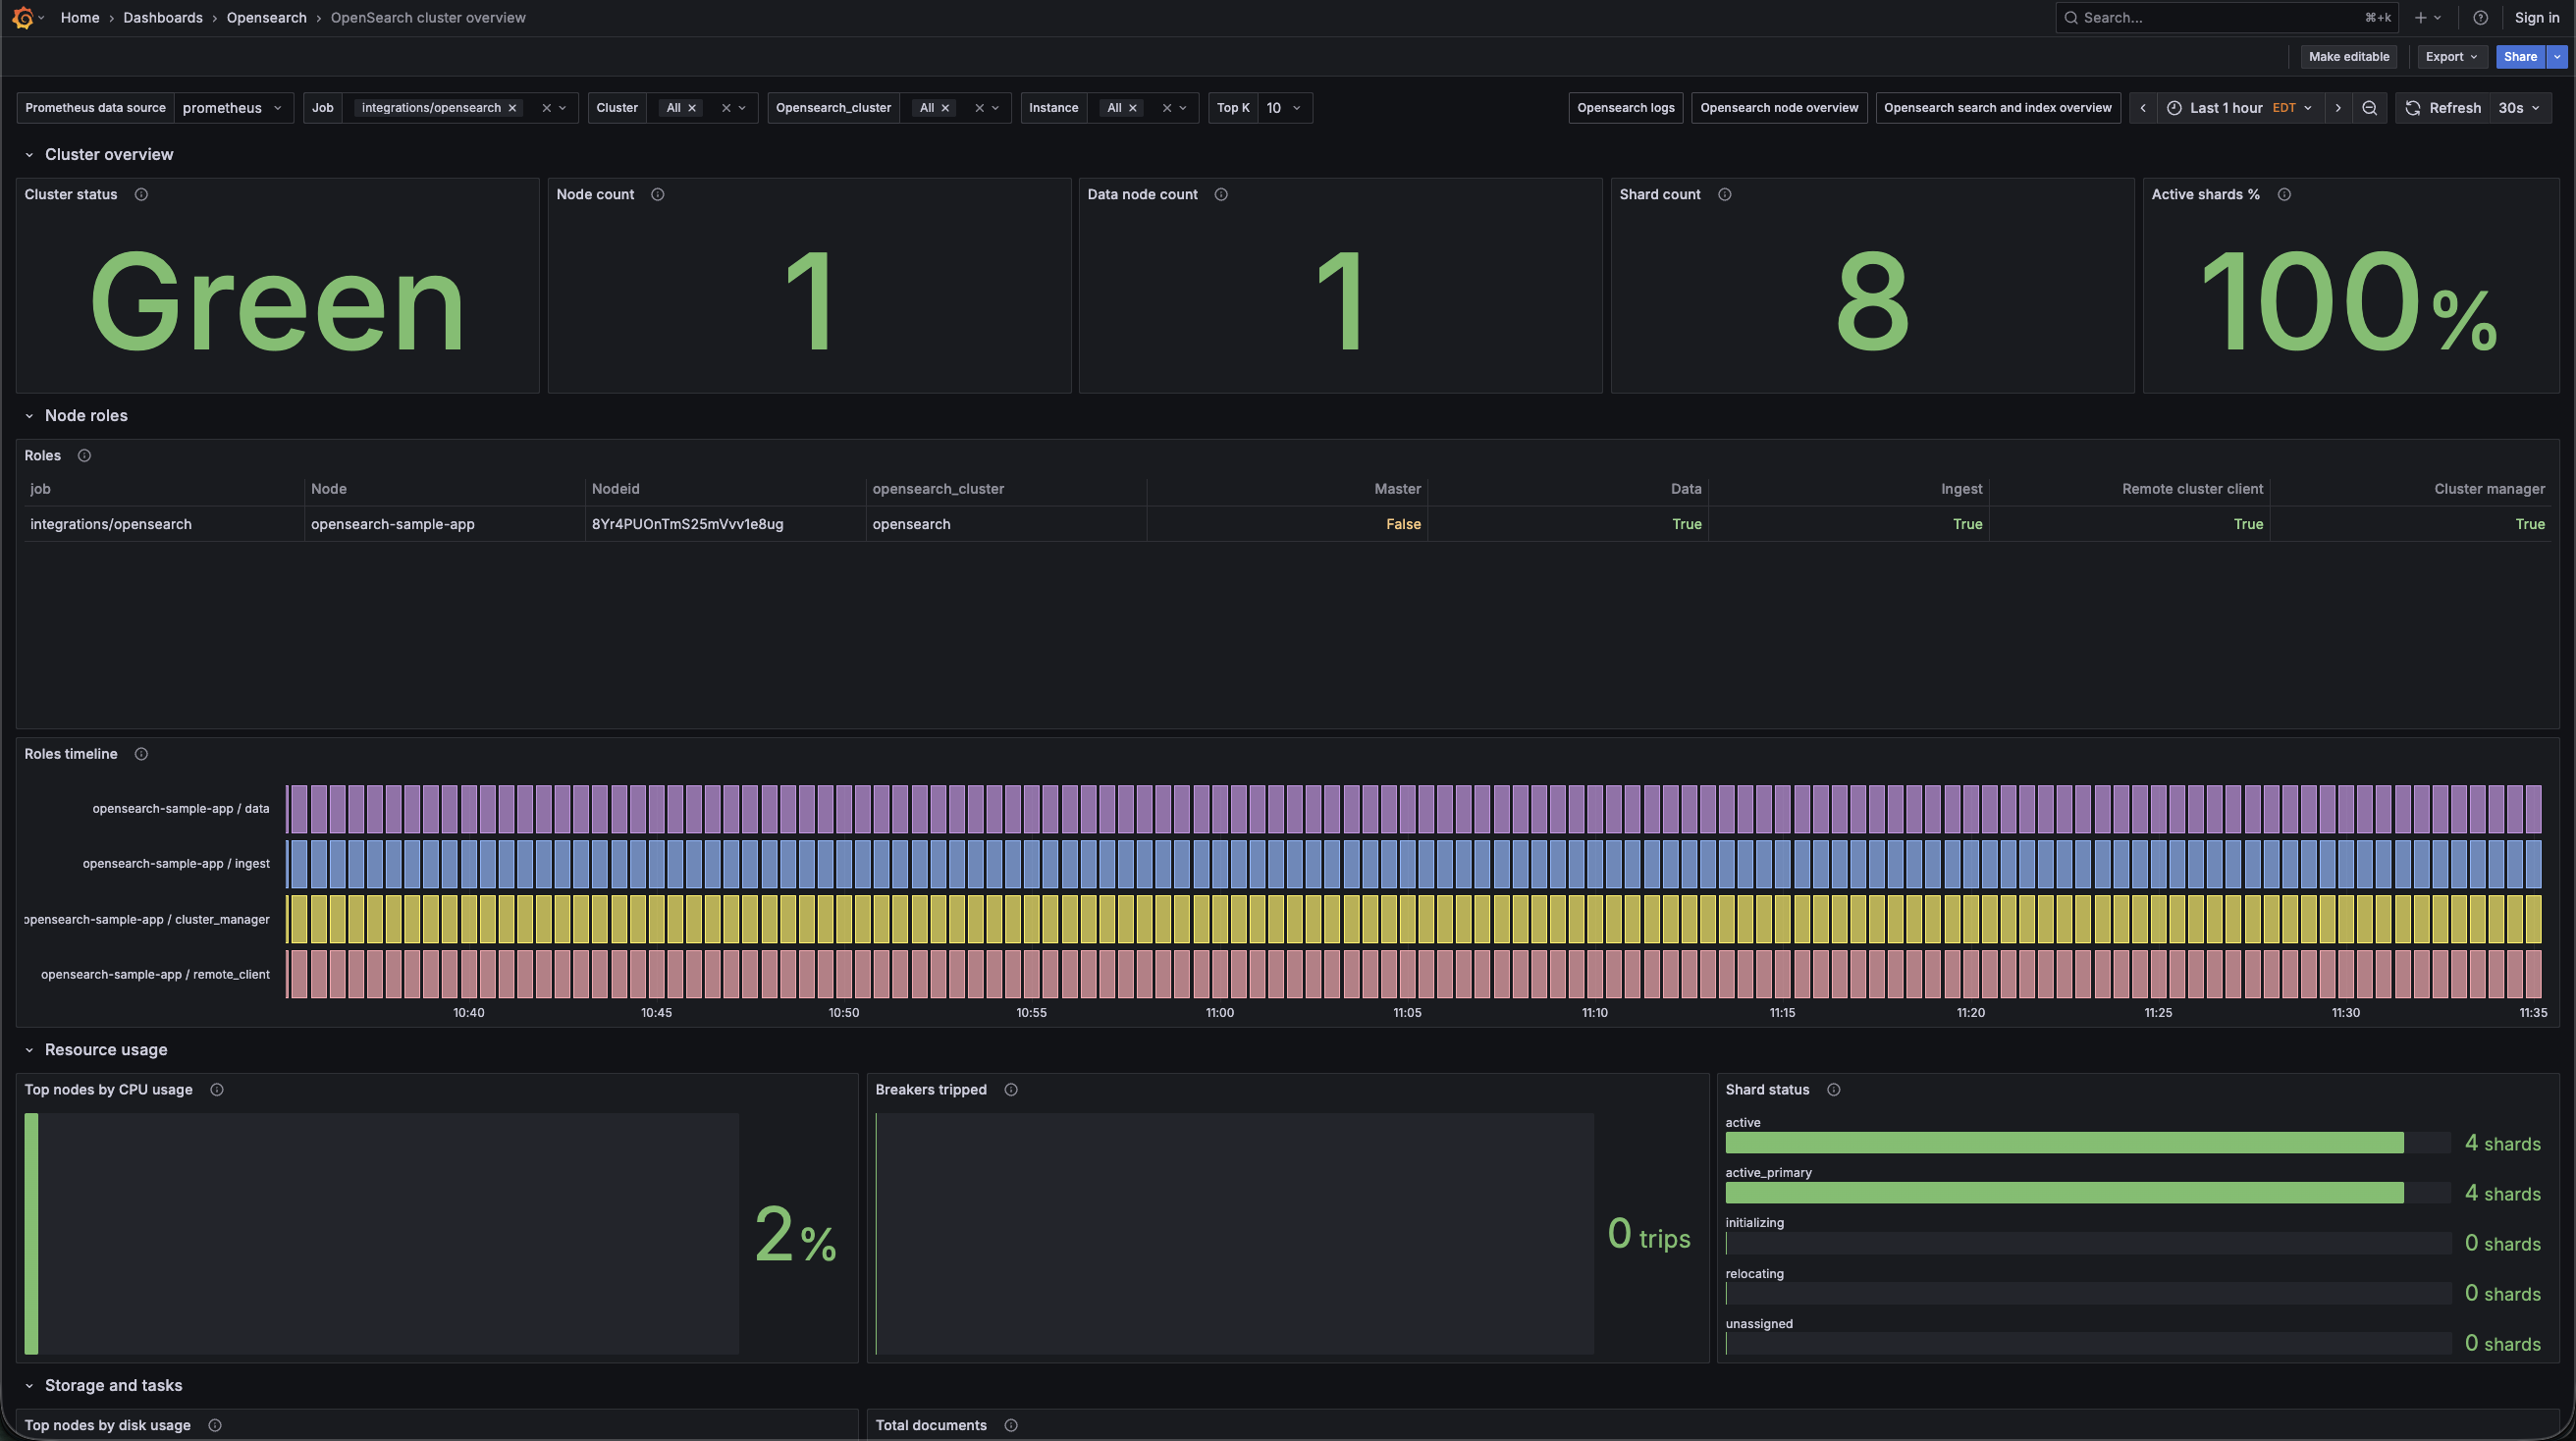
- OpenSearch cluster overview
- OpenSearch logs
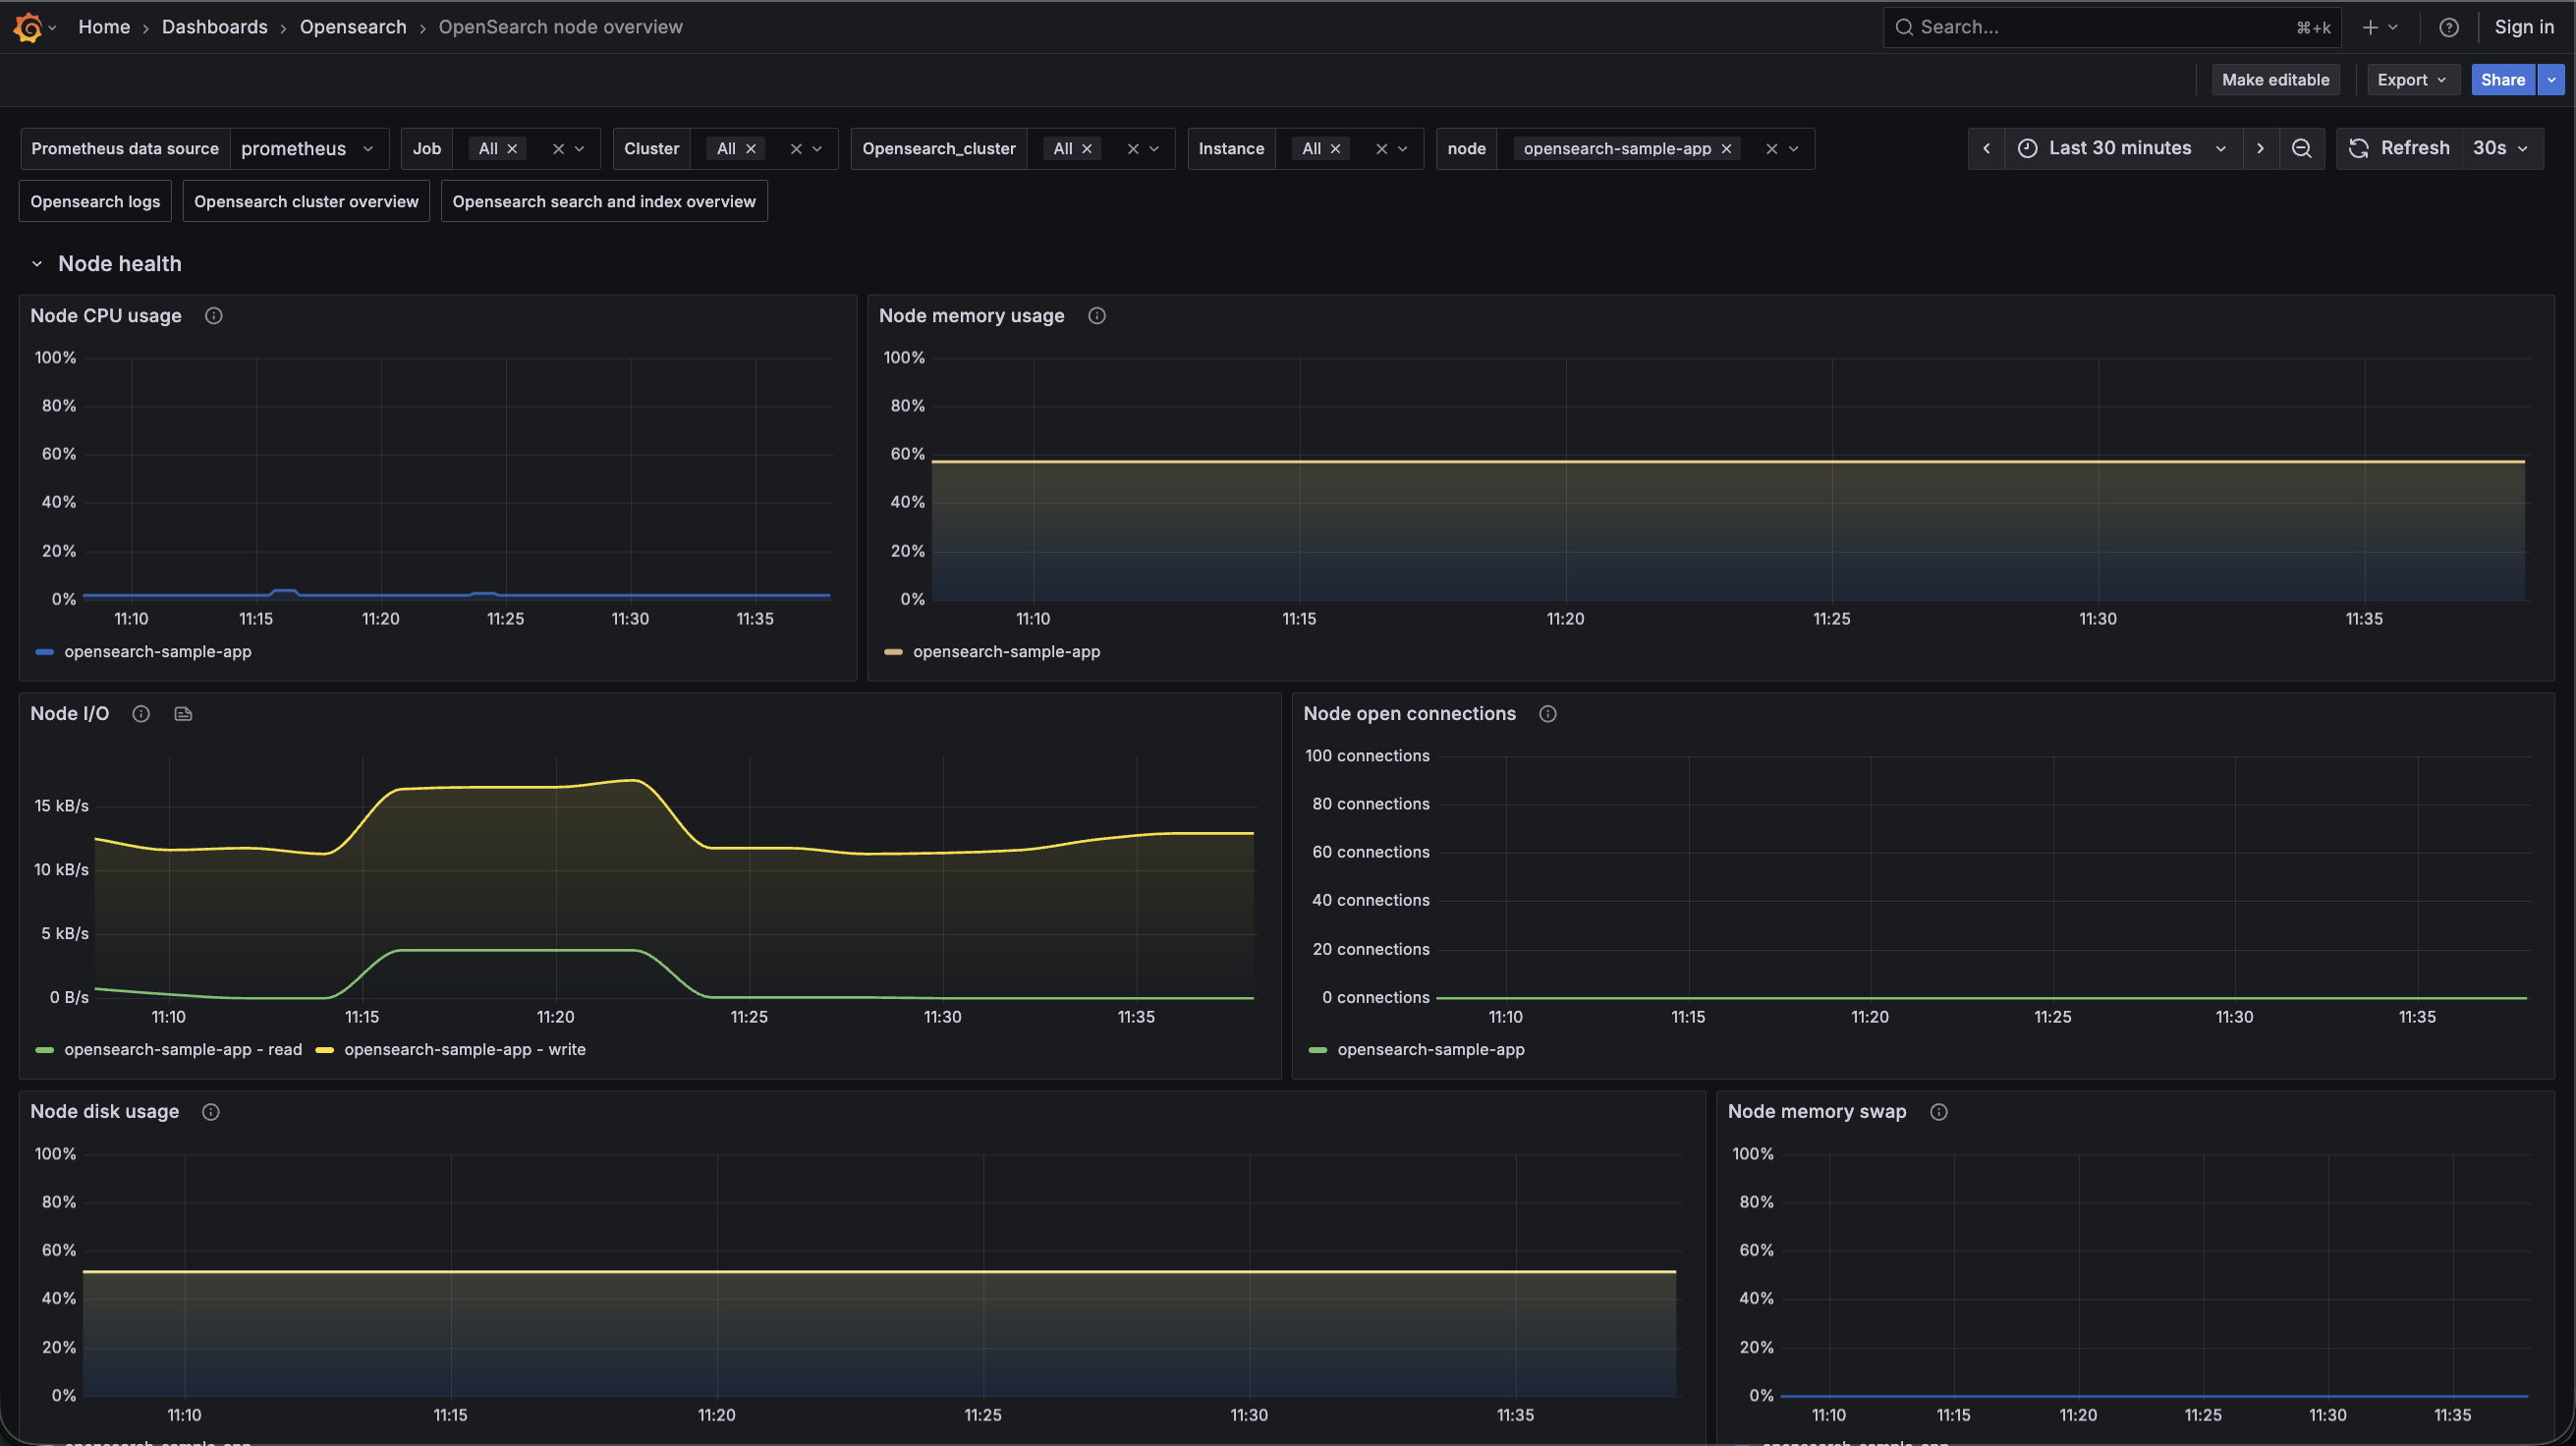
- OpenSearch node overview
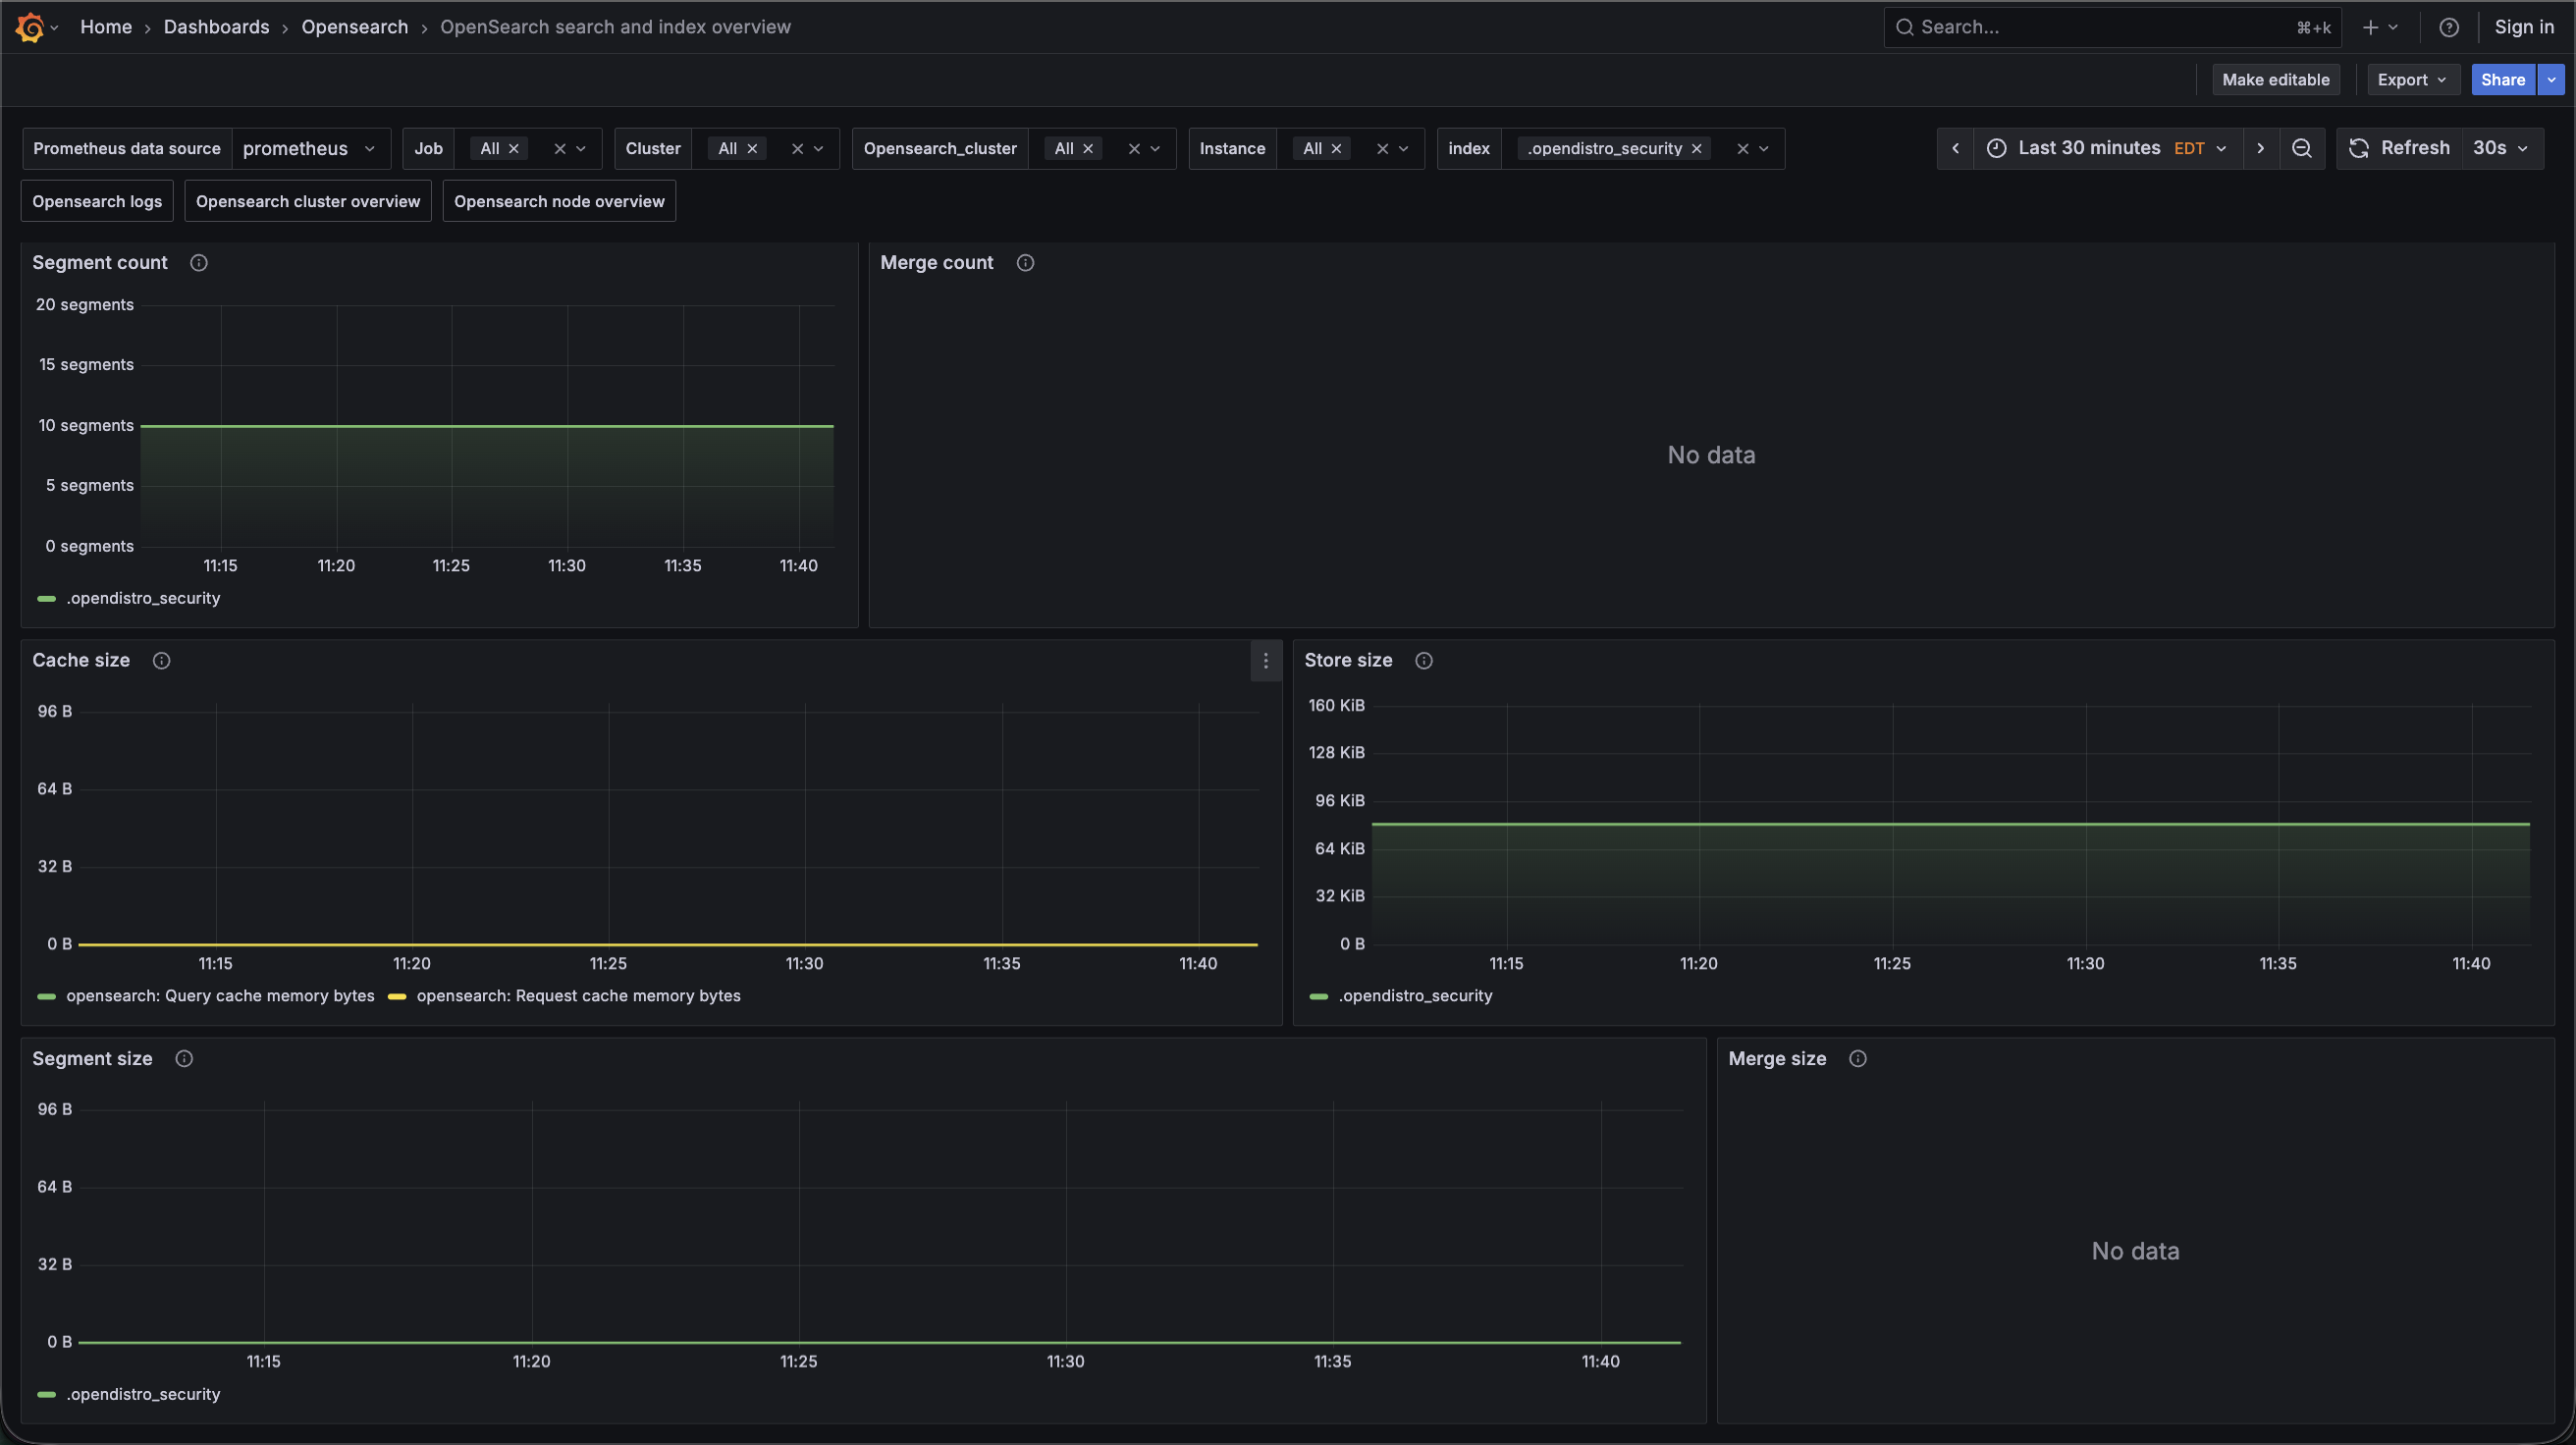
- OpenSearch search and index overview
OpenSearch Cluster Overview Dashboard 1
OpenSearch Node Overview Dashboard 1
OpenSearch Search and Index Overview Dashboard 1
Alerts
The OpenSearch integration includes the following useful alerts:
Metrics
The most important metrics provided by the OpenSearch integration, which are used on the pre-built dashboards and Prometheus alerts, are as follows:
- opensearch_circuitbreaker_tripped_count
- opensearch_cluster_datanodes_number
- opensearch_cluster_nodes_number
- opensearch_cluster_pending_tasks_number
- opensearch_cluster_shards_active_percent
- opensearch_cluster_shards_number
- opensearch_cluster_status
- opensearch_cluster_task_max_waiting_time_seconds
- opensearch_fs_io_total_read_bytes
- opensearch_fs_io_total_write_bytes
- opensearch_fs_path_free_bytes
- opensearch_fs_path_total_bytes
- opensearch_index_fielddata_evictions_count
- opensearch_index_flush_total_count
- opensearch_index_flush_total_time_seconds
- opensearch_index_indexing_delete_current_number
- opensearch_index_indexing_index_count
- opensearch_index_indexing_index_current_number
- opensearch_index_indexing_index_failed_count
- opensearch_index_indexing_index_time_seconds
- opensearch_index_merges_current_size_bytes
- opensearch_index_merges_total_docs_count
- opensearch_index_merges_total_stopped_time_seconds
- opensearch_index_merges_total_throttled_time_seconds
- opensearch_index_merges_total_time_seconds
- opensearch_index_querycache_evictions_count
- opensearch_index_querycache_hit_count
- opensearch_index_querycache_memory_size_bytes
- opensearch_index_querycache_miss_number
- opensearch_index_refresh_total_count
- opensearch_index_refresh_total_time_seconds
- opensearch_index_requestcache_evictions_count
- opensearch_index_requestcache_hit_count
- opensearch_index_requestcache_memory_size_bytes
- opensearch_index_requestcache_miss_count
- opensearch_index_search_fetch_count
- opensearch_index_search_fetch_current_number
- opensearch_index_search_fetch_time_seconds
- opensearch_index_search_query_count
- opensearch_index_search_query_current_number
- opensearch_index_search_query_time_seconds
- opensearch_index_search_scroll_count
- opensearch_index_search_scroll_current_number
- opensearch_index_search_scroll_time_seconds
- opensearch_index_segments_memory_bytes
- opensearch_index_segments_number
- opensearch_index_shards_number
- opensearch_index_store_size_bytes
- opensearch_index_translog_operations_number
- opensearch_indices_indexing_index_count
- opensearch_indices_store_size_bytes
- opensearch_jvm_bufferpool_number
- opensearch_jvm_bufferpool_total_capacity_bytes
- opensearch_jvm_bufferpool_used_bytes
- opensearch_jvm_gc_collection_count
- opensearch_jvm_gc_collection_time_seconds
- opensearch_jvm_mem_heap_committed_bytes
- opensearch_jvm_mem_heap_used_bytes
- opensearch_jvm_mem_nonheap_committed_bytes
- opensearch_jvm_mem_nonheap_used_bytes
- opensearch_jvm_threads_number
- opensearch_jvm_uptime_seconds
- opensearch_node_role_bool
- opensearch_os_cpu_percent
- opensearch_os_mem_used_percent
- opensearch_os_swap_free_bytes
- opensearch_os_swap_used_bytes
- opensearch_threadpool_tasks_number
- opensearch_threadpool_threads_number
- opensearch_transport_rx_bytes_count
- opensearch_transport_server_open_number
- opensearch_transport_tx_bytes_count
- up
Changelog
# 1.2.1 - June 2026

* Fixed issue with default filtering selectors

# 1.2.0 - April 2026

* Updated dashboards to follow new stylistic standards

# 1.1.0 - April 2025

* Add Asserts support. Alloy metrics configuration was updated to include Asserts-specific labels.

# 1.0.0 - September 2024

* Update alert names

# 0.0.2 - August 2023

* Add regex filter for logs datasource

# 0.0.1 - May 2023

* Initial release
Cost
By connecting your OpenSearch instance to Grafana Cloud, you might incur charges. To view information on the number of active series that your Grafana Cloud account uses for metrics included in each Cloud tier, see Active series and dpm usage and Cloud tier pricing.


