
Install Grafana Agent on a Linux host using Ansible
Caution
Grafana Alloy is the new name for our distribution of the OTel collector. Grafana Agent has been deprecated and is in Long-Term Support (LTS) through October 31, 2025. Grafana Agent will reach an End-of-Life (EOL) on November 1, 2025. Read more about why we recommend migrating to Grafana Alloy.
This guide shows how to install Grafana Agent on a Linux host using Ansible and to use it to push logs to Grafana Cloud.
Before you begin
Before you begin, you should have the following available:
- A Grafana Cloud account.
- A Linux machine
- Command line (terminal) access to that Linux machine with
unzipbinary installed - Account permissions sufficient to install and use Grafana Agent on the Linux machine
- Ansible installed on the Linux machine
Choose your Grafana Agent installation method
This guide covers two methods for installing and configuring Grafana Agent using Ansible:
- Installing Grafana Agent in Flow mode
- Installing Grafana Agent in static mode
Depending on your specific needs and the configuration of your environment, you may choose one method over the other for better compatibility or ease of setup.
Install Grafana Agent in flow mode using Ansible
This Ansible playbook installs Grafana Agent in Flow mode and also creates a systemd service to manage it.
It creates a user named grafana-agent on the Linux machine for running Grafana Agent.
- Create a file named
grafana-agent.ymland add the following:
- name: Install Grafana Agent Flow
  hosts: all
  become: true
  tasks:
    - name: Install Grafana Agent Flow
      ansible.builtin.include_role:
        name: grafana.grafana.grafana_agent
      vars:
        grafana_agent_mode: flow
        # Change config file on the host to .river
        grafana_agent_config_filename: config.river
        # Change config file to be copied
        grafana_agent_provisioned_config_file: '<path-to-config-file>'
        # Remove default flags
        grafana_agent_flags_extra:
          server.http.listen-addr: '0.0.0.0:12345'
Replace the following field values:
<path-to-config-file-on-localhost>with the path to river configuration file on the Ansible Controller (Localhost).
Install Grafana Agent in static mode using Ansible
This Ansible playbook installs Grafana Agent in static mode and also creates a systemd service to manage it.
It creates a user named grafana-agent on the Linux machine for running Grafana Agent.
- Create a file named
grafana-agent.ymland add the following:
- name: Install Grafana Agent in static mode
  hosts: all
  become: true

  vars:
    grafana_cloud_api_key: <Your Cloud Access Policy token> # Example - glc_eyJrIjoiYjI3NjI5MGQxZTcyOTIxYTc0MDgzMGVhNDhlODNhYzA5OTk2Y2U5YiIsIm4iOiJhbnNpYmxldGVzdCIsImlkIjo2NTI5
    logs_username: <loki-username> # Example - 411478
    loki_url: <loki-push-url> # Example - https://logs-prod-017.grafana.net/loki/api/v1/push
  tasks:
    - name: Install Grafana Agent in static mode
      ansible.builtin.include_role:
        name: grafana_agent
      vars:
        grafana_agent_logs_config:
          configs:
            - clients:
                - basic_auth:
                    password: '{{ grafana_cloud_api_key }}'
                    username: '{{ logs_username }}'
                  url: '{{ loki_url }}'
              name: default
              positions:
                filename: /tmp/positions.yaml
              scrape_configs:
                - job_name: integrations/node_exporter_direct_scrape
                  static_configs:
                    - targets:
                        - localhost
                      labels:
                        instance: hostname
                        __path__: /var/log/*.log
                        job: integrations/node_exporter
              target_config:
                sync_period: 10s
Replace the following field values:
<Your Cloud Access Policy token>with a token from the Cloud Access Policy you created in the Grafana Cloud portal.<loki-username>with the Loki Username<loki-push-url>with the push endpoint URL of Loki Instance
Run the Ansible playbook on the Linux machine
In the Linux machine’s terminal, run the following command from the directory where the Ansible playbook is located.
ansible-playbook grafana-agent.ymlValidate
- Grafana Agent service on the Linux machine should be
activeandrunning. You should see a similar output:
$ sudo systemctl status grafana-agent.service
grafana-agent.service - Grafana Agent
Loaded: loaded (/etc/systemd/system/grafana-agent.service; enabled; vendor preset: enabled)
Active: active (running) since Wed 2022-07-20 09:56:15 UTC; 36s ago
Main PID: 3176 (agent-linux-amd)
Tasks: 8 (limit: 515)
Memory: 92.5M
CPU: 380ms
CGroup: /system.slice/grafana-agent.service
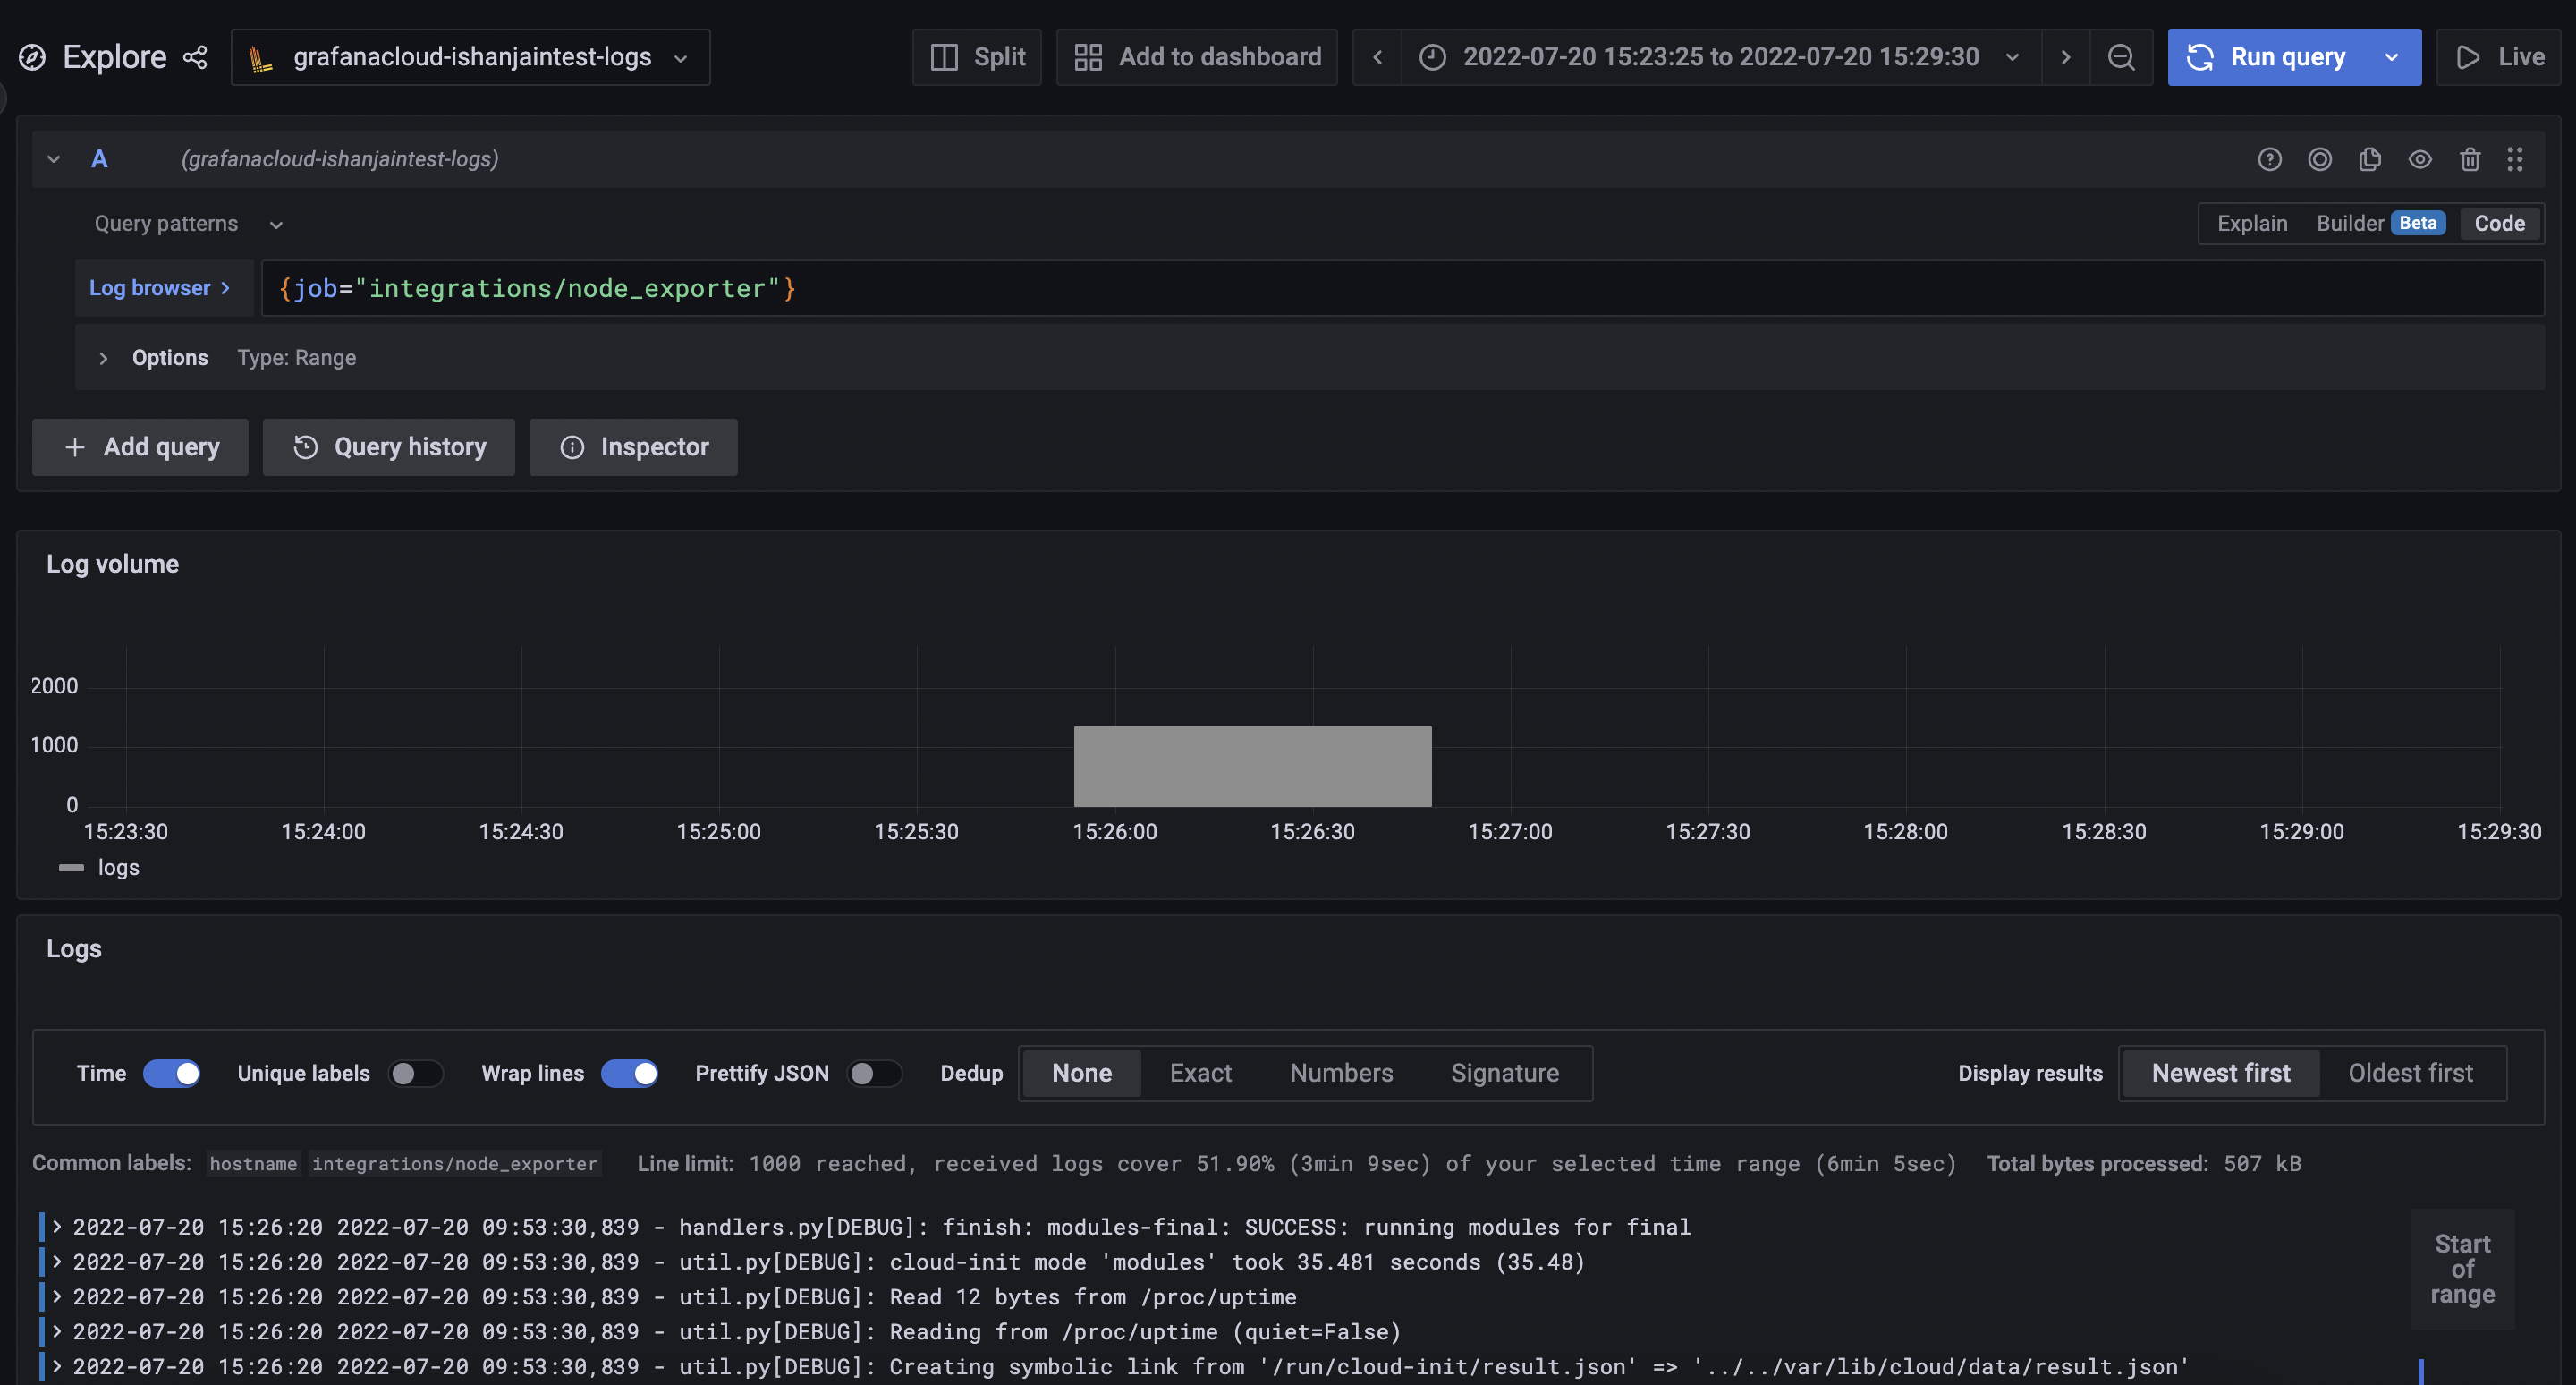
└─3176 /usr/local/bin/agent-linux-amd64 --config.file=/etc/grafana-cloud/agent-config.yamlIn a Grafana Cloud stack, click Explore in the left-side menu.
At the top of the page, use the dropdown menu to select your Loki logs data source. In the Log Browser, run the query
{job="integrations/node_exporter"}![Loki Logs]()
Summary
In this guide, you installed Grafana Agent on a Linux node using Ansible and used it to pushed logs to Grafana Cloud.
To learn more about the Grafana Ansible collection, refer to the GitHub repository or its documentation.
Was this page helpful?
Related resources from Grafana Labs


