Manage thresholds
The knowledge graph includes predefined alerts that fire when they breach a specified threshold. A threshold is a value that you set for an insight, and when a value reaches or surpasses a threshold, it triggers the insight to fire.
This topic explains the different types of insights thresholds, how to edit them, and how to create request, resource, and health thresholds.
Understand thresholds
The knowledge graph divides threshold configurations into request, resource, and health thresholds and organizes each group by insight types.
Request and resource thresholds
Request and resource predefined thresholds are general and apply to all components. For example, the saturation alert for resources applies to disks, CPU, and memory. The default CPU threshold set by the knowledge graph is 60% for Warning and 80% for Critical. While most predefined thresholds might meet your business needs, there could be times when you want to adjust a request or resource threshold so that an assertion fires more or less frequently.
For example, the asserts:error:ratio:threshold_by_stddev threshold of the ErrorRatioAnomaly insight is 2. This means that an error ratio anomaly insight fires when it’s two standard deviations above the normalized mean.
However, if you determine that two standard deviations is never breached and instead want the insight to fire when the standard deviation is 1.5, you can update the predefined threshold. You can also define your own threshold if the predefined thresholds don’t meet your needs.
If you need a different threshold for a specific workload, you can create a rule for that workload instead of modifying the threshold for all resources.
Request thresholds
Request thresholds include rate, latency, and error insights.
- The knowledge graph checks each Anomaly against a dynamic range that combines standard deviation and percentage change. Daily and weekly seasonal differences are considered. A sparseness check reduces noise on sparse requests.
- Each Breach is checked against a static threshold. ErrorLogSpike is treated as a breach assertion.
- Client Errors are treated as anomalies, and so follow the anomaly algorithms.
- Server Errors are tracked with an error budget approach, so they’re controlled by fast-burn or slow-burn factors.
Resource thresholds
Resource thresholds include CPU, memory, disk, and network insights.
- Each Saturation works with two static thresholds, one for warning and one for critical.
- Some resources like disk have rate metrics (bytes read/write), so there are ResourceRateAnomaly and ResourceRateBreach assertions. They follow the same approach as their request counterparts.
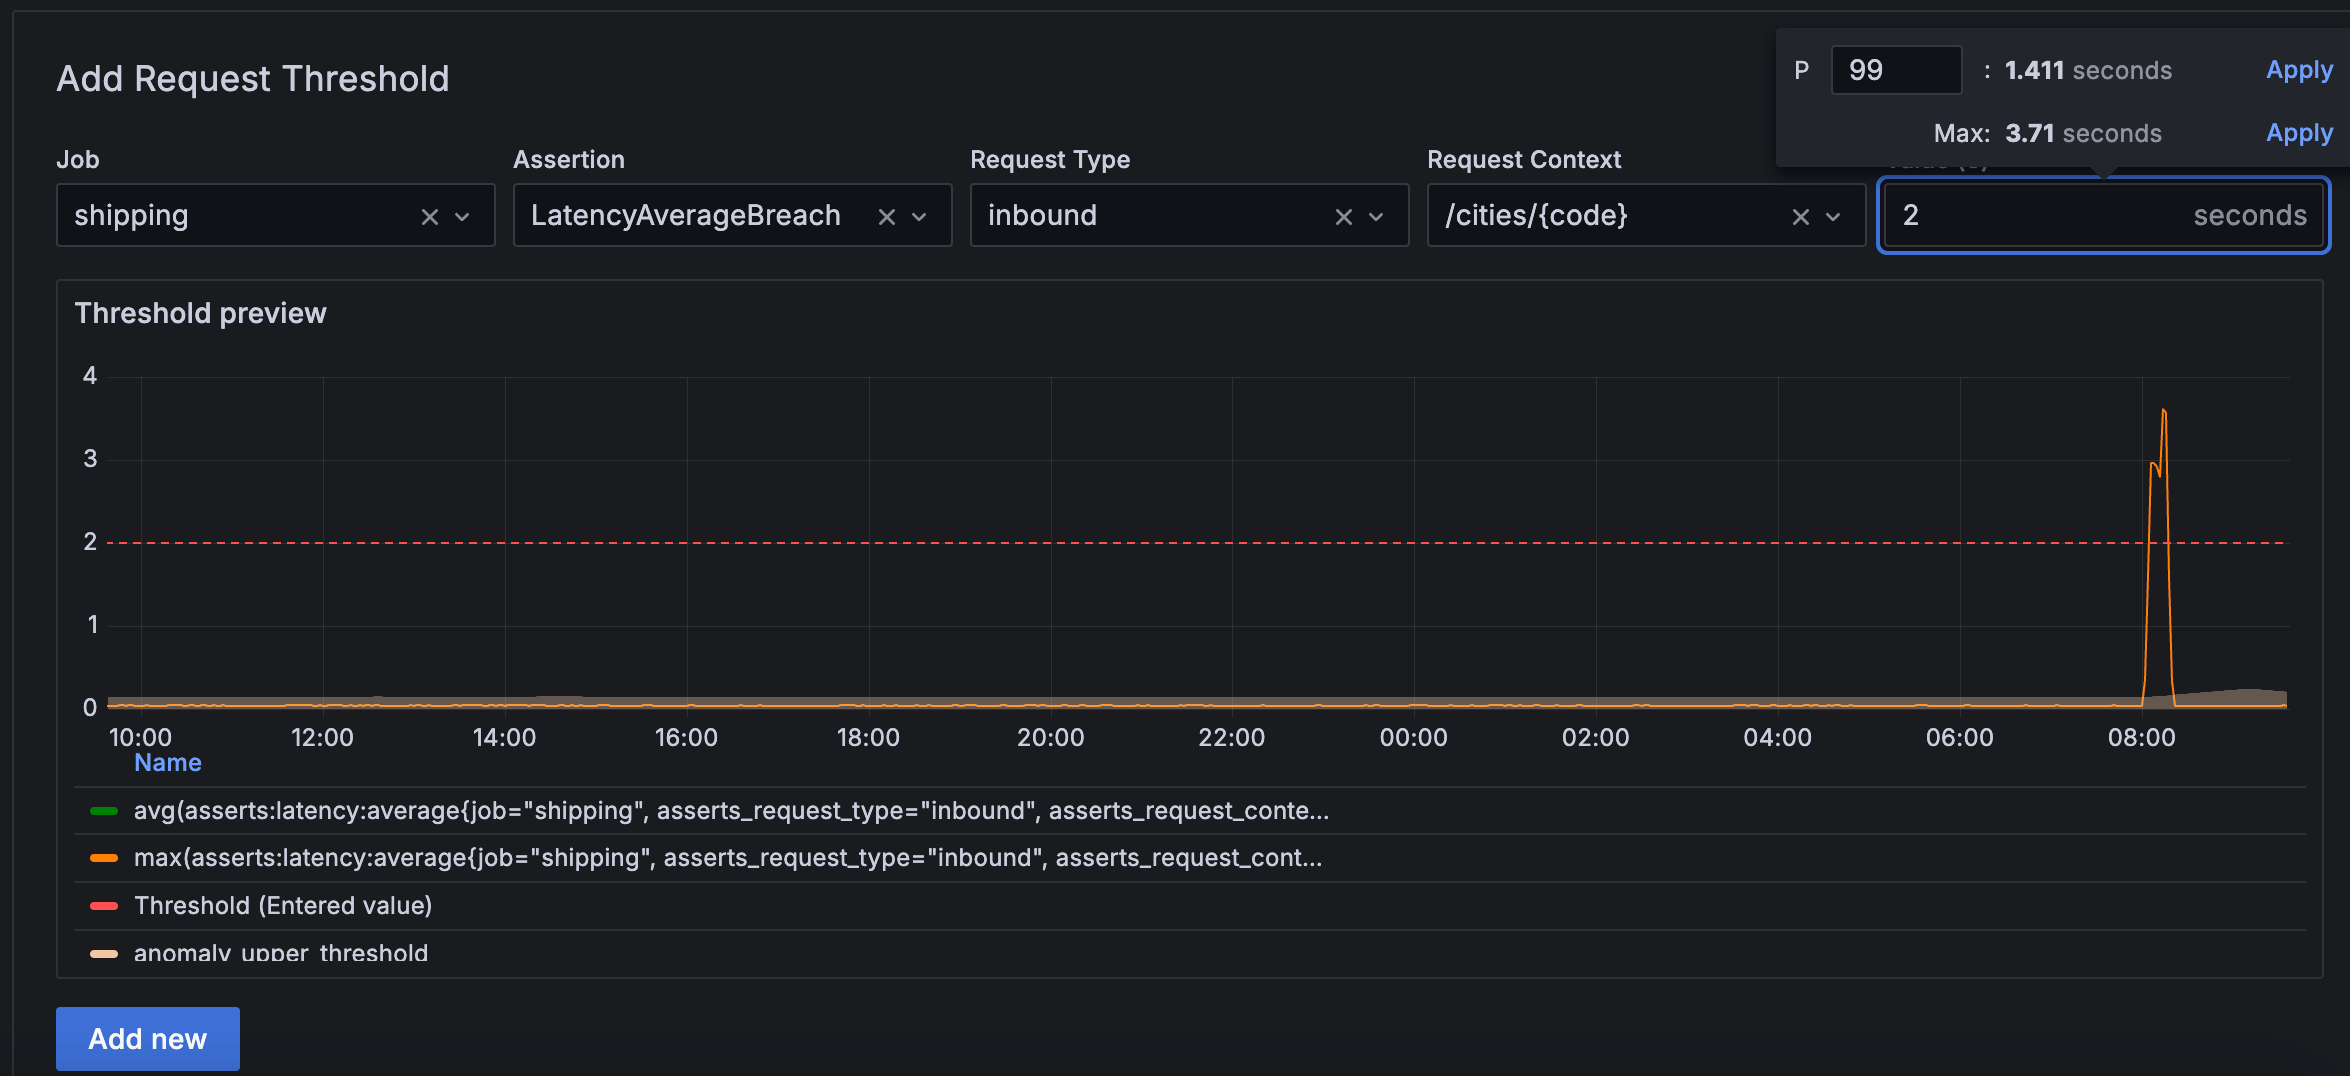
Example
The following example shows a latency average breach insight that fires when an inbound request from the /cities/{code} API to the shipping service exceeds 2 seconds.
Health thresholds
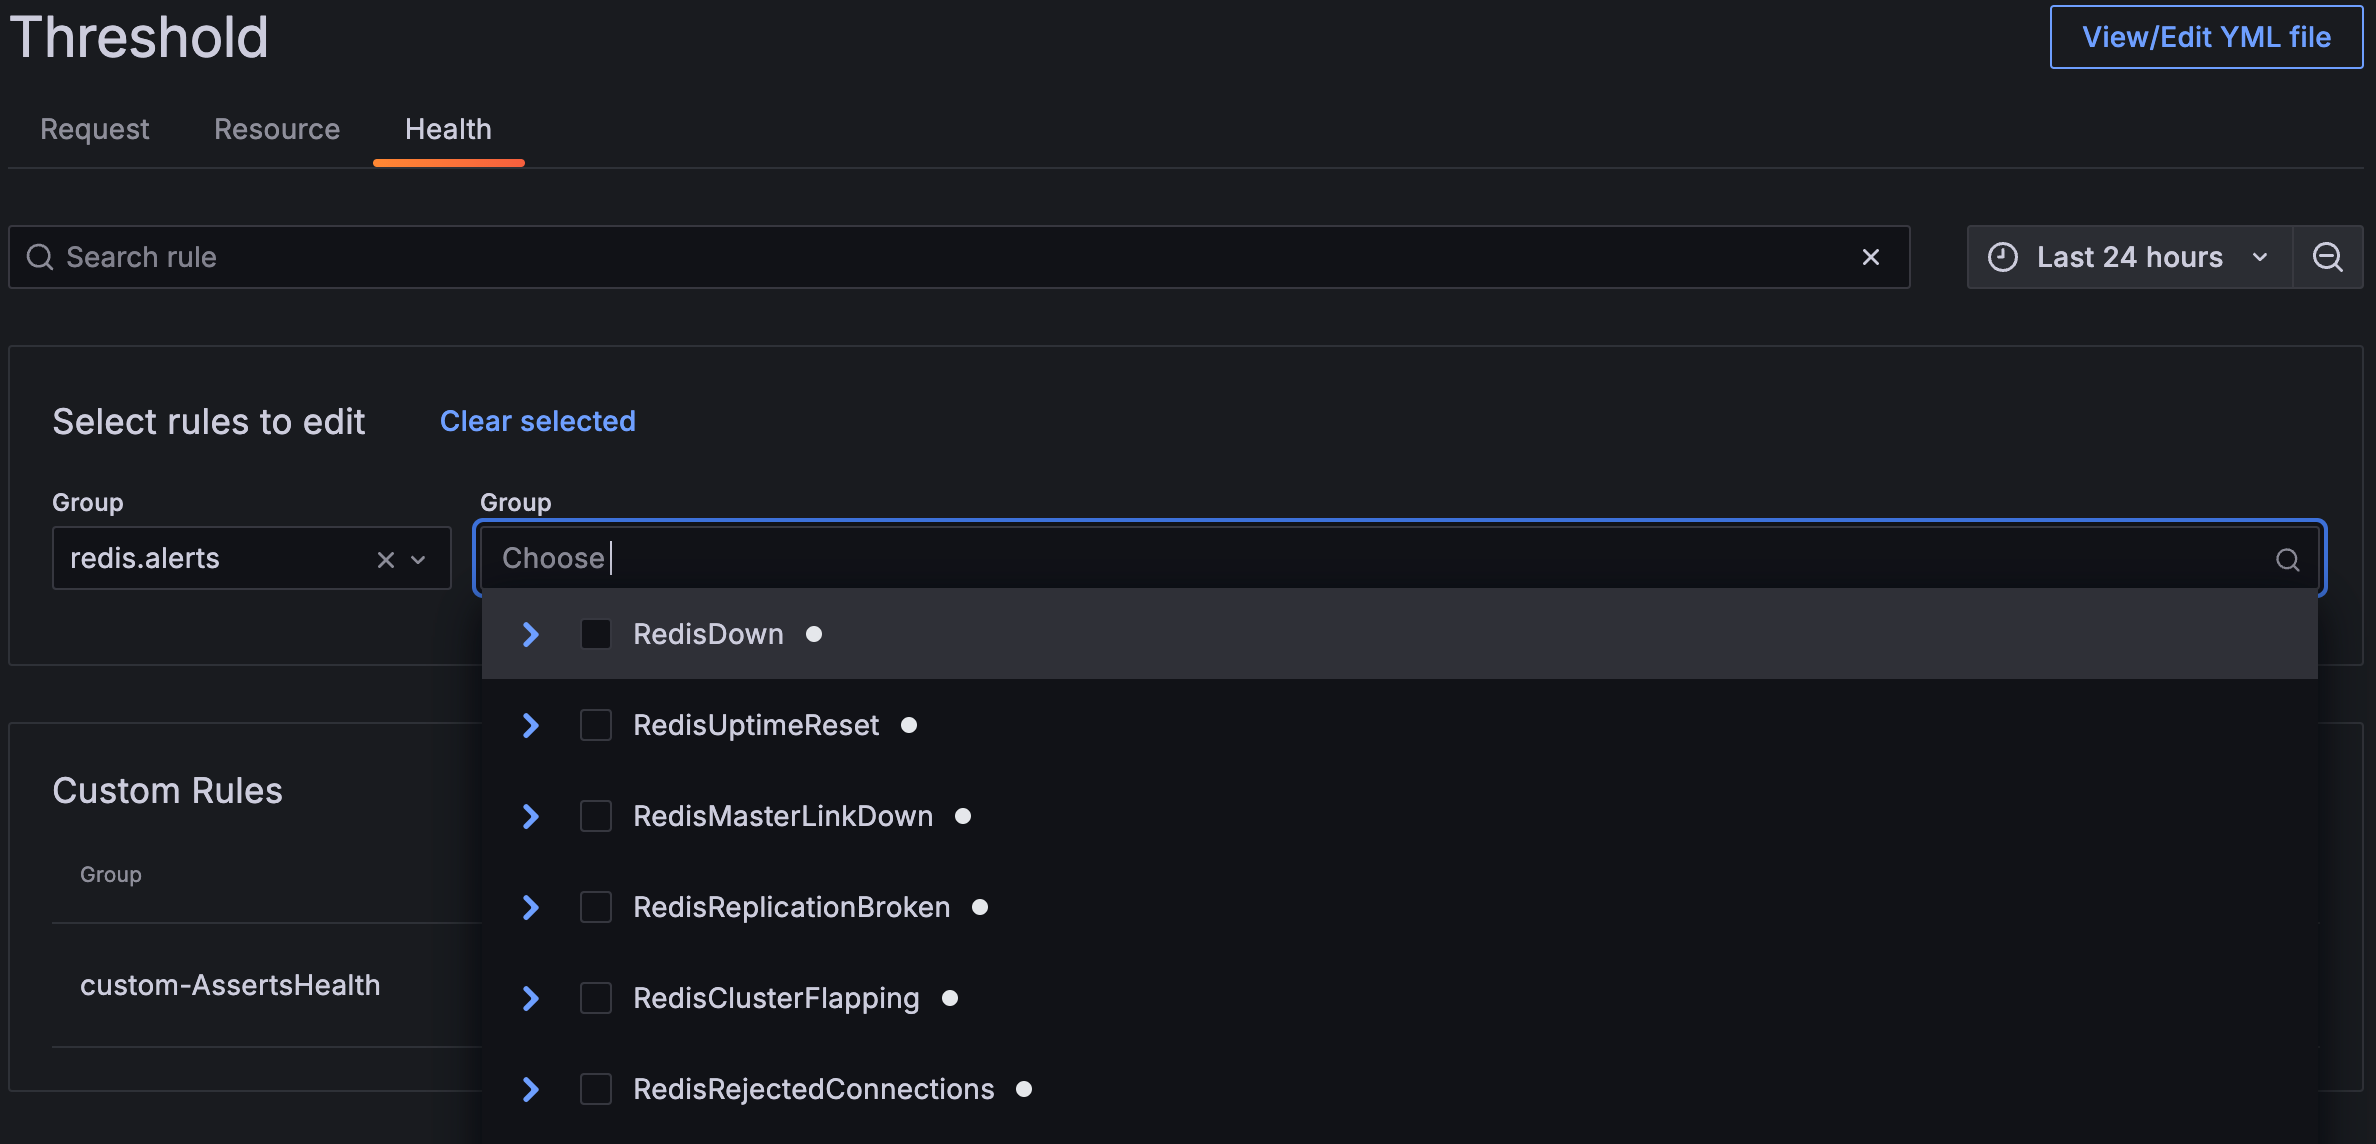
The knowledge graph includes a library of health metric thresholds grouped by vendor. When you bring your data into Grafana Cloud, the knowledge graph understands which Prometheus metrics your system captures, and the corresponding health thresholds are made available.
For example, if you use Redis, after you bring your data into Grafana Cloud, you see the following health metrics thresholds on the Health tab of the Threshold page.
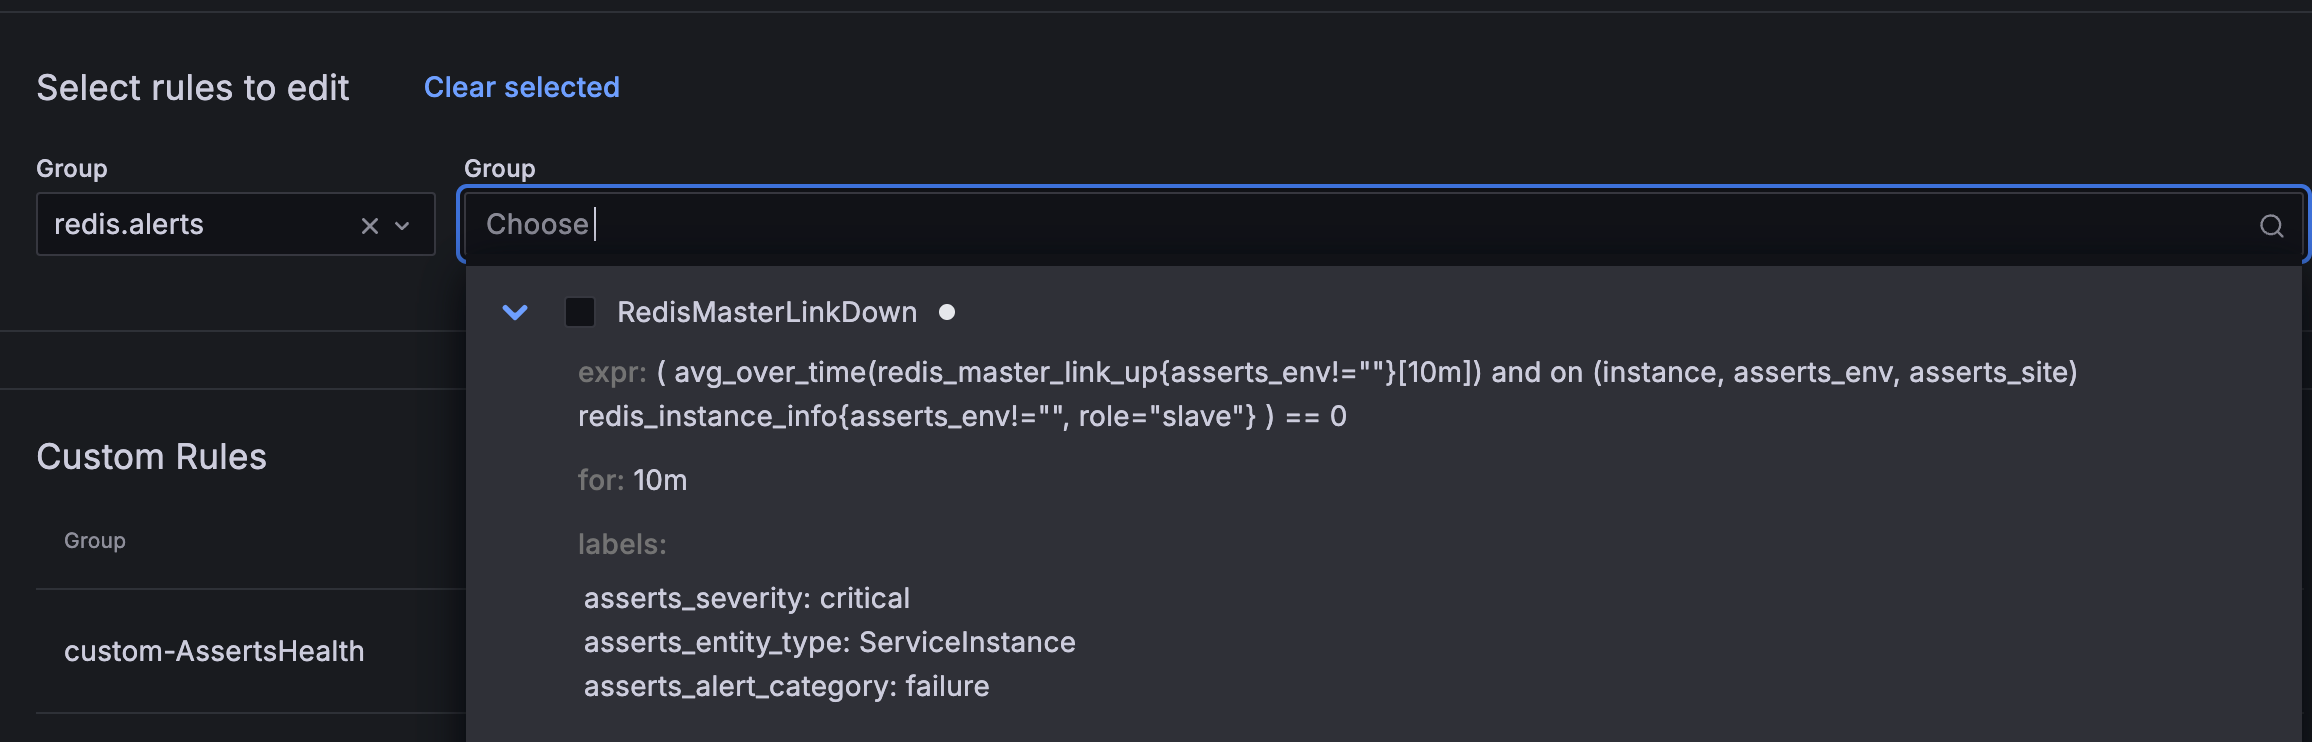
You can click the chevron to view the threshold expression and value determined by Grafana Labs. For system status (up or down), the threshold values are clear - 0 for down and 1 for up. In other cases, Grafana Labs uses domain knowledge to determine the appropriate threshold values.
Because health rules are more specific and target a narrower scope compared to request or resource thresholds, modifying them alters the query and essentially creates a custom rule. While it’s possible to edit health threshold values, this shouldn’t be frequently necessary.
The following example shows the expression and value of the RedisMasterLinkDown threshold.
When to create a threshold
While the knowledge graph provides many predefined thresholds and values, there are cases when you might need to define your own thresholds.
- Consider defining a request or resource threshold when you want the threshold to apply to a specific workload. Changes to a predefined request or resource threshold apply to all requests or resources.
- Consider defining a health threshold when you send a custom metric for which there isn’t a predefined threshold available. You define a health threshold on the Add new rule page.
Edit and create thresholds
This section shows you how to edit and create all types of thresholds.
Edit a threshold value
If a predefined threshold value doesn’t meet your needs, you can change it. The following steps apply to request, resource, and health thresholds.
To edit a threshold value, complete the following steps.
Sign in to Grafana and select Observability > Rules.
Locate the threshold you want to modify and click the pencil icon.
Update the value and click the checkmark.
Define a request threshold
In addition to configuring predefined threshold values, you can create and configure your own thresholds. Thresholds are hierarchical. For requests, if you specify a threshold on job, it applies to all the request types for that job. Similarly, if you specify a threshold on request_type, it applies to all the request contexts for that request type and job.
To define a request threshold, complete the following steps:
On the Threshold page, click Request.
Complete the following fields:
Click Add new.
Define a resource threshold
If the default resource thresholds don’t meet your needs, you can create your own. For example, define a resource threshold when you want a specific container’s CPU to fire an insight if it reaches 40% instead of the default 60% saturation.
The resource threshold hierarchy begins with source, for example, the exporter, followed by resource_type, and then container. An additional dimension is severity, which is independent of the hierarchy.
To define a resource threshold, complete the following steps:
On the Threshold page, click Resource.
Complete the following fields:
Click Add new.
Define a health threshold
Consider defining a health threshold when you send a custom metric for which there isn’t a predefined threshold available. Use the New rule tab to define a single rule; use the New rule file tab to define multiple rules.
Before you begin
Before you begin to define a health threshold, ensure that:
- You are familiar with Prometheus metrics, alerts, and functions
- You are familiar with PromQL
- You are familiar with the custom metrics for which you might want to create a threshold
Steps
To define a health threshold, complete the following steps.
Sign in to Grafana Cloud and navigate to Observability > Rules > Bring Your Own.
To define a health threshold using the user interface, complete the following steps:
Click the New rule tab.
Complete the following fields:
Click Add new.
To define a health threshold with a file, complete the following steps:
Click the New rule file tab.
In the View/Edit YML file field, enter (or copy and paste) the contents of the rule.
Click Save.
Manage thresholds using Terraform
You can also manage threshold configurations using Terraform for infrastructure as code workflows. This enables version control, automated deployments, and consistent threshold settings across environments.
For information about managing thresholds with Terraform, refer to Configure thresholds using Terraform.


