Respond to service issues from Service center
From Service center, you can respond quickly to issues affecting your services. If you see signs of service degradation, a missed SLO, or another problem, you can take direct action:
- Escalate the issue to a responsible team or individual
- Declare an incident, automatically labeled with the affected service
- View and contact the current on-call responder for the service
These actions leverage your Grafana IRM configuration to help teams streamline incident response from within the service context.
Before you begin
To use these IRM features in Service center, configure the following:
- Assign a team to each service in Service center
- Organization admins can view all teams. All authenticated users can view details for their own teams. Access to the Teams API is required to view team and on-call information across all teams.
To view on-call information:
- Create an on-call schedule with active participants for each team
To escalate an issue:
- Configure direct paging for the team
- Have one of the following IRM roles: Editor basic role, Alert Groups Direct Paging role, or OnCaller role
Declare an incident
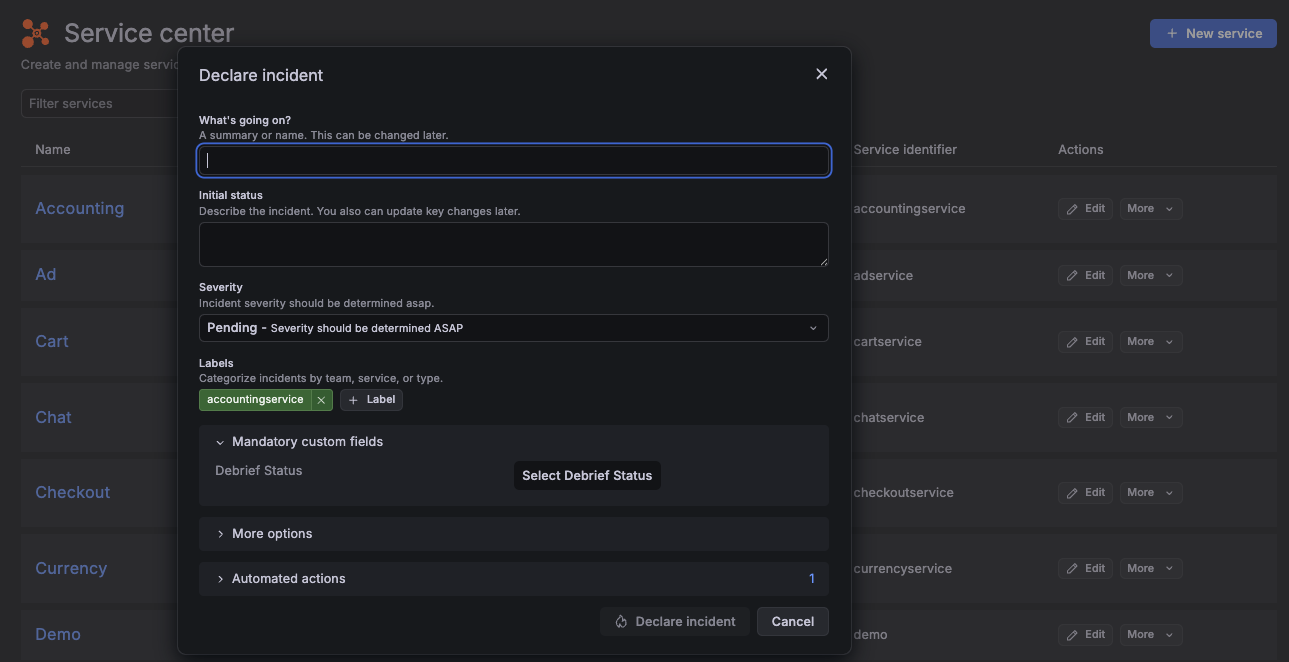
You can declare an incident in Grafana IRM directly from the Service center:
- In the service list or service details page, click the More menu.
- Select Declare incident.
- The incident form opens with the service name pre-populated as a label.
- Provide a title, severity, and any other details.
- Click Declare incident.
For more information, refer to the Declare an incident documentation.
Escalate an issue
When you escalate an issue from the Service center, it connects directly to your IRM escalation workflows.
To escalate a service-related issue:
- In the service list or service details page, click the More menu.
- Select Escalate.
- In the escalation drawer, add a description of the issue.
- If the service has a team assigned, that team is added as a default escalation participant. Otherwise, add users or teams manually.
- Click Create.
The escalation creates an alert in Grafana IRM with:
- The service name as a label
- Your description as the alert message
- The selected teams and users as participants
- A link back to the service in the Service center
For more information, refer to Respond to alerts in Grafana IRM.
View who is on-call for a service
The Service center shows the current on-call user based on your Grafana IRM on-call schedules.
On the service details page, you can view the current on-call user if:
- The service has a team assigned
- That team has an active on-call schedule with at least one participant
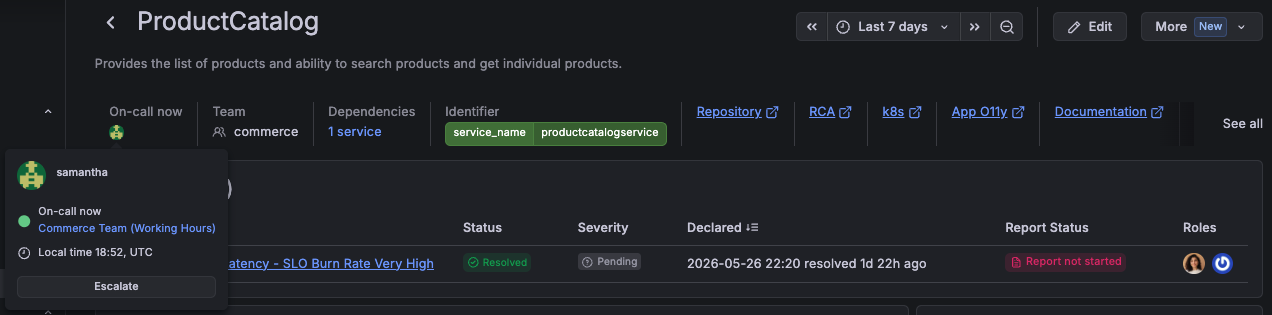
This section displays:
- The avatar and name of the on-call user
- The associated schedule
- On-call status indicator
Contact the on-call person for a service
From the Service center, you can contact responders directly through the IRM on-call user card.
Hover over the on-call avatar to reveal:
- The user’s local time
- Whether the user is within working hours
- Escalate: Opens the escalation drawer with the user added by default
- Slack DM: Opens a direct message (if Slack is connected)
Even if direct paging is not enabled for the team, you can still escalate to an individual user from the avatar card.