Menu
Grafana Cloud

Flame graph AI

Flame graph AI helps you understand your profiling data by using a large-language model (LLM) to assist with data interpretation.

A flame graph provides a convenient way to visualize performance data. These graphs provide a clear, intuitive understanding of resource allocation and bottlenecks within an application. To learn more, refer to Flame graph visualizations.

Flame graphs and profiling data in general can help you understand:

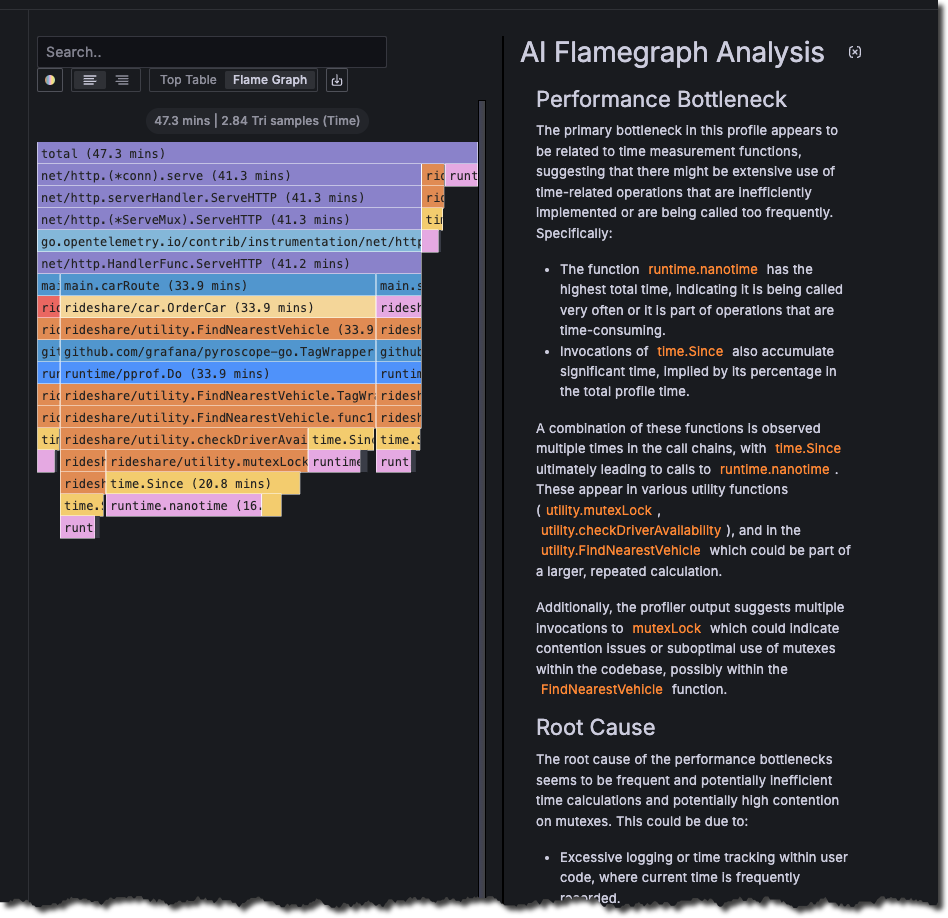
  1. Performance bottlenecks: What’s causing the slowdown?
  2. Root causes: Why is it happening?
  3. Recommended fixes: How would you resolve it?

Flame graph AI answers these questions when explaining your flame graph. To learn more, refer to AI-powered insights for continuous profiling: introducing Flame graph AI in Grafana Cloud.

Flame graph analysis with performance bottleneck, root cause, and recommended fix

Flame graph AI compliments human interpretation

Flame graph AI’s strength lies not just in analysis but more importantly in filling the gaps by augmenting and enhancing user experience.

It only takes using a flame graph successfully once to really move from the beginner to advanced interpretation. From a product standpoint, one challenge has been building a user-experience that can span from beginner to expert and still be useful for both.

When compared to volunteers in a limited flame graph interpretation test, the Flame graph AI’s interpreter scored 100%. Beginners scored 25% and flame graph experts scored 83%. The AI consistently outperformed beginners and advanced users, providing accurate, albeit less detailed/nuanced, interpretations than the experts.

These initial results at least point towards a great opportunity in adding value to most users by incorporating AI.

Refer to the AI-powered flame graph interpreter blog post to learn more.

Explore your profile data with Flame graph AI

Flame graph AI uses the LLM plugin for Grafana to provide the large-language model using OpenAI API.

You can use Flame graph AI in Grafana Explore > Profiles and the Explore Profiles app, nested underneath Explore > Profiles > Explore profiles.

Before you begin

To use Flame graph AI, you must have:

Use Flame graph AI

To use Flame graph AI when viewing a flame graph:

  1. Sign on to your Grafana Cloud account and start your Grafana instance.
  2. Select Explore > Profiles from the left navigation.
  3. Select Flame graph tab from the Exploration types or select any view or service with an available flame graph. For example, from the All services view, select any Flame graph link to open the flame graph for that service.
  4. Select Explain Flame Graph to view the Flame graph analysis.

Use Flame graph AI in Diff flame graph view

The Diff flame graph view facilitates side-by-side comparison of profiles either based on different label sets, different time periods, or both. This feature is extremely valuable for understanding the impact of changes or differences between do distinct queries of your application.

The Diff flame graphw view is an extension of Comparison view, crucial for more easily visually showing the differences between two profiling datasets. Similar to a git diff, the comparison takes the flame graphs from the comparison view and highlights the differences between the two flame graphs.

You can use Flame graph AI to interpret the diff view.

To use Flame graph AI when comparing two different flame graphs:

  1. Sign on to your Grafana Cloud account and start your Grafana instance.
  2. Select Explore > Profiles from the left navigation.
  3. Select a Service, Profile, and time range (optional; default value is Last 1 hour).
  4. Optional: In Baseline time range, select one or more labels to use as filters. Select Execute.
  5. Optional: In Comparison time range, select one or more labels to use as filters. Select Execute.
  6. Select Explain Flame Graph.