Apache HBase integration for Grafana Cloud
Apache HBase is an open-source non-relational distributed database modeled after Google’s Bigtable and written in Java. It is developed as part of Apache Software Foundation’s Apache Hadoop project and runs on top of HDFS or Alluxio, providing Bigtable-like capabilities for Hadoop.
This integration supports Apache HBase versions 3.0.0+
This integration includes 5 useful alerts and 3 pre-built dashboards to help monitor and visualize Apache HBase metrics and logs.
Before you begin
Apache HBase requires a JDK, Apache Zookeeper, and one of Hadoop or Alluxio. Ensure that each of these is installed and configured. Refer to this documentation for prerequisites and compatible versions for Apache HBase.
Apache HBase exposes a Prometheus metrics endpoint that is enabled by default.
Install Apache HBase integration for Grafana Cloud
- In your Grafana Cloud stack, click Connections in the left-hand menu.
- Find Apache HBase and click its tile to open the integration.
- Review the prerequisites in the Configuration Details tab and set up Grafana Alloy to send Apache HBase metrics and logs to your Grafana Cloud instance.
- Click Install to add this integration’s pre-built dashboards and alerts to your Grafana Cloud instance, and you can start monitoring your Apache HBase setup.
Configuration snippets for Grafana Alloy
Advanced mode
The following snippets provide examples to guide you through the configuration process.
To instruct Grafana Alloy to scrape your Apache HBase instances, manually copy and append the snippets to your alloy configuration file, then follow subsequent instructions.
Advanced metrics snippets
prometheus.scrape "metrics_integrations_integrations_apache_hbase" {
	targets = [{
		__address__   = "localhost:<hostport>",
		hbase_cluster = "<your-cluster-name>",
		instance      = constants.hostname,
	}]
	forward_to   = [prometheus.remote_write.metrics_service.receiver]
	job_name     = "integrations/apache-hbase"
	metrics_path = "/prometheus"
}
To monitor your Apache HBase instance, you must use a discovery.relabel component to discover your Apache HBase Prometheus endpoint and apply appropriate labels, followed by a prometheus.scrape component to scrape it.
Configure the following properties within each discovery.relabel component:
__address__: The address to your Apache HBase Prometheus metrics endpoint.instancelabel:constants.hostnamesets theinstancelabel to your Grafana Alloy server hostname. If that is not suitable, change it to a value uniquely identifies this Apache HBase instance. Make sure this label value is the same for all telemetry data collected for this instance.hbase_clusterlabel must be set to a value that identifies your Apache HBase cluster.
If you have multiple Apache HBase servers to scrape, configure one discovery.relabel for each and scrape them by including each under targets within the prometheus.scrape component.
Advanced logs snippets
linux
local.file_match "logs_integrations_integrations_apache_hbase" {
	path_targets = [{
		__address__   = "localhost",
		__path__      = "<hbase_home>/logs/*.log",
		hbase_cluster = "<your-cluster-name>",
		instance      = constants.hostname,
		job           = "integrations/apache-hbase",
	}]
}

loki.process "logs_integrations_integrations_apache_hbase" {
	forward_to = [loki.write.grafana_cloud_loki.receiver]

	stage.multiline {
		firstline     = "\\d{4}-\\d{2}-\\d{2}T\\d{2}:\\d{2}:\\d{2},\\d{3}"
		max_lines     = 0
		max_wait_time = "3s"
	}

	stage.regex {
		expression = "\\d{4}-\\d{2}-\\d{2}T\\d{2}:\\d{2}:\\d{2},\\d{3} (?P<level>\\w+)  \\[(.*)\\] (?P<logger>\\w+.\\w+): (?P<message>(?s:.*))$"
	}

	stage.labels {
		values = {
			level  = null,
			logger = null,
		}
	}
}

loki.source.file "logs_integrations_integrations_apache_hbase" {
	targets    = local.file_match.logs_integrations_integrations_apache_hbase.targets
	forward_to = [loki.process.logs_integrations_integrations_apache_hbase.receiver]
}
To monitor your Apache HBase instance logs, you will use a combination of the following components:
local.file_match defines where to find the log file to be scraped. Change the following properties according to your environment:
__address__: The Apache HBase instance address__path__: The path to the log file.instancelabel:constants.hostnamesets theinstancelabel to your Grafana Alloy server hostname. If that is not suitable, change it to a value uniquely identifies this Apache HBase instance. Make sure this label value is the same for all telemetry data collected for this instance.hbase_clusterlabel must be set to a value that identifies your Apache HBase cluster.
loki.process defines how to process logs before sending it to Loki.
loki.source.file sends logs to Loki.
Dashboards
The Apache HBase integration installs the following dashboards in your Grafana Cloud instance to help monitor your system.
- Apache HBase RegionServer overview
- Apache HBase cluster overview
- Apache HBase logs
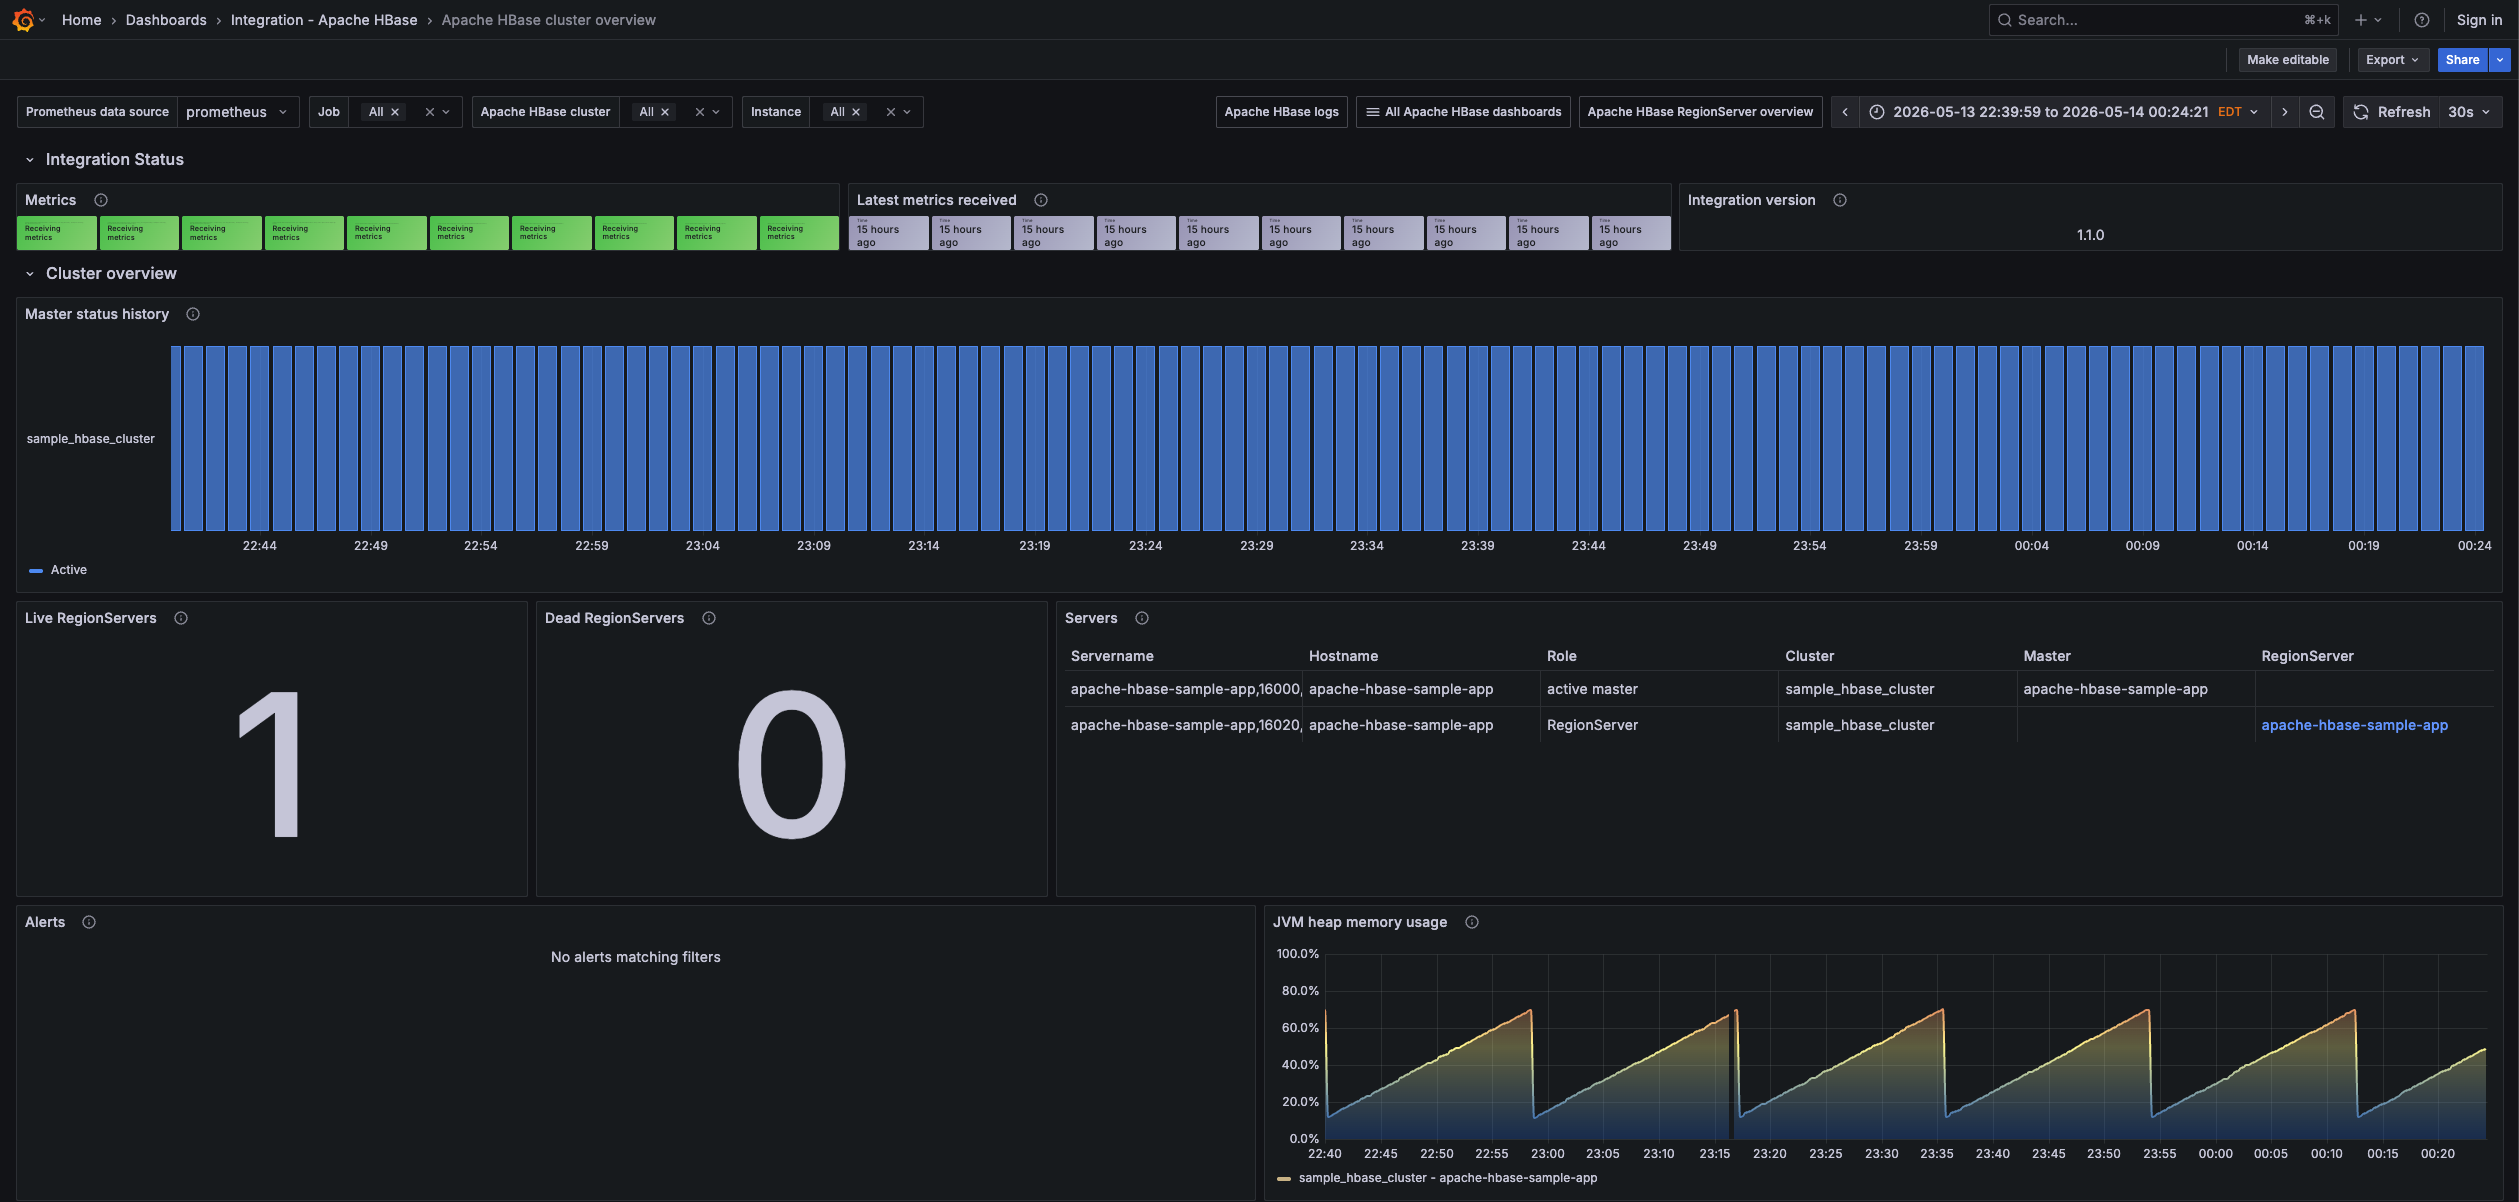
Apache HBase cluster overview (status)
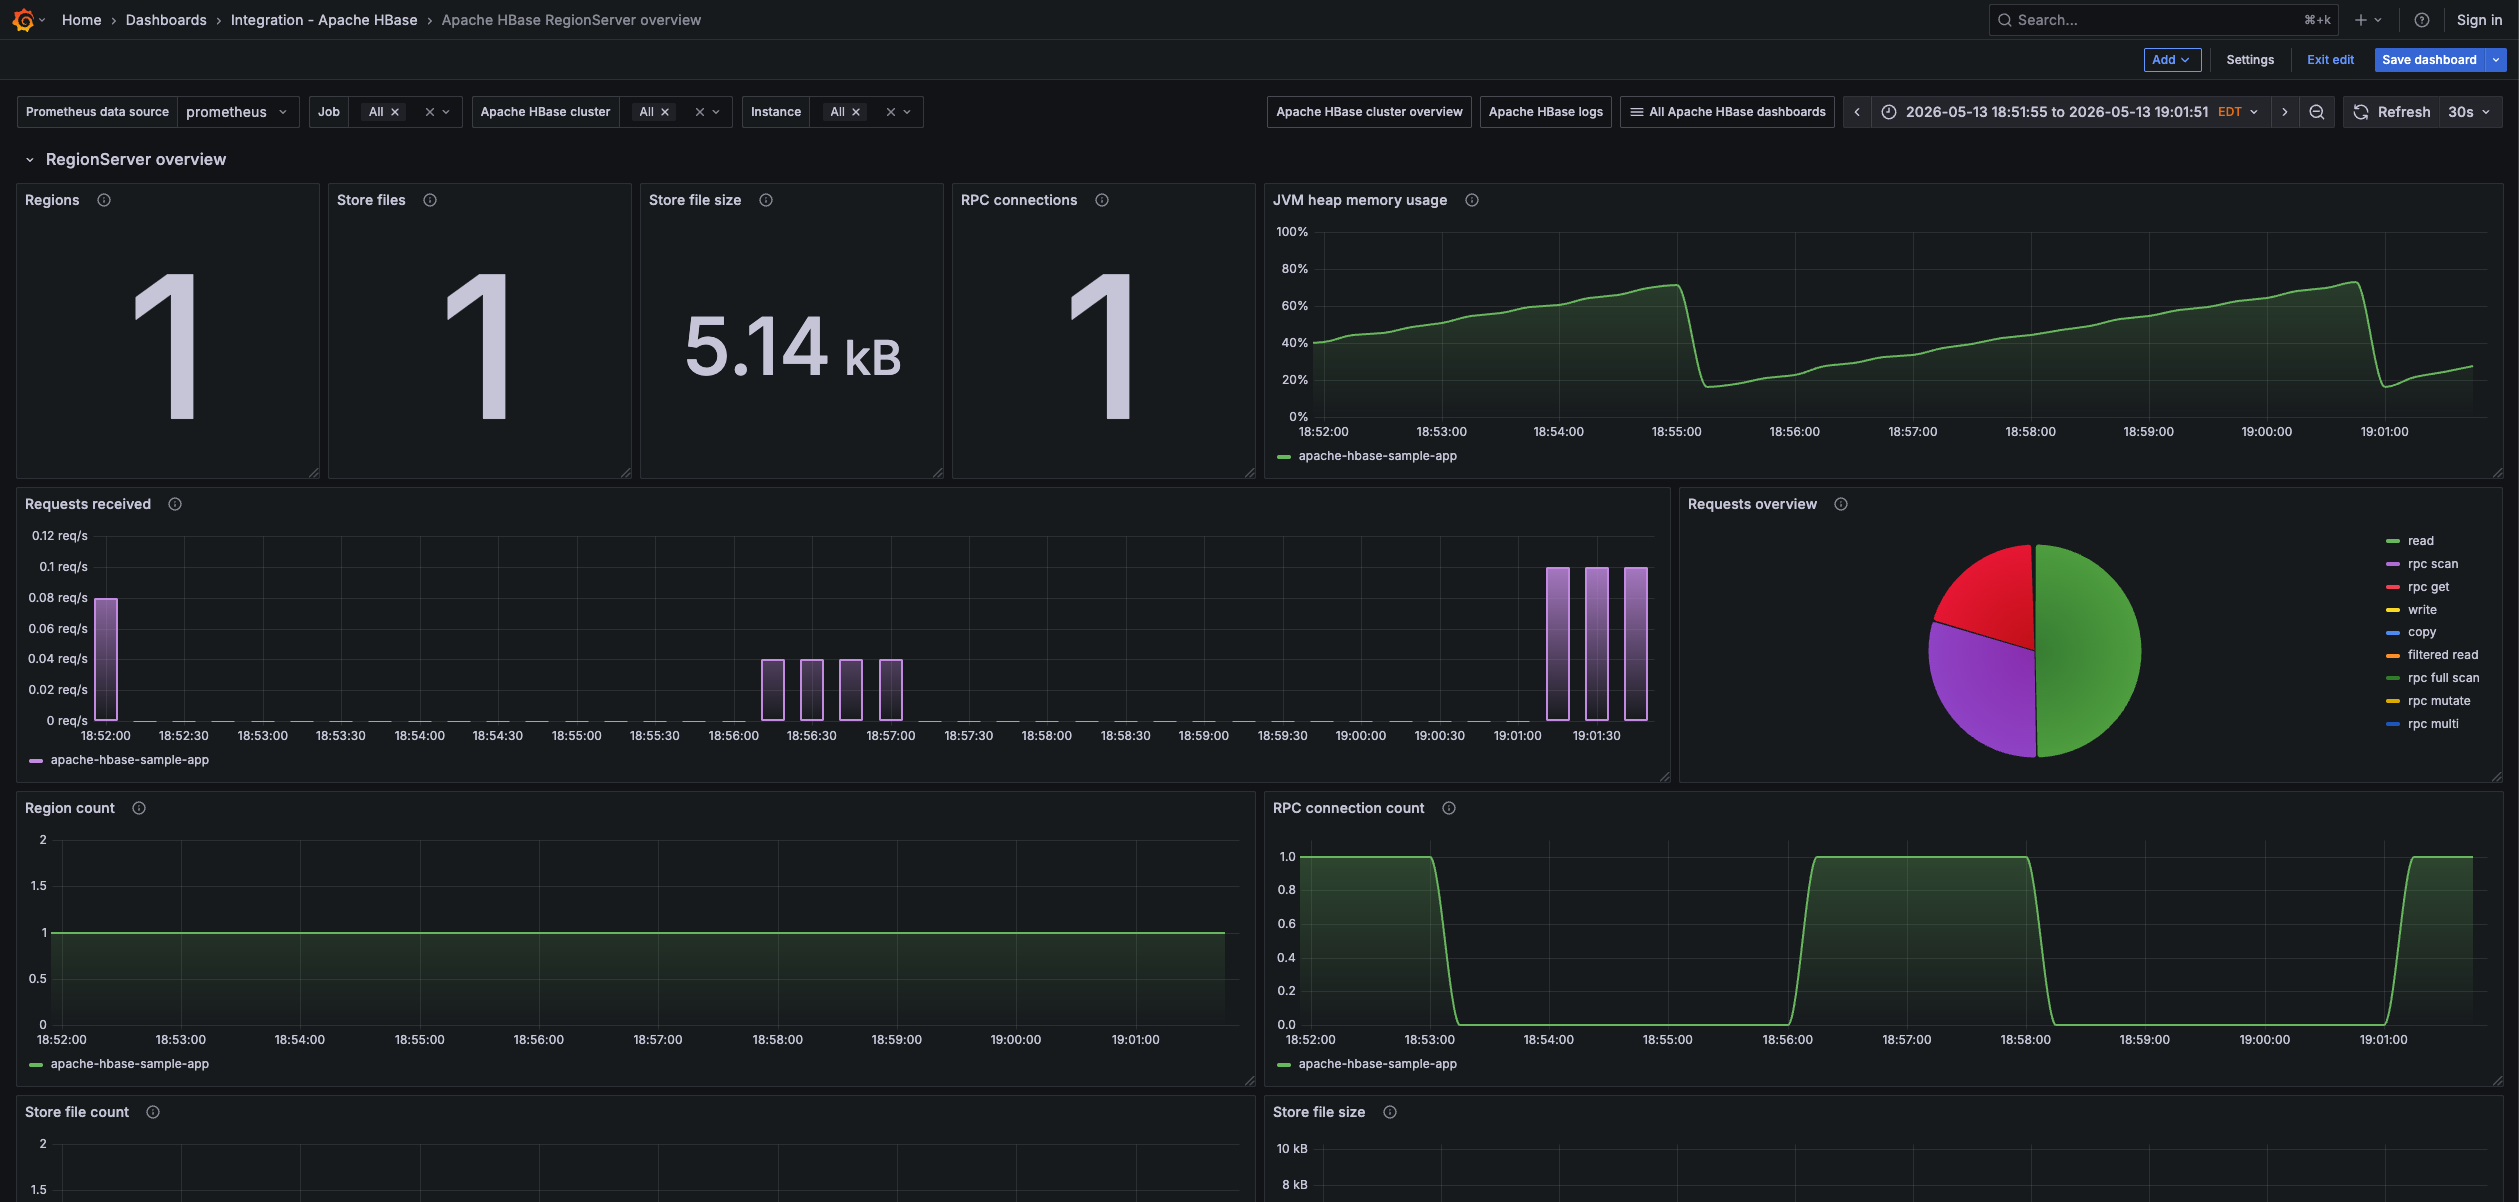
Apache HBase RegionServer overview
Apache HBase logs overview

Alerts
The Apache HBase integration includes the following useful alerts:
Metrics
The most important metrics provided by the Apache HBase integration, which are used on the pre-built dashboards and Prometheus alerts, are as follows:
- assignment_manager_rit_count
- assignment_manager_rit_count_over_threshold
- assignment_manager_rit_oldest_age
- jvm_metrics_mem_heap_committed_m
- jvm_metrics_mem_heap_used_m
- master_authentication_failures
- master_authentication_successes
- master_num_calls_in_general_queue
- master_num_calls_in_priority_queue
- master_num_calls_in_read_queue
- master_num_calls_in_replication_queue
- master_num_calls_in_scan_queue
- master_num_calls_in_write_queue
- master_num_open_connections
- master_queue_size
- region_server_authentication_failures
- region_server_authentication_successes
- region_server_num_calls_in_general_queue
- region_server_num_calls_in_priority_queue
- region_server_num_calls_in_read_queue
- region_server_num_calls_in_replication_queue
- region_server_num_calls_in_scan_queue
- region_server_num_calls_in_write_queue
- region_server_num_open_connections
- server_block_cache_express_hit_percent
- server_cp_request_count
- server_filtered_read_request_count
- server_num_dead_region_servers
- server_num_reference_files
- server_num_region_servers
- server_read_request_count
- server_region_count
- server_rpc_full_scan_request_count
- server_rpc_get_request_count
- server_rpc_multi_request_count
- server_rpc_mutate_request_count
- server_rpc_scan_request_count
- server_slow_append_count
- server_slow_delete_count
- server_slow_get_count
- server_slow_increment_count
- server_slow_put_count
- server_store_file_count
- server_store_file_size
- server_total_request_count
- server_write_request_count
- up
Changelog
# 1.1.1 - June 2026

- Fixed issue with default filtering selectors

# 1.1.0 - June 2026

- Updated dashboards to follow new stylistic standards
- Renamed "Apache HBase logs overview" dashboard to "Apache HBase logs"


# 1.0.1 - November 2024

- Update status panel check queries

# 1.0.0 - November 2023

- Initial release
Cost
By connecting your Apache HBase instance to Grafana Cloud, you might incur charges. To view information on the number of active series that your Grafana Cloud account uses for metrics included in each Cloud tier, see Active series and dpm usage and Cloud tier pricing.


