IBM MQ integration for Grafana Cloud
IBM MQ is a message queue software that can be deployed across a range of different environments. MQ sends and receives messages via message queues to support the exchange of information between applications, systems, and services.
This integration includes useful visualizations for cluster, queue manager, queue, and topic metrics. Metrics such as the number of messages sent and received by queue managers and queues, the number of different queue operations, disk usage, CPU usage, active connections, average queue time, and expired messages.
This integration supports IBM MQ 9.1+
This integration includes 4 useful alerts and 5 pre-built dashboards to help monitor and visualize IBM MQ metrics and logs.
Before you begin
In order for the integration to properly work, you must set up the MQ Prometheus exporter for each queue manager in the cluster.
Set up Prometheus exporter
Each instance of the exporter can be run by running the following setup script.
This file specifies multiple arguments for monitoring your IBM MQ cluster and its objects. Modify this file to ensure that the supplied arguments match your IBM MQ environment.
Key arguments that must be checked include:
- ibmmq.queueManager=
<qmgr> - ibmmq.monitoredChannels=
<channels> - ibmmq.monitoredTopics=
<topics> - ibmmq.monitoredSubscriptions=
<subscriptions> - ibmmq.monitoredQueues=
<queues>
<qmgr>, <queues>, <channels>, <topics>, <subscriptions> must be replaced with the regular expression that will match the respective object of your instance of the exporter is monitoring.
* ex: Channel Name: LONDON.NEWYORK —-> <channels>: LONDON.*
Windows
See here for additional help on building to run on Windows.
The exporter uses port 9157 by default to expose metrics, however if multiple queue managers are going to be monitored by Grafana Alloy on the same machine, you must change the default port. This can be done using the ibmmq.httpListenPort flag when running the exporter.
For more information on how to configure the exporter for each queue manager, please refer to the documentation for details.
Once deployed, Grafana Alloy should be able to reach the exporter’s exposed metrics endpoint.
Install IBM MQ integration for Grafana Cloud
- In your Grafana Cloud stack, click Connections in the left-hand menu.
- Find IBM MQ and click its tile to open the integration.
- Review the prerequisites in the Configuration Details tab and set up Grafana Alloy to send IBM MQ metrics and logs to your Grafana Cloud instance.
- Click Install to add this integration’s pre-built dashboards and alerts to your Grafana Cloud instance, and you can start monitoring your IBM MQ setup.
Configuration snippets for Grafana Alloy
Advanced mode
The following snippets provide examples to guide you through the configuration process.
To instruct Grafana Alloy to scrape your IBM MQ instances, manually copy and append the snippets to your alloy configuration file, then follow subsequent instructions.
Advanced metrics snippets
discovery.relabel "metrics_integrations_integrations_ibm_mq" {
	targets = concat(
		[{
			__address__ = "<exporter-hostname-1>:<exporter-port-1>",
		}],
		[{
			__address__ = "<exporter-hostname-2>:<exporter-port-2>",
		}],
	)

	rule {
		target_label = "instance"
		replacement  = constants.hostname
	}

	rule {
		target_label = "mq_cluster"
		replacement  = "<your-cluster-name>"
	}
}

prometheus.scrape "metrics_integrations_integrations_ibm_mq" {
	targets    = discovery.relabel.metrics_integrations_integrations_ibm_mq.output
	forward_to = [prometheus.remote_write.metrics_service.receiver]
	job_name   = "integrations/ibm-mq"
}
To monitor your IBM MQ instance, you must use a discovery.relabel component to discover your IBM MQ Prometheus endpoint and apply appropriate labels, followed by a prometheus.scrape component to scrape it.
Configure the following properties within each discovery.relabel component:
__address__: The address to your IBM MQ Prometheus metrics endpoint.instancelabel:constants.hostnamesets theinstancelabel to your Grafana Alloy server hostname. If that is not suitable, change it to a value uniquely identifies this IBM MQ instance. Make sure this label value is the same for all telemetry data collected for this instance.mq_cluster: Themq_clusterlabel to group your IBM MQ instances within a cluster. Set the same value for all nodes within your cluster.
If you have multiple IBM MQ servers to scrape, configure one discovery.relabel for each and scrape them by including each under targets within the prometheus.scrape component.
Advanced logs snippets
linux
local.file_match "logs_integrations_integrations_ibm_mq" {
	path_targets = [{
		__address__ = "localhost",
		__path__    = "/var/mqm/errors/*.LOG",
		instance    = constants.hostname,
		job         = "integrations/ibm-mq",
		mq_cluster  = "<your-cluster-name>",
	}]
}

loki.process "logs_integrations_integrations_ibm_mq" {
	forward_to = [loki.write.grafana_cloud_loki.receiver]

	stage.match {
		selector = "{job=\"integrations/ibm-mq\",instance=\"<your-instance-name>\"}"

		stage.regex {
			expression = "/var/mqm/qmgrs/(?P<qmgr>.*?)/errors/.*\\.LOG"
			source     = "filename"
		}

		stage.labels {
			values = {
				qmgr = null,
			}
		}
	}

	stage.multiline {
		firstline     = "^\\s*\\d{2}\\/\\d{2}\\/\\d{2}\\s+\\d{2}:\\d{2}:\\d{2}\\s*-"
		max_lines     = 0
		max_wait_time = "3s"
	}
}

loki.source.file "logs_integrations_integrations_ibm_mq" {
	targets    = local.file_match.logs_integrations_integrations_ibm_mq.targets
	forward_to = [loki.process.logs_integrations_integrations_ibm_mq.receiver]
}
To monitor your IBM MQ instance logs, you will use a combination of the following components:
local.file_match defines where to find the log file to be scraped. Change the following properties according to your environment:
__address__: The IBM MQ instance address__path__: The path to the log file.instancelabel:constants.hostnamesets theinstancelabel to your Grafana Alloy server hostname. If that is not suitable, change it to a value uniquely identifies this IBM MQ instance. Make sure this label value is the same for all telemetry data collected for this instance.mq_cluster: Themq_clusterlabel to group your IBM MQ instances within a cluster. Set the same value for all nodes within your cluster.
loki.process defines how to process logs before sending it to Loki.
loki.source.file sends logs to Loki.
windows
local.file_match "logs_integrations_integrations_ibm_mq" {
	path_targets = [{
		__address__ = "localhost",
		__path__    = "/var/mqm/errors/*.LOG",
		instance    = constants.hostname,
		job         = "integrations/ibm-mq",
		mq_cluster  = "<your-cluster-name>",
	}]
}

loki.process "logs_integrations_integrations_ibm_mq" {
	forward_to = [loki.write.grafana_cloud_loki.receiver]

	stage.match {
		selector = "{job=\"integrations/ibm-mq\",instance=\"<your-instance-name>\"}"

		stage.regex {
			expression = "/var/mqm/qmgrs/(?P<qmgr>.*?)/errors/.*\\.LOG"
			source     = "filename"
		}

		stage.labels {
			values = {
				qmgr = null,
			}
		}
	}

	stage.multiline {
		firstline     = "^\\s*\\d{2}\\/\\d{2}\\/\\d{2}\\s+\\d{2}:\\d{2}:\\d{2}\\s*-"
		max_lines     = 0
		max_wait_time = "3s"
	}
}

loki.source.file "logs_integrations_integrations_ibm_mq" {
	targets    = local.file_match.logs_integrations_integrations_ibm_mq.targets
	forward_to = [loki.process.logs_integrations_integrations_ibm_mq.receiver]
}
To monitor your IBM MQ instance logs, you will use a combination of the following components:
local.file_match defines where to find the log file to be scraped. Change the following properties according to your environment:
__address__: The IBM MQ instance address__path__: The path to the log file.instancelabel:constants.hostnamesets theinstancelabel to your Grafana Alloy server hostname. If that is not suitable, change it to a value uniquely identifies this IBM MQ instance. Make sure this label value is the same for all telemetry data collected for this instance.mq_cluster: Themq_clusterlabel to group your IBM MQ instances within a cluster. Set the same value for all nodes within your cluster.
loki.process defines how to process logs before sending it to Loki.
loki.source.file sends logs to Loki.
Kubernetes instructions
Before you begin with Kubernetes
Please note: These instructions assume the use of the Kubernetes Monitoring Helm chart
In order for the integration to properly work, you must set up the MQ Prometheus exporter for each queue manager in the cluster.
Set up Prometheus exporter
Each instance of the exporter can be run by running the following setup script.
This file specifies multiple arguments for monitoring your IBM MQ cluster and its objects. Modify this file to ensure that the supplied arguments match your IBM MQ environment.
Key arguments that must be checked include:
- ibmmq.queueManager=
<qmgr> - ibmmq.monitoredChannels=
<channels> - ibmmq.monitoredTopics=
<topics> - ibmmq.monitoredSubscriptions=
<subscriptions> - ibmmq.monitoredQueues=
<queues>
<qmgr>, <queues>, <channels>, <topics>, <subscriptions> must be replaced with the regular expression that will match the respective object of your instance of the exporter is monitoring.
* ex: Channel Name: LONDON.NEWYORK —-> <channels>: LONDON.*
Configuration snippets for Kubernetes Helm chart
The following snippets provide examples to guide you through the configuration process.
To scrape your IBM MQ instances, manually modify your Kubernetes Monitoring Helm chart with these configuration snippets.
Replace any values between the angle brackets <> in the provided snippets with your desired configuration values.
Metrics snippets
alloy-metrics:
    extraConfig: |-
        discovery.kubernetes "ibm_mq" {
            role = "pod"
            selectors {
                role = "pod"
                label = "<ibm-mq-pod-label>=<ibm-mq-pod-label-value>"
            }
        }

        discovery.relabel "ibm_mq" {
            targets = discovery.kubernetes.ibm_mq.targets
            rule {
                source_labels = ["__meta_kubernetes_pod_container_port_number"]
                regex = "9157"
                action = "keep"
            }
            rule {
                target_label = "mq_cluster"
                replacement = "<ibm-mq-cluster-label>"
            }
            rule {
                source_labels = ["__meta_kubernetes_namespace", "__meta_kubernetes_pod_container_name"]
                separator = "-"
                target_label = "instance"
            }
        }
        prometheus.scrape "ibm_mq" {
            targets    = discovery.relabel.ibm_mq.output
            job_name   = "integrations/ibm-mq"
            forward_to = [prometheus.remote_write.grafana_cloud_metrics.receiver]
        }
Logs snippets
podLogs:
    extraDiscoveryRules: |-
        rule {
            source_labels = ["__meta_kubernetes_pod_label_<ibm-mq-pod-label>"]
            regex = "<ibm-mq-pod-label-value>"
            replacement = "ibm-mq"
            target_label = "integration"
        }

    extraLogProcessingStages: |-
        stage.match {
            selector = "{integration=\\"ibm-mq\\"}"

            stage.multiline {
                firstline = \`^\\s*\\d{2}\\/\\d{2}\\/\\d{2}\\s+\\d{2}:\\d{2}:\\d{2}\\s*-'\`
            }

            stage.template {
                source   = "instance"
                template = "{{ .namespace }}-{{ .container }}"
            }

            stage.static_labels {
                values = {
                    mq_cluster = "<your-cluster-name>",
                    log_type   = "mq-qmgr-error",
                    job        = "integrations/ibm-mq",
                }
            }
        }
Dashboards
The IBM MQ integration installs the following dashboards in your Grafana Cloud instance to help monitor your system.
- IBM MQ cluster overview
- IBM MQ logs
- IBM MQ queue manager overview
- IBM MQ queue overview
- IBM MQ topics overview
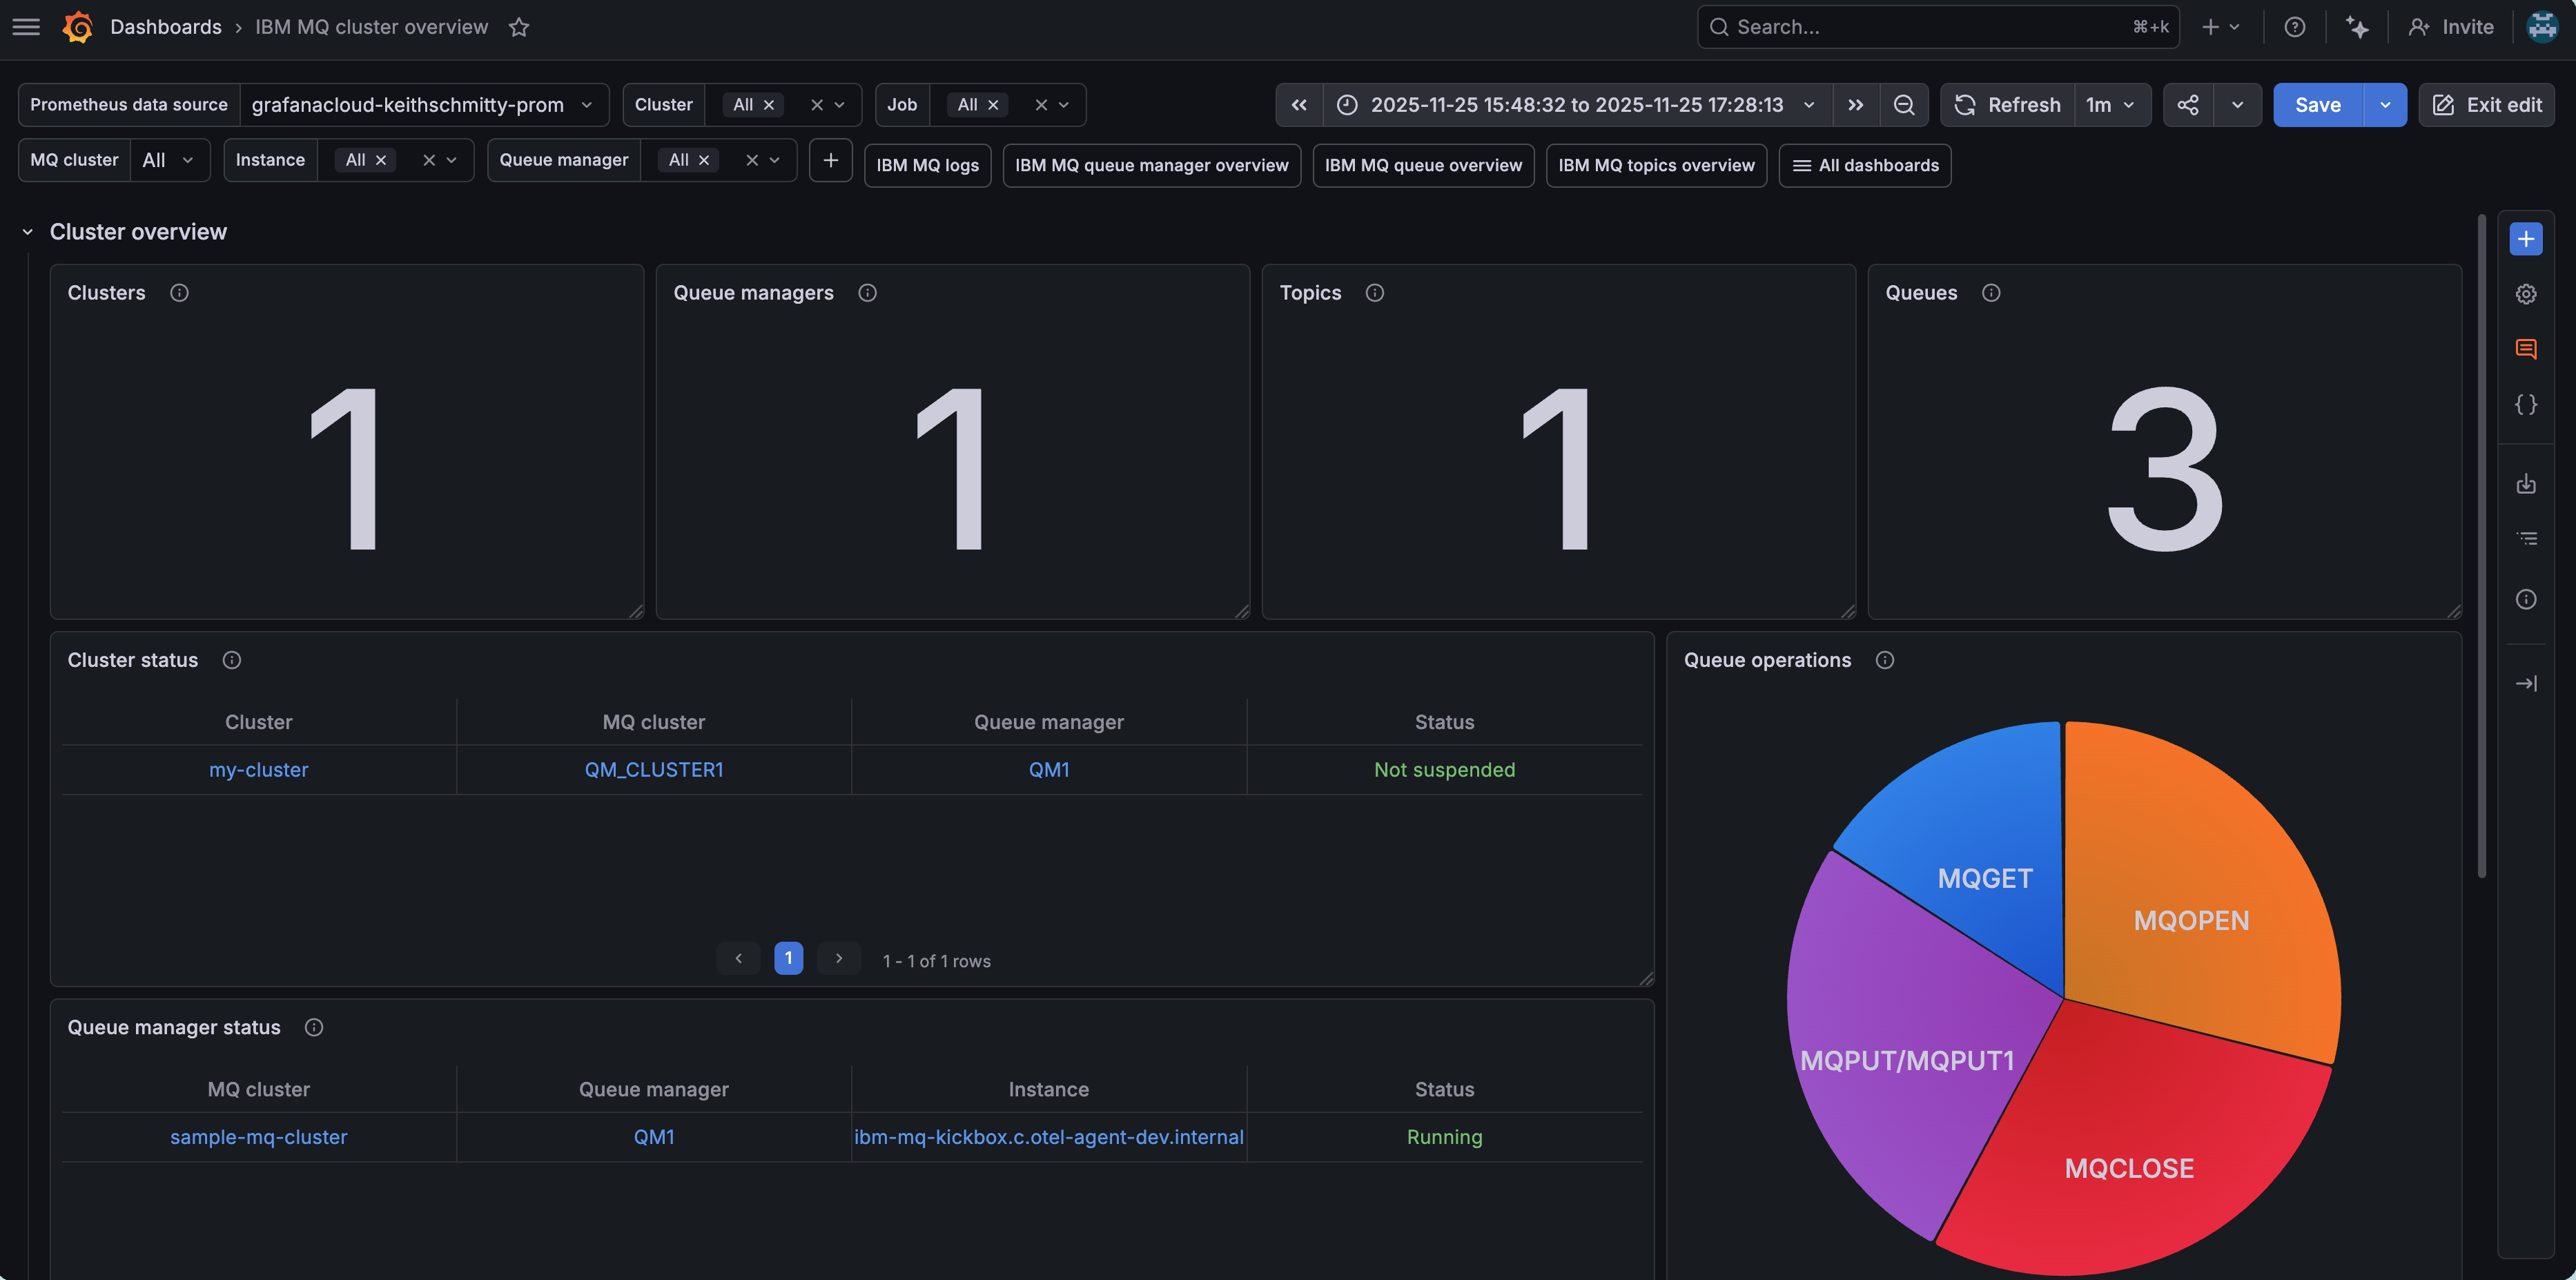
IBM MQ cluster overview (1/2)
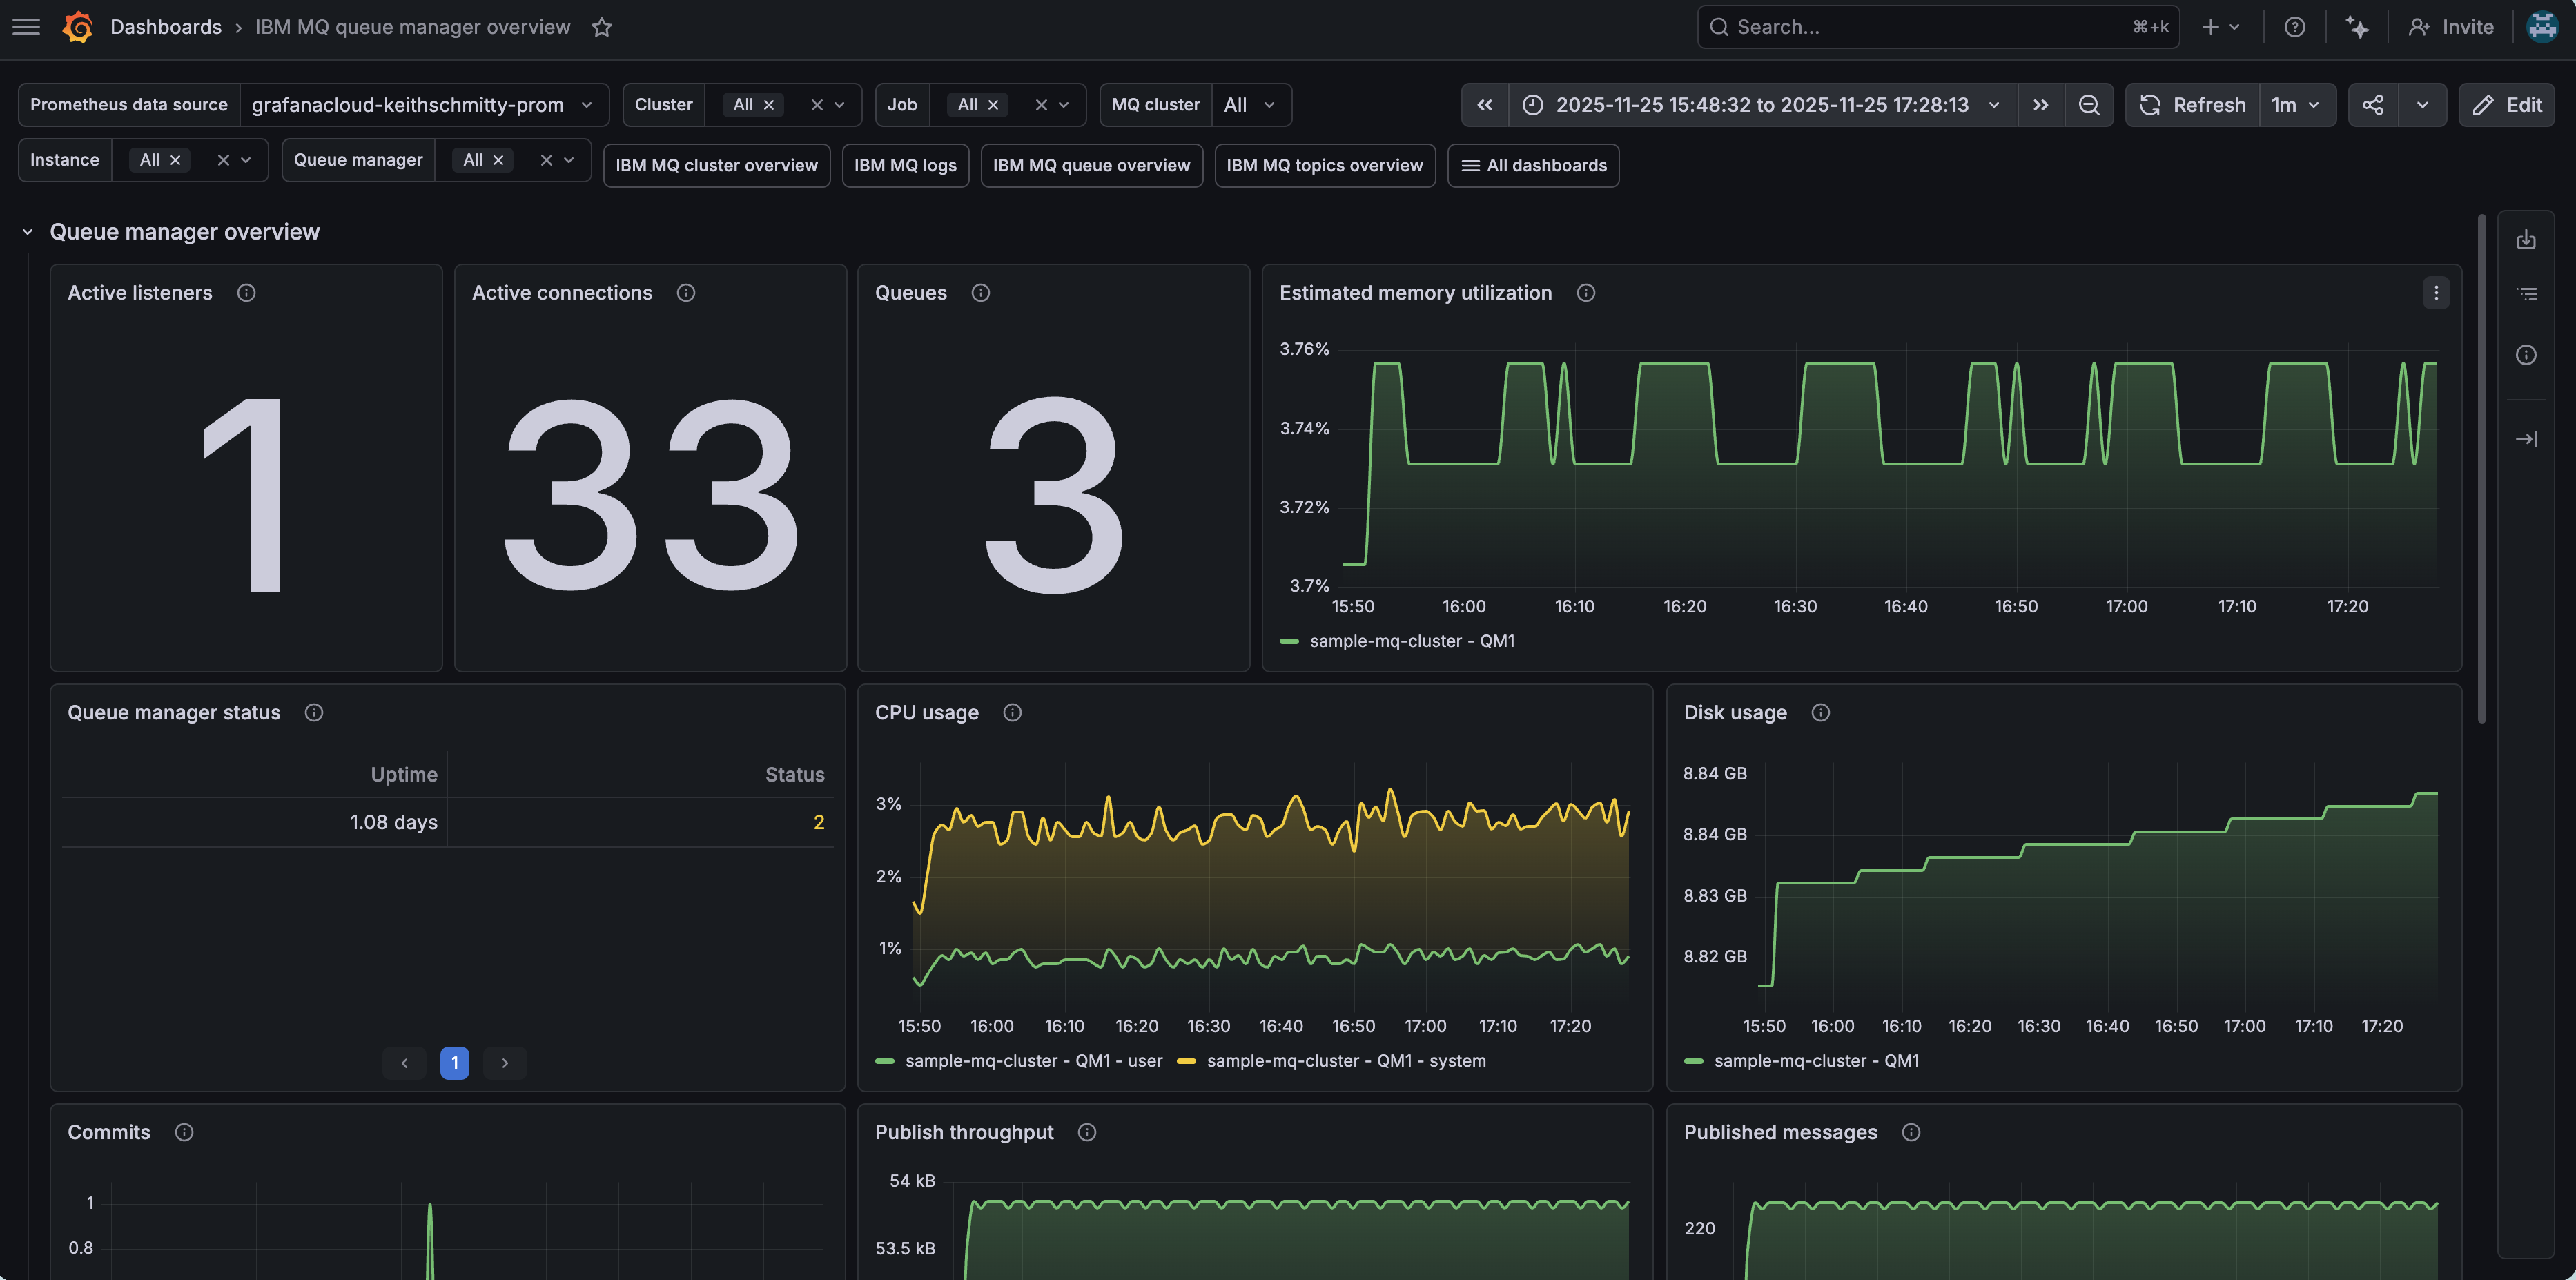
IBM MQ queue manager overview (1/2)
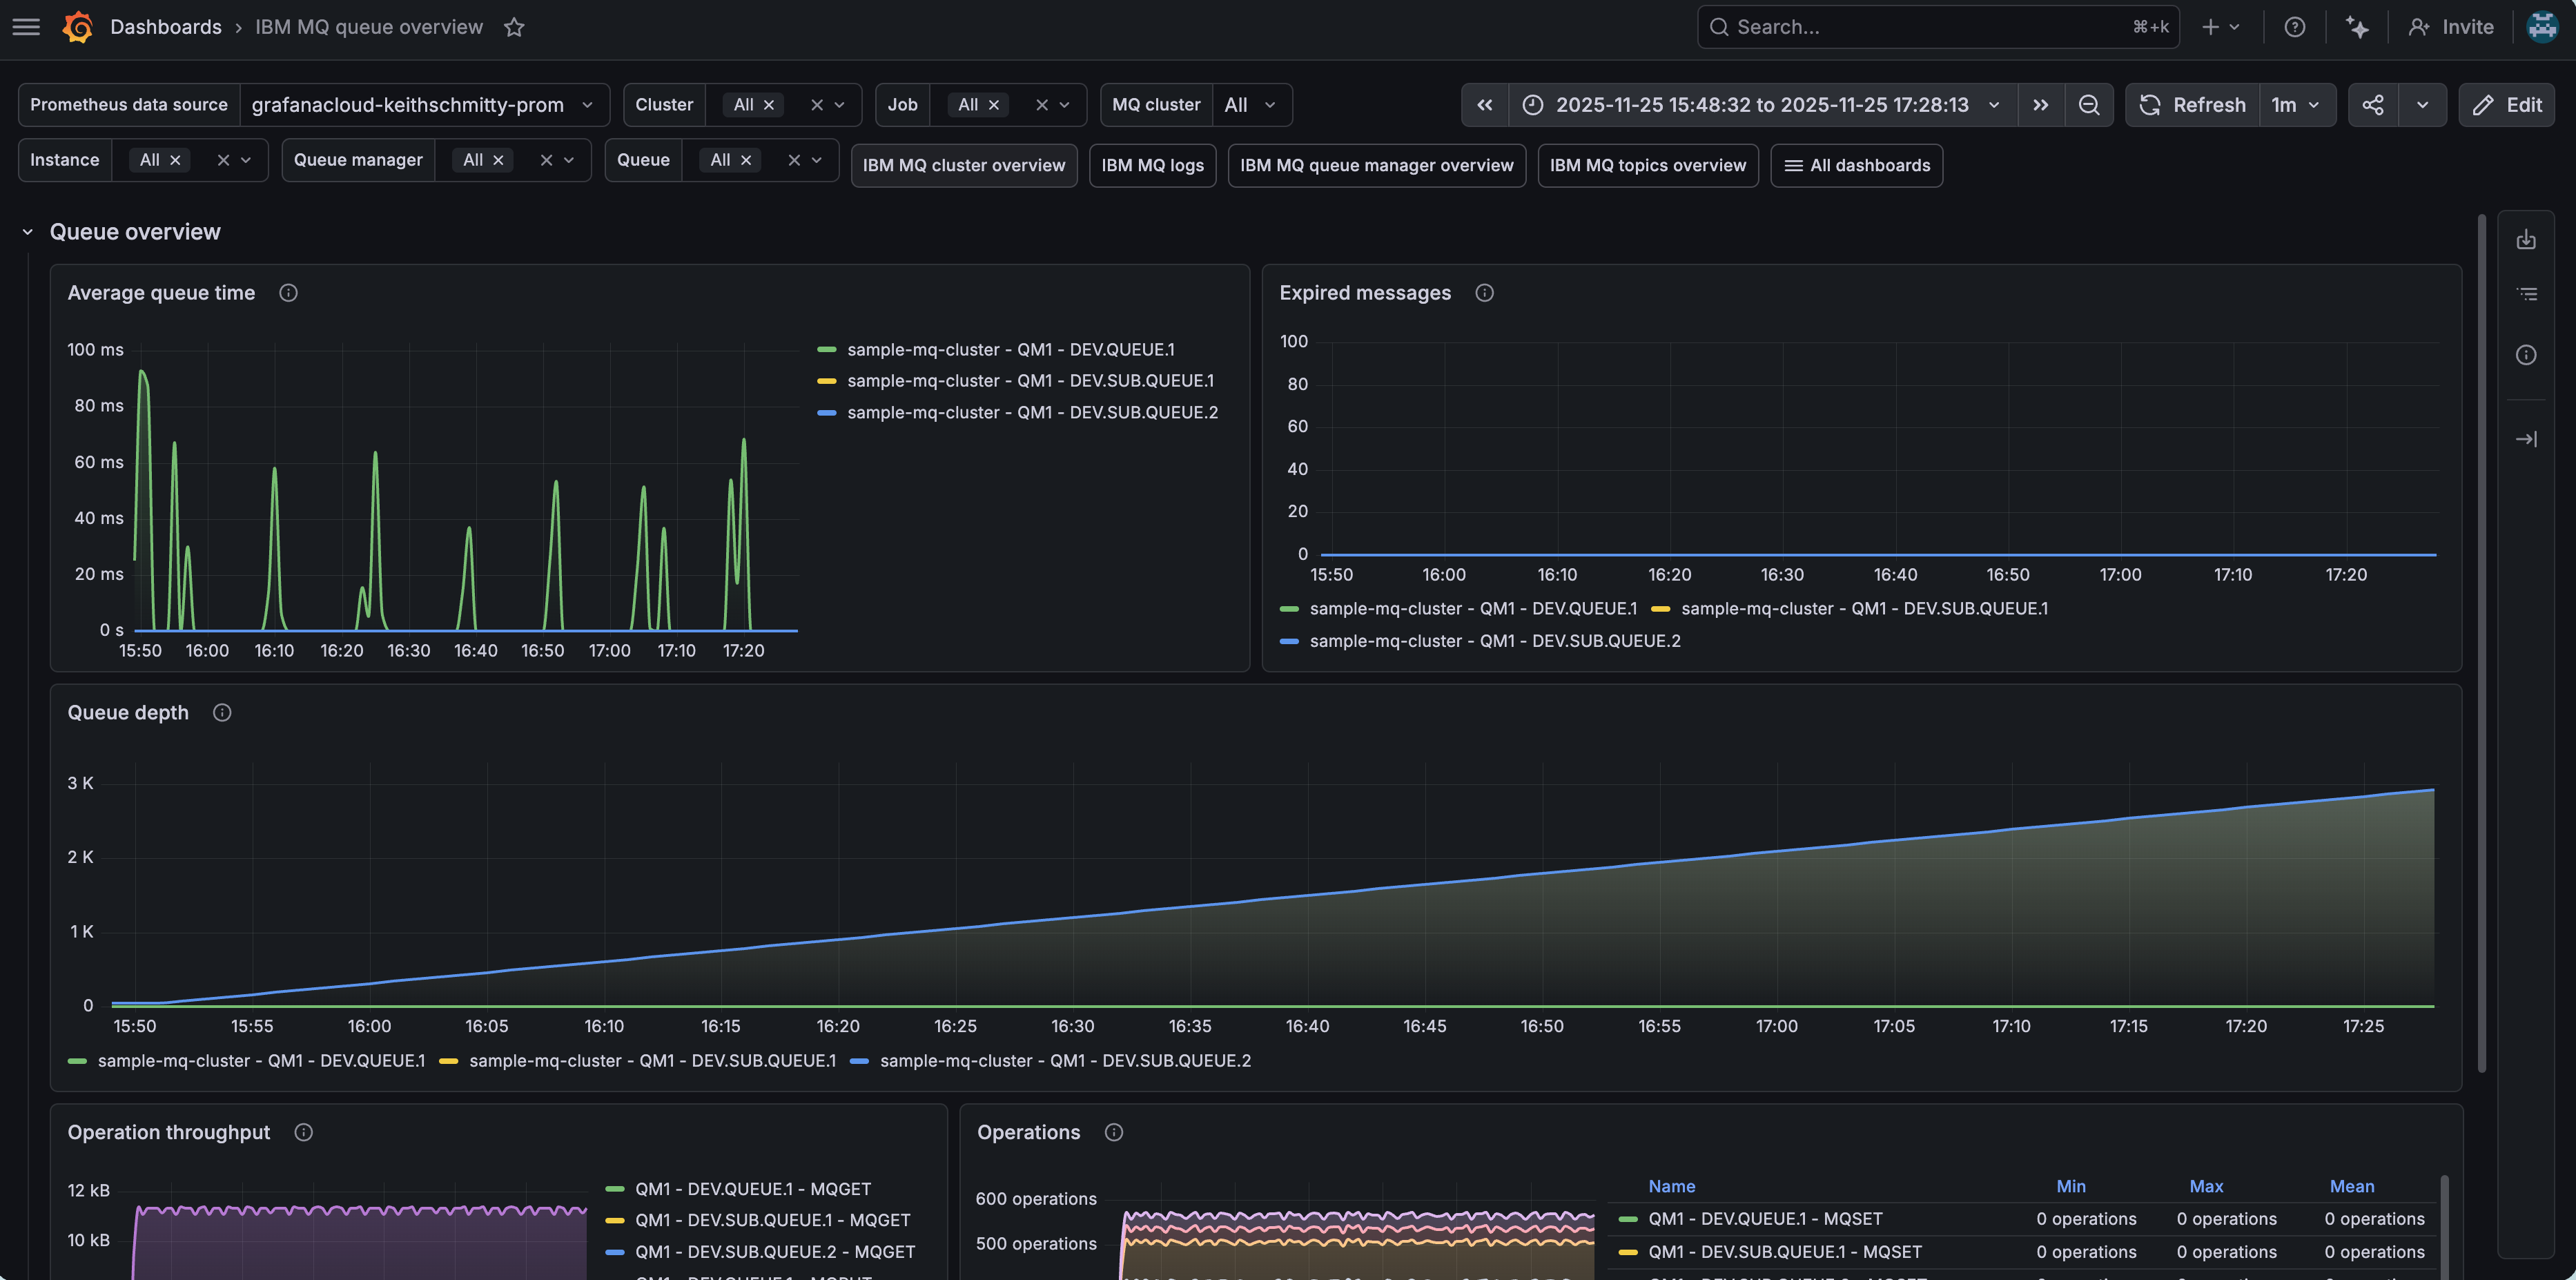
IBM MQ queue overview (1/2)
Alerts
The IBM MQ integration includes the following useful alerts:
Metrics
The most important metrics provided by the IBM MQ integration, which are used on the pre-built dashboards and Prometheus alerts, are as follows:
- ibmmq_channel_xmitq_time_long
- ibmmq_channel_xmitq_time_short
- ibmmq_cluster_suspend
- ibmmq_qmgr_active_listeners
- ibmmq_qmgr_commit_count
- ibmmq_qmgr_connection_count
- ibmmq_qmgr_expired_message_count
- ibmmq_qmgr_log_in_use_bytes
- ibmmq_qmgr_log_write_latency_seconds
- ibmmq_qmgr_published_to_subscribers_bytes
- ibmmq_qmgr_published_to_subscribers_message_count
- ibmmq_qmgr_queue_manager_file_system_free_space_percentage
- ibmmq_qmgr_queue_manager_file_system_in_use_bytes
- ibmmq_qmgr_ram_total_bytes
- ibmmq_qmgr_ram_total_estimate_for_queue_manager_bytes
- ibmmq_qmgr_status
- ibmmq_qmgr_system_cpu_time_percentage
- ibmmq_qmgr_uptime
- ibmmq_qmgr_user_cpu_time_estimate_for_queue_manager_percentage
- ibmmq_qmgr_user_cpu_time_percentage
- ibmmq_queue_average_queue_time_seconds
- ibmmq_queue_depth
- ibmmq_queue_expired_messages
- ibmmq_queue_mqclose_count
- ibmmq_queue_mqget_bytes
- ibmmq_queue_mqget_count
- ibmmq_queue_mqinq_count
- ibmmq_queue_mqopen_count
- ibmmq_queue_mqput_bytes
- ibmmq_queue_mqput_mqput1_count
- ibmmq_queue_mqset_count
- ibmmq_queue_oldest_message_age
- ibmmq_subscription_messsages_received
- ibmmq_subscription_time_since_message_published
- ibmmq_topic_messages_received
- ibmmq_topic_publisher_count
- ibmmq_topic_subscriber_count
- ibmmq_topic_time_since_msg_received
- up
Changelog
# 1.1.1 - June 2026

* Fixed issue with default filtering selectors

# 1.1.0 - June 2026

* Updated dashboards to follow new stylistic standards
* Moved logs section to a dedicated "IBM MQ logs" dashboard

# 1.0.0 - February 2024
* Updated versioning to 1.x
* Added Grafana Agent Operator configuration snippet to support IBM MQ in kubernetes cluster
* Added cluster selector to dashboard for kubernetes support

# 0.0.3 - September 2023

* New Filter Metrics option for configuring the Grafana Agent, which saves on metrics cost by dropping any metric not used by this integration. Beware that anything custom built using metrics that are not on the snippet will stop working.
* New hostname relabel option, which applies the instance name you write on the text box to the Grafana Agent configuration snippets, making it easier and less error prone to configure this mandatory label.

# 0.0.2 - August 2023

* Add regex filter for logs datasource

# 0.0.1 - July 2023

* Initial release
Cost
By connecting your IBM MQ instance to Grafana Cloud, you might incur charges. To view information on the number of active series that your Grafana Cloud account uses for metrics included in each Cloud tier, see Active series and dpm usage and Cloud tier pricing.


