Application Observability service inventory
The service inventory page lists all the services that are sending distributed traces to Grafana Cloud. Use the inventory page to filter services and navigate to:
- The Service overview page for each service
- The Service map to see a service graph
Header
Like other Application Observability pages, the service inventory page has a header with a title, sub-tabs to navigate to, and an action bar to change the data source and time-related filters and refresh intervals.
The header on the service inventory page also includes a filters editor to filter the visible services.

Action bar
Use the action bar to change the data source or sources and time-related filters and refresh intervals:
- The default time range for all panels is 30 minutes
- If Application Observability shows no data, try and change the time range
- Use the refresh interval drop-down to select an automatic refresh interval
- Click the refresh icon to toggle a manual refresh
Search
Below the action bar, use the Search field to search for a service by name.
Filters
Use filters to narrow down the list of services by full or partial name, namespace, technology, or an attribute derived from your data.
Below the action bar, click the plus icon (+) to create a filter:
- Select the field to filter by
- Select an operator, “=” to match exactly or “!=” to exclude
- Select the value to match against
Admin users can configure which attributes to use in filters from the Configuration screen, on the Semantics tab.
Deployment environment
Use the deployment environment selector to filter services by one or many environments, for example, select specific deployment zones or all production environments.
By default, Application Observability uses the value of the deployment.environment trace resource attribute to set the environment label on metrics. Admin users can change the attribute used on the Configuration screen.
If the deployment environment attribute changes, then metrics generated from that point have the updated attribute and historical metrics continue to retain the previous attribute.
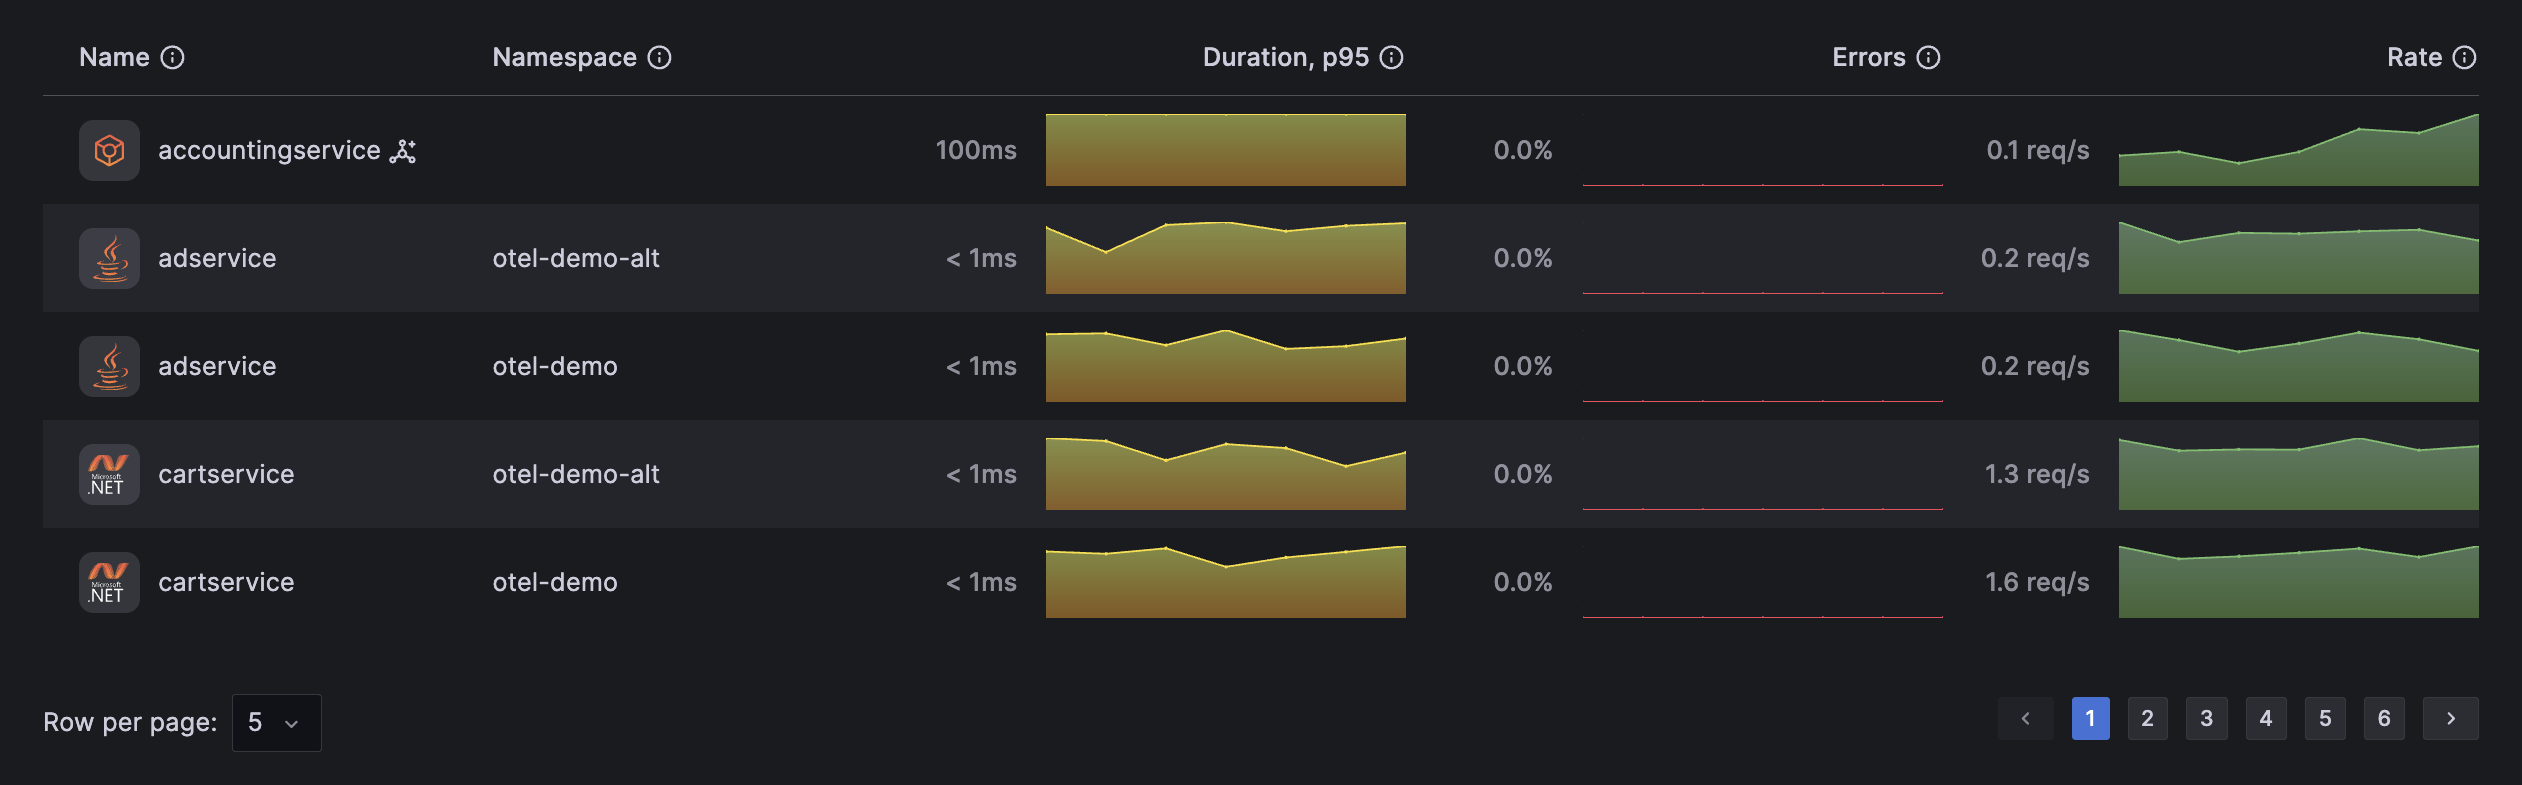
Service inventory
The Services table shows a paginated list of filtered services.
Each row contains the following information from the trace span:
- Technology icon: inferred from
telemetry.sdk.language - Service name: the value of
service.name - Service namespace: the value of
service.namespace
Each row shows the RED method trends for monitoring service health:
- Rate: the number of requests per second
- Errors: the number of errors per second
- Duration: the 95th percentile request duration
Click a service name to navigate to the service overview page.
Follow the setup documentation to add a service.
Un-instrumented Services
Instrumented services send traces to Tempo to generate metrics. Un-instrumented services don’t send traces but the plugin can infer certain information about them from the client of instrumented services that communicate with the un-instrumented services. Un-instrumented servers are typically databases and third party web services.
When Application Observability discovers an un-instrumented service it highlights it with an un-instrumented icon, for example, in the previous service inventory screenshot, Application Observability discovered the un-instrumented accountingservice.
You can inspect an un-instrumented services from the service overview but with a limited set of metrics inferred from other services.


