OpenAI integration for Grafana Cloud
The OpenAI Integration allows to you monitor OpenAI API usage using the grafana-openai-monitoring python library and grafana-openai-monitoring NPM Package. By configuring the OpenAI Integration, users can gain valuable insights into token usage rates, response times, and overall costs. This integration empowers users to make data-driven decisions while ensuring optimal utilization of OpenAI APIs.
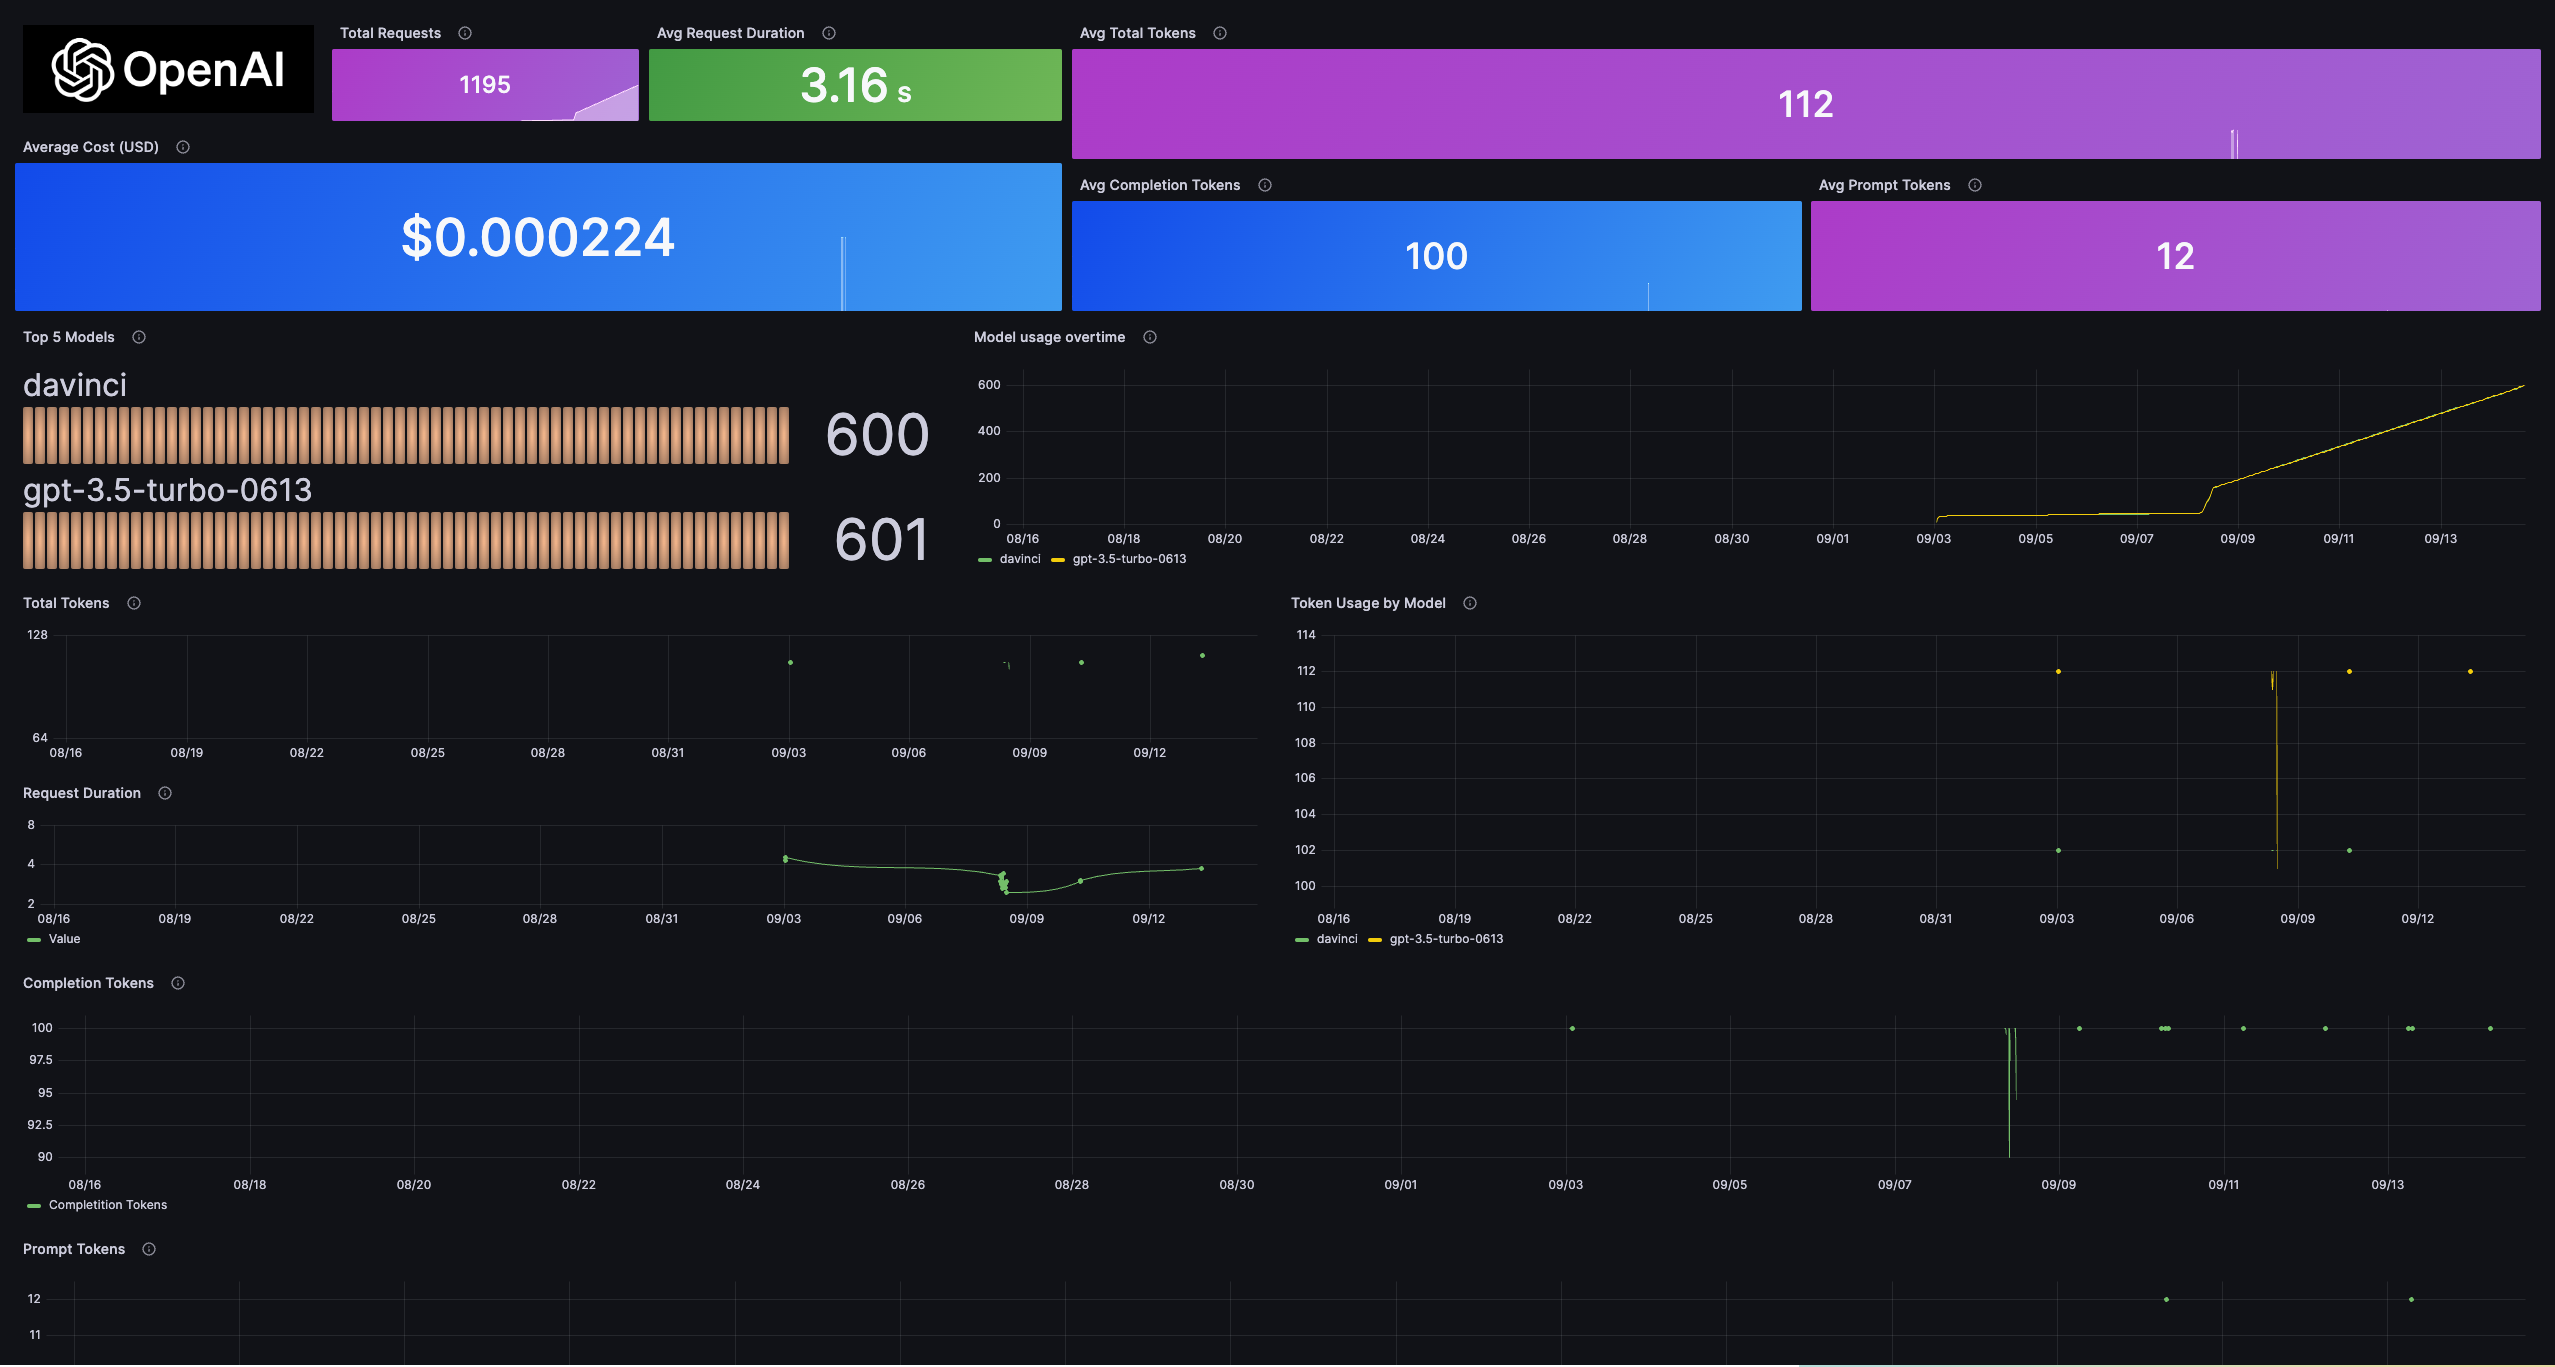
This integration includes 5 useful alerts and 1 pre-built dashboard to help monitor and visualize OpenAI metrics and logs.
Dashboards
The OpenAI integration installs the following dashboards in your Grafana Cloud instance to help monitor your system.
- OpenAI Monitoring
OpenAI API usage stat panels and Total Tokens, Request Duration panels
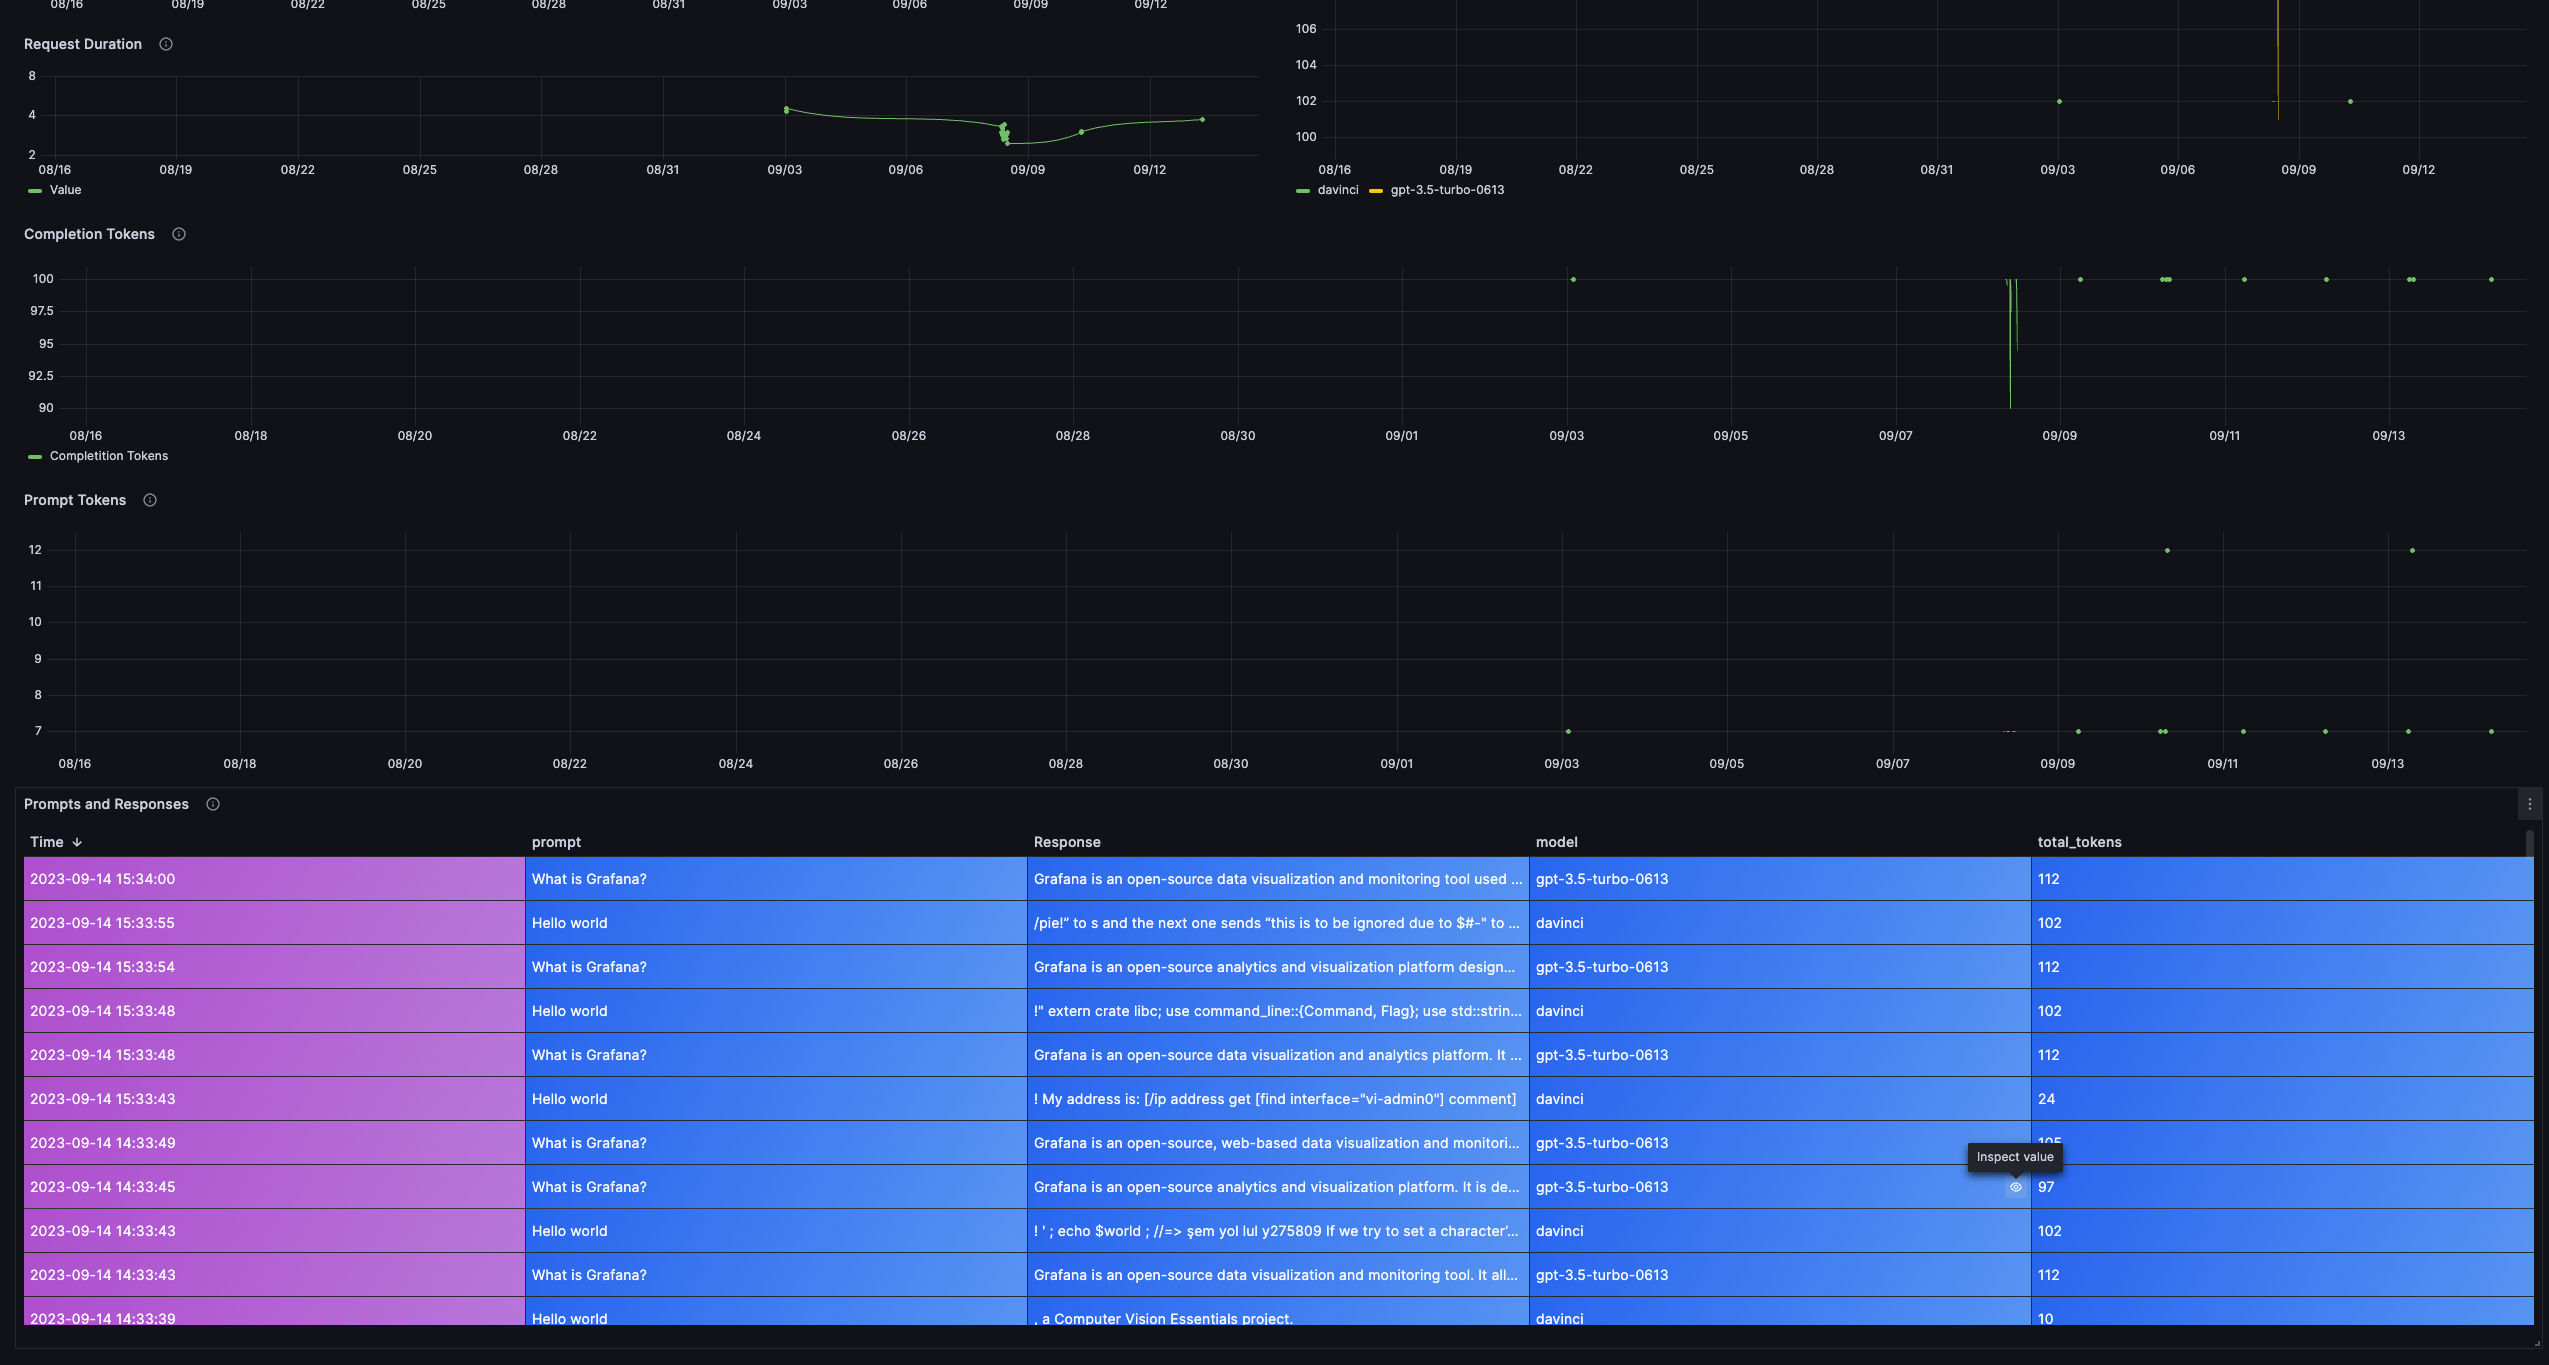
Token Usage by Model and Completition Token panels and OpenAI Prompts and Response Table
Alerts
The OpenAI integration includes the following useful alerts:
Metrics
The most important metrics provided by the OpenAI integration, which are used on the pre-built dashboard and Prometheus alerts, are as follows:
- openai_completionTokens
- openai_promptTokens
- openai_requestDuration
- openai_totalTokens
- openai_usageCost
- up
Changelog
# 1.0.0 - December 2025

* Chore: Fix incorrect semver to 1.0.0. No further changes

# 0.0.1 - September 2023

* Initial release
Cost
By connecting your OpenAI instance to Grafana Cloud, you might incur charges. To view information on the number of active series that your Grafana Cloud account uses for metrics included in each Cloud tier, see Active series and dpm usage and Cloud tier pricing.


