Varnish Cache integration for Grafana Cloud
Varnish Cache is an open source web application accelerator, also called a caching HTTP reverse proxy. This integration for Grafana Cloud allows users to collect metrics and logs for their Varnish system.
Varnish Cache integration for Grafana cloud provides a streamlined way for users to easily monitor their Varnish system with little overhead while getting the crucial information they need.
This integration supports Varnish Cache 6.0 LTS.
This integration includes 6 useful alerts and 2 pre-built dashboards to help monitor and visualize Varnish Cache metrics and logs.
Before you begin
In order for the integration to properly work, you must set up the Varnish Cache exporter for Prometheus to export metrics from Varnish.
Set up Varnish Cache exporter
Install the version of the exporter that corresponds to your operating system. The latest releases and installs can be found on
exporter installation.
To start the exporter first unzip the file that you downloaded above and traverse to the directory where the executable is. The executable will be named similar to prometheus_varnish_exporter. An example of the exporter being run is shown below:
sudo ./prometheus_varnish_exporterThe above will run a
varnishstat -jbehind the scenes and open a port 9131 that can be accessed through localhost:9131. The exported Prometheus metrics can be seen at localhost:9131/metrics.
The exporter exposes port 9131 by default but you can change this using the -web.listen-address flag when running the exporter. The use of this flag would look like this:
sudo ./prometheus_varnish_exporter -web.listen-address localhost:9595If you have multiple Varnish instances, you must specify which you are targeting with the exporter. This can be done by running the exporter with the flag -n and the name of your varnish instance. Example shown below:
sudo ./prometheus_varnish_exporter -n <instance_name>This also means you would need one exporter for each instance of Varnish Cache, each with a unique port.
For more options and help with the exporter, you can run the below command:
sudo ./prometheus_varnish_exporter -hOnce deployed, Grafana Alloy should be able to reach the Varnish Cache exporter’s exposed endpoint in order to scrape metrics.
Set up Varnish Cache logging
This integration leverages the varnishncsa utility provided by Varnish in order to produce formatted logs. Any format of log collection with varnishncsa will be picked up by the integration.
In order to setup varnishncsa, the utility must be enabled by running:
sudo systemctl enable varnishncsa
sudo systemctl start varnishncsa
By default this integration provides two commands that enable frontend and backend logging capabilities. Since Varnish does not naturally record logs into a file, a log path must be specified for varnishncsa to write to.
For darwin and linux systems respectively, the paths need to be /opt/varnish/log and /var/log/varnish.
Note: replace <instance_name> and <log_path> with the respective names of the instance and log path. If there is only one instance, then the -n <instance_name> flag can be removed. The below commands must be re-run for each instance that log collection is required for.
sudo varnishncsa -n <instance_name> -F '{"Timestamp": "%t", "Varnish-Side": "%{Varnish:side}x", "Age": %{age}o, "Handling": "%{Varnish:handling}x", "Request": "%r", "Status": "%s", "Response-Reason": "%{VSL:RespReason}x", "Fetch-Error": "%{VSL:FetchError}x", "X-Forwarded-For": "%{x-forwarded-for}i", "Remote-User": "%u", "Bytes": "%b", "Time-To-Serve": %D, "User-Agent": "%{User-agent}i", "Referer": "%{Referer}i", "X-Varnish": "%{x-varnish}o", "X-Magento-Tags": "%{x-magento-tags}o"}}' -D -w <log_path>/varnishncsa-frontend.log

sudo varnishncsa -n <instance_name> -b -F '{"Timestamp": "%t", "Varnish-Side": "%{Varnish:side}x", "Handling": "%{Varnish:handling}x", "Request": "%r", "Status": "%s", "Response-Reason": "%{VSL:RespReason}x", "Fetch-Error": "%{VSL:FetchError}x", "Bytes": "%b", "Time-To-Serve": %D}' -D -w <log_path>/varnishncsa-backend.log
For multiple instances, configure the files where logs are written to follow the following naming convention:
varnishncsa-frontend-<instance_name>.log
varnishncsa-backend-<instance_name>.log
Install Varnish Cache integration for Grafana Cloud
- In your Grafana Cloud stack, click Connections in the left-hand menu.
- Find Varnish Cache and click its tile to open the integration.
- Review the prerequisites in the Configuration Details tab and set up Grafana Alloy to send Varnish Cache metrics and logs to your Grafana Cloud instance.
- Click Install to add this integration’s pre-built dashboards and alerts to your Grafana Cloud instance, and you can start monitoring your Varnish Cache setup.
Configuration snippets for Grafana Alloy
Advanced mode
The following snippets provide examples to guide you through the configuration process.
To instruct Grafana Alloy to scrape your Varnish Cache instances, manually copy and append the snippets to your alloy configuration file, then follow subsequent instructions.
Advanced metrics snippets
discovery.relabel "metrics_integrations_integrations_varnish_cache" {
	targets = [{
		__address__ = "<exporter_host>:<exporter_port>",
	}]

	rule {
		target_label = "instance"
		replacement  = constants.hostname
	}
}

prometheus.scrape "metrics_integrations_integrations_varnish_cache" {
	targets    = discovery.relabel.metrics_integrations_integrations_varnish_cache.output
	forward_to = [prometheus.remote_write.metrics_service.receiver]
	job_name   = "integrations/varnish-cache"
}
To monitor your Varnish Cache instance, you must use a discovery.relabel component to discover your Varnish Cache Prometheus endpoint and apply appropriate labels, followed by a prometheus.scrape component to scrape it.
Configure the following properties within each discovery.relabel component:
__address__: The address to your Varnish Cache Prometheus metrics endpoint.instancelabel:constants.hostnamesets theinstancelabel to your Grafana Alloy server hostname. If that is not suitable, change it to a value uniquely identifies this Varnish Cache instance. Make sure this label value is the same for all telemetry data collected for this instance.
If you have multiple Varnish Cache servers to scrape, configure one discovery.relabel for each and scrape them by including each under targets within the prometheus.scrape component.
Advanced logs snippets
darwin
local.file_match "logs_integrations_integrations_varnish_cache" {
	path_targets = [{
		__address__ = "localhost",
		__path__    = "<log_path>/varnishncsa*.log",
		instance    = constants.hostname,
		job         = "integrations/varnish-cache",
	}]
}

loki.source.file "logs_integrations_integrations_varnish_cache" {
	targets    = local.file_match.logs_integrations_integrations_varnish_cache.targets
	forward_to = [loki.write.grafana_cloud_loki.receiver]
}
To monitor your Varnish Cache instance logs, you will use a combination of the following components:
local.file_match defines where to find the log file to be scraped. Change the following properties according to your environment:
__address__: The Varnish Cache instance address__path__: The path to the log file.instancelabel:constants.hostnamesets theinstancelabel to your Grafana Alloy server hostname. If that is not suitable, change it to a value uniquely identifies this Varnish Cache instance. Make sure this label value is the same for all telemetry data collected for this instance.
loki.source.file sends logs to Loki.
Kubernetes log collection
These instructions assume the use of the official Varnish helm chart.
In the sample application, we generated YAML from the official helm chart and customized it in the following ways:
- Add an initContainer that mounts the volume for logs and creates the log files to be written to.
- Add two
varnishncsasidecars, one for frontend logs, the other for backend logs. - Add one Alloy sidecar with appropriate volumeMounts to the log files and the custom Alloy configuration
The Varnish cache container, the initContainer, and the
varnishncsasidecars must be run as thevarnishloguser. In the following YAML examples, you’ll noticerunAsUseris set to thevarnishloguser ID, which may be different in your environment.
Log file initContainer
This example is for one instance, where only one log file exists per log type.
Here’s an example snippet for creating an initContainer that mounts the log file location and creates the necessary log files:
initContainers:
- name: init-script
  image: alpine:latest
  securityContext:
    runAsNonRoot: true
    runAsUser: 103
  command: ['sh', '-c', 'touch /var/log/varnish/varnishncsa-frontend.log /var/log/varnish/varnishncsa-backend.log && chmod 666 /var/log/varnish/*.log']
  volumeMounts:
  - name: varnish-log
    mountPath: /var/log/varnish
Varnish log sidecars
The varnishncsa sidecars for logging need to be deployed with the appropriate arguments and volume mounts. Refer to the this example deployment for details on the varnishncsa arguments.
Here is an example snippet for the frontend logs sidecar:
- name: varnish-cache-ncsa-frontend
  securityContext:
    runAsNonRoot: true
    runAsUser: 103
  image: {{ .Values.varnishImage }}
  imagePullPolicy: IfNotPresent
  command: ["/bin/sh", "-c"]
  args: ["varnishncsa -n /var/lib/varnish -F '{\"Timestamp\": \"%t\", \"Varnish-Side\": \"%{Varnish:side}x\", \"Age\": %{age}o, \"Handling\": \"%{Varnish:handling}x\", \"Request\": \"%r\", \"Status\": \"%s\", \"Response-Reason\": \"%{VSL:RespReason}x\", \"Fetch-Error\": \"%{VSL:FetchError}x\", \"X-Forwarded-For\": \"%{x-forwarded-for}i\", \"Remote-User\": \"%u\", \"Bytes\": \"%b\", \"Time-To-Serve\": %D, \"User-Agent\": \"%{User-agent}i\", \"Referer\": \"%{Referer}i\", \"X-Varnish\": \"%{x-varnish}o\", \"X-Magento-Tags\": \"%{x-magento-tags}o\"}' -w /var/log/varnish/varnishncsa-frontend.log"]
  volumeMounts:
  - name: custom-varnish-vsm
    mountPath: /var/lib/varnish
    readOnly: true
  - name: varnish-secret
    mountPath: /etc/varnish/secret
    subPath: secret
  - name: varnish-log
    mountPath: /var/log/varnish
Alloy sidecar
The Alloy sidecar is configured to collect logs from each file. Here’s an example snippet:
apiVersion: v1
kind: ConfigMap
metadata:
  name: alloy-varnish-log-config
  labels:
    alloy-config: varnish-logs
data:
  config.alloy: |
    logging {
      level  = "info"
      format = "logfmt"
    }

    loki.write "logs_integrations" {
      endpoint {
        url = "http://loki.default.svc.cluster.local:3100/loki/api/v1/push"

      }
      external_labels = {"cluster" = "my-cluster"}
    }

    local.file_match "logs_integrations_integrations_varnish_cache" {
      path_targets = [{
        __address__ = "localhost",
        __path__    = "/var/log/varnish/varnishncsa-*.log",
        instance    = "custom-varnish-cache.sample-apps.svc:9131",
        job         = "integrations/varnish-cache",
      }]
    }

    loki.source.file "logs_integrations_integrations_apache_airflow" {
      targets    = local.file_match.logs_integrations_integrations_varnish_cache.targets
      forward_to = [loki.write.logs_integrations.receiver]
    }
linux
local.file_match "logs_integrations_integrations_varnish_cache" {
	path_targets = [{
		__address__ = "localhost",
		__path__    = "<log_path>/varnishncsa*.log",
		instance    = constants.hostname,
		job         = "integrations/varnish-cache",
	}]
}

loki.source.file "logs_integrations_integrations_varnish_cache" {
	targets    = local.file_match.logs_integrations_integrations_varnish_cache.targets
	forward_to = [loki.write.grafana_cloud_loki.receiver]
}
To monitor your Varnish Cache instance logs, you will use a combination of the following components:
local.file_match defines where to find the log file to be scraped. Change the following properties according to your environment:
__address__: The Varnish Cache instance address__path__: The path to the log file.instancelabel:constants.hostnamesets theinstancelabel to your Grafana Alloy server hostname. If that is not suitable, change it to a value uniquely identifies this Varnish Cache instance. Make sure this label value is the same for all telemetry data collected for this instance.
loki.source.file sends logs to Loki.
Kubernetes log collection
These instructions assume the use of the official Varnish helm chart.
In the sample application, we generated YAML from the official helm chart and customized it in the following ways:
- Add an initContainer that mounts the volume for logs and creates the log files to be written to.
- Add two
varnishncsasidecars, one for frontend logs, the other for backend logs. - Add one Alloy sidecar with appropriate volumeMounts to the log files and the custom Alloy configuration
The Varnish cache container, the initContainer, and the
varnishncsasidecars must be run as thevarnishloguser. In the following YAML examples, you’ll noticerunAsUseris set to thevarnishloguser ID, which may be different in your environment.
Log file initContainer
This example is for one instance, where only one log file exists per log type.
Here’s an example snippet for creating an initContainer that mounts the log file location and creates the necessary log files:
initContainers:
- name: init-script
  image: alpine:latest
  securityContext:
    runAsNonRoot: true
    runAsUser: 103
  command: ['sh', '-c', 'touch /var/log/varnish/varnishncsa-frontend.log /var/log/varnish/varnishncsa-backend.log && chmod 666 /var/log/varnish/*.log']
  volumeMounts:
  - name: varnish-log
    mountPath: /var/log/varnish
Varnish log sidecars
The varnishncsa sidecars for logging need to be deployed with the appropriate arguments and volume mounts. Refer to the this example deployment for details on the varnishncsa arguments.
Here is an example snippet for the frontend logs sidecar:
- name: varnish-cache-ncsa-frontend
  securityContext:
    runAsNonRoot: true
    runAsUser: 103
  image: {{ .Values.varnishImage }}
  imagePullPolicy: IfNotPresent
  command: ["/bin/sh", "-c"]
  args: ["varnishncsa -n /var/lib/varnish -F '{\"Timestamp\": \"%t\", \"Varnish-Side\": \"%{Varnish:side}x\", \"Age\": %{age}o, \"Handling\": \"%{Varnish:handling}x\", \"Request\": \"%r\", \"Status\": \"%s\", \"Response-Reason\": \"%{VSL:RespReason}x\", \"Fetch-Error\": \"%{VSL:FetchError}x\", \"X-Forwarded-For\": \"%{x-forwarded-for}i\", \"Remote-User\": \"%u\", \"Bytes\": \"%b\", \"Time-To-Serve\": %D, \"User-Agent\": \"%{User-agent}i\", \"Referer\": \"%{Referer}i\", \"X-Varnish\": \"%{x-varnish}o\", \"X-Magento-Tags\": \"%{x-magento-tags}o\"}' -w /var/log/varnish/varnishncsa-frontend.log"]
  volumeMounts:
  - name: custom-varnish-vsm
    mountPath: /var/lib/varnish
    readOnly: true
  - name: varnish-secret
    mountPath: /etc/varnish/secret
    subPath: secret
  - name: varnish-log
    mountPath: /var/log/varnish
Alloy sidecar
The Alloy sidecar is configured to collect logs from each file. Here’s an example snippet:
apiVersion: v1
kind: ConfigMap
metadata:
  name: alloy-varnish-log-config
  labels:
    alloy-config: varnish-logs
data:
  config.alloy: |
    logging {
      level  = "info"
      format = "logfmt"
    }

    loki.write "logs_integrations" {
      endpoint {
        url = "http://loki.default.svc.cluster.local:3100/loki/api/v1/push"

      }
      external_labels = {"cluster" = "my-cluster"}
    }

    local.file_match "logs_integrations_integrations_varnish_cache" {
      path_targets = [{
        __address__ = "localhost",
        __path__    = "/var/log/varnish/varnishncsa-*.log",
        instance    = "custom-varnish-cache.sample-apps.svc:9131",
        job         = "integrations/varnish-cache",
      }]
    }

    loki.source.file "logs_integrations_integrations_apache_airflow" {
      targets    = local.file_match.logs_integrations_integrations_varnish_cache.targets
      forward_to = [loki.write.logs_integrations.receiver]
    }
Kubernetes instructions
Before you begin with Kubernetes
Please note: These instructions assume the use of the Kubernetes Monitoring Helm chart
In order for the integration to properly work, you must set up the Varnish Cache exporter for Prometheus to export metrics from Varnish.
Set up Varnish Cache exporter
Install the version of the exporter that corresponds to your operating system. The latest releases and installs can be found on
exporter installation.
To start the exporter first unzip the file that you downloaded above and traverse to the directory where the executable is. The executable will be named similar to prometheus_varnish_exporter. An example of the exporter being run is shown below:
sudo ./prometheus_varnish_exporterThe above will run a
varnishstat -jbehind the scenes and open a port 9131 that can be accessed through localhost:9131. The exported Prometheus metrics can be seen at localhost:9131/metrics.
The exporter exposes port 9131 by default but you can change this using the -web.listen-address flag when running the exporter. The use of this flag would look like this:
sudo ./prometheus_varnish_exporter -web.listen-address localhost:9595If you have multiple Varnish instances, you must specify which you are targeting with the exporter. This can be done by running the exporter with the flag -n and the name of your varnish instance. Example shown below:
sudo ./prometheus_varnish_exporter -n <instance_name>This also means you would need one exporter for each instance of Varnish Cache, each with a unique port.
For more options and help with the exporter, you can run the below command:
sudo ./prometheus_varnish_exporter -hOnce deployed, Grafana Alloy should be able to reach the Varnish Cache exporter’s exposed endpoint in order to scrape metrics.
Configuration snippets for Kubernetes Helm chart
The following snippets provide examples to guide you through the configuration process.
To scrape your Varnish Cache instances, manually modify your Kubernetes Monitoring Helm chart with these configuration snippets.
Replace any values between the angle brackets <> in the provided snippets with your desired configuration values.
Metrics snippets
alloy-metrics:
    extraConfig: |-
        discovery.kubernetes "varnish" {
            role = "service"
            selectors {
                role = "service"
                field = "metadata.name=<varnish-cache-service>"
            }
            namespaces {
                names = ["<varnish-cache-namespace>"]
            }
        }

        discovery.relabel "varnish" {
            targets = discovery.kubernetes.varnish.targets
            rule {
                source_labels = ["__meta_kubernetes_pod_container_port_number"]
                regex = "<varnish-cache-exporter-port>"
                action = "keep"
            }
        }

        prometheus.scrape "varnish" {
            targets      = discovery.relabel.varnish.output
            job_name     = "integrations/varnish-cache"
            forward_to   = [prometheus.remote_write.grafana_cloud_metrics.receiver]
        }
Logs snippets
<p>
To collect logs from Varnish Cache, <code>varnishncsa</code> and Alloy sidecars must be added to the deployment configuration.
Additional ConfigMaps for custom Alloy configurations must be created. The deployment will need an additional volume for logs and all sidecars will need <code>volumeMounts</code> for that volume.
</p>
<p>
For additional guidance, refer to <a href="https://grafana.com/docs/grafana-cloud/monitor-infrastructure/integrations/integration-reference/integration-varnish-cache/#kubernetes-log-collection">this documentation</a>
</p>
Dashboards
The Varnish Cache integration installs the following dashboards in your Grafana Cloud instance to help monitor your system.
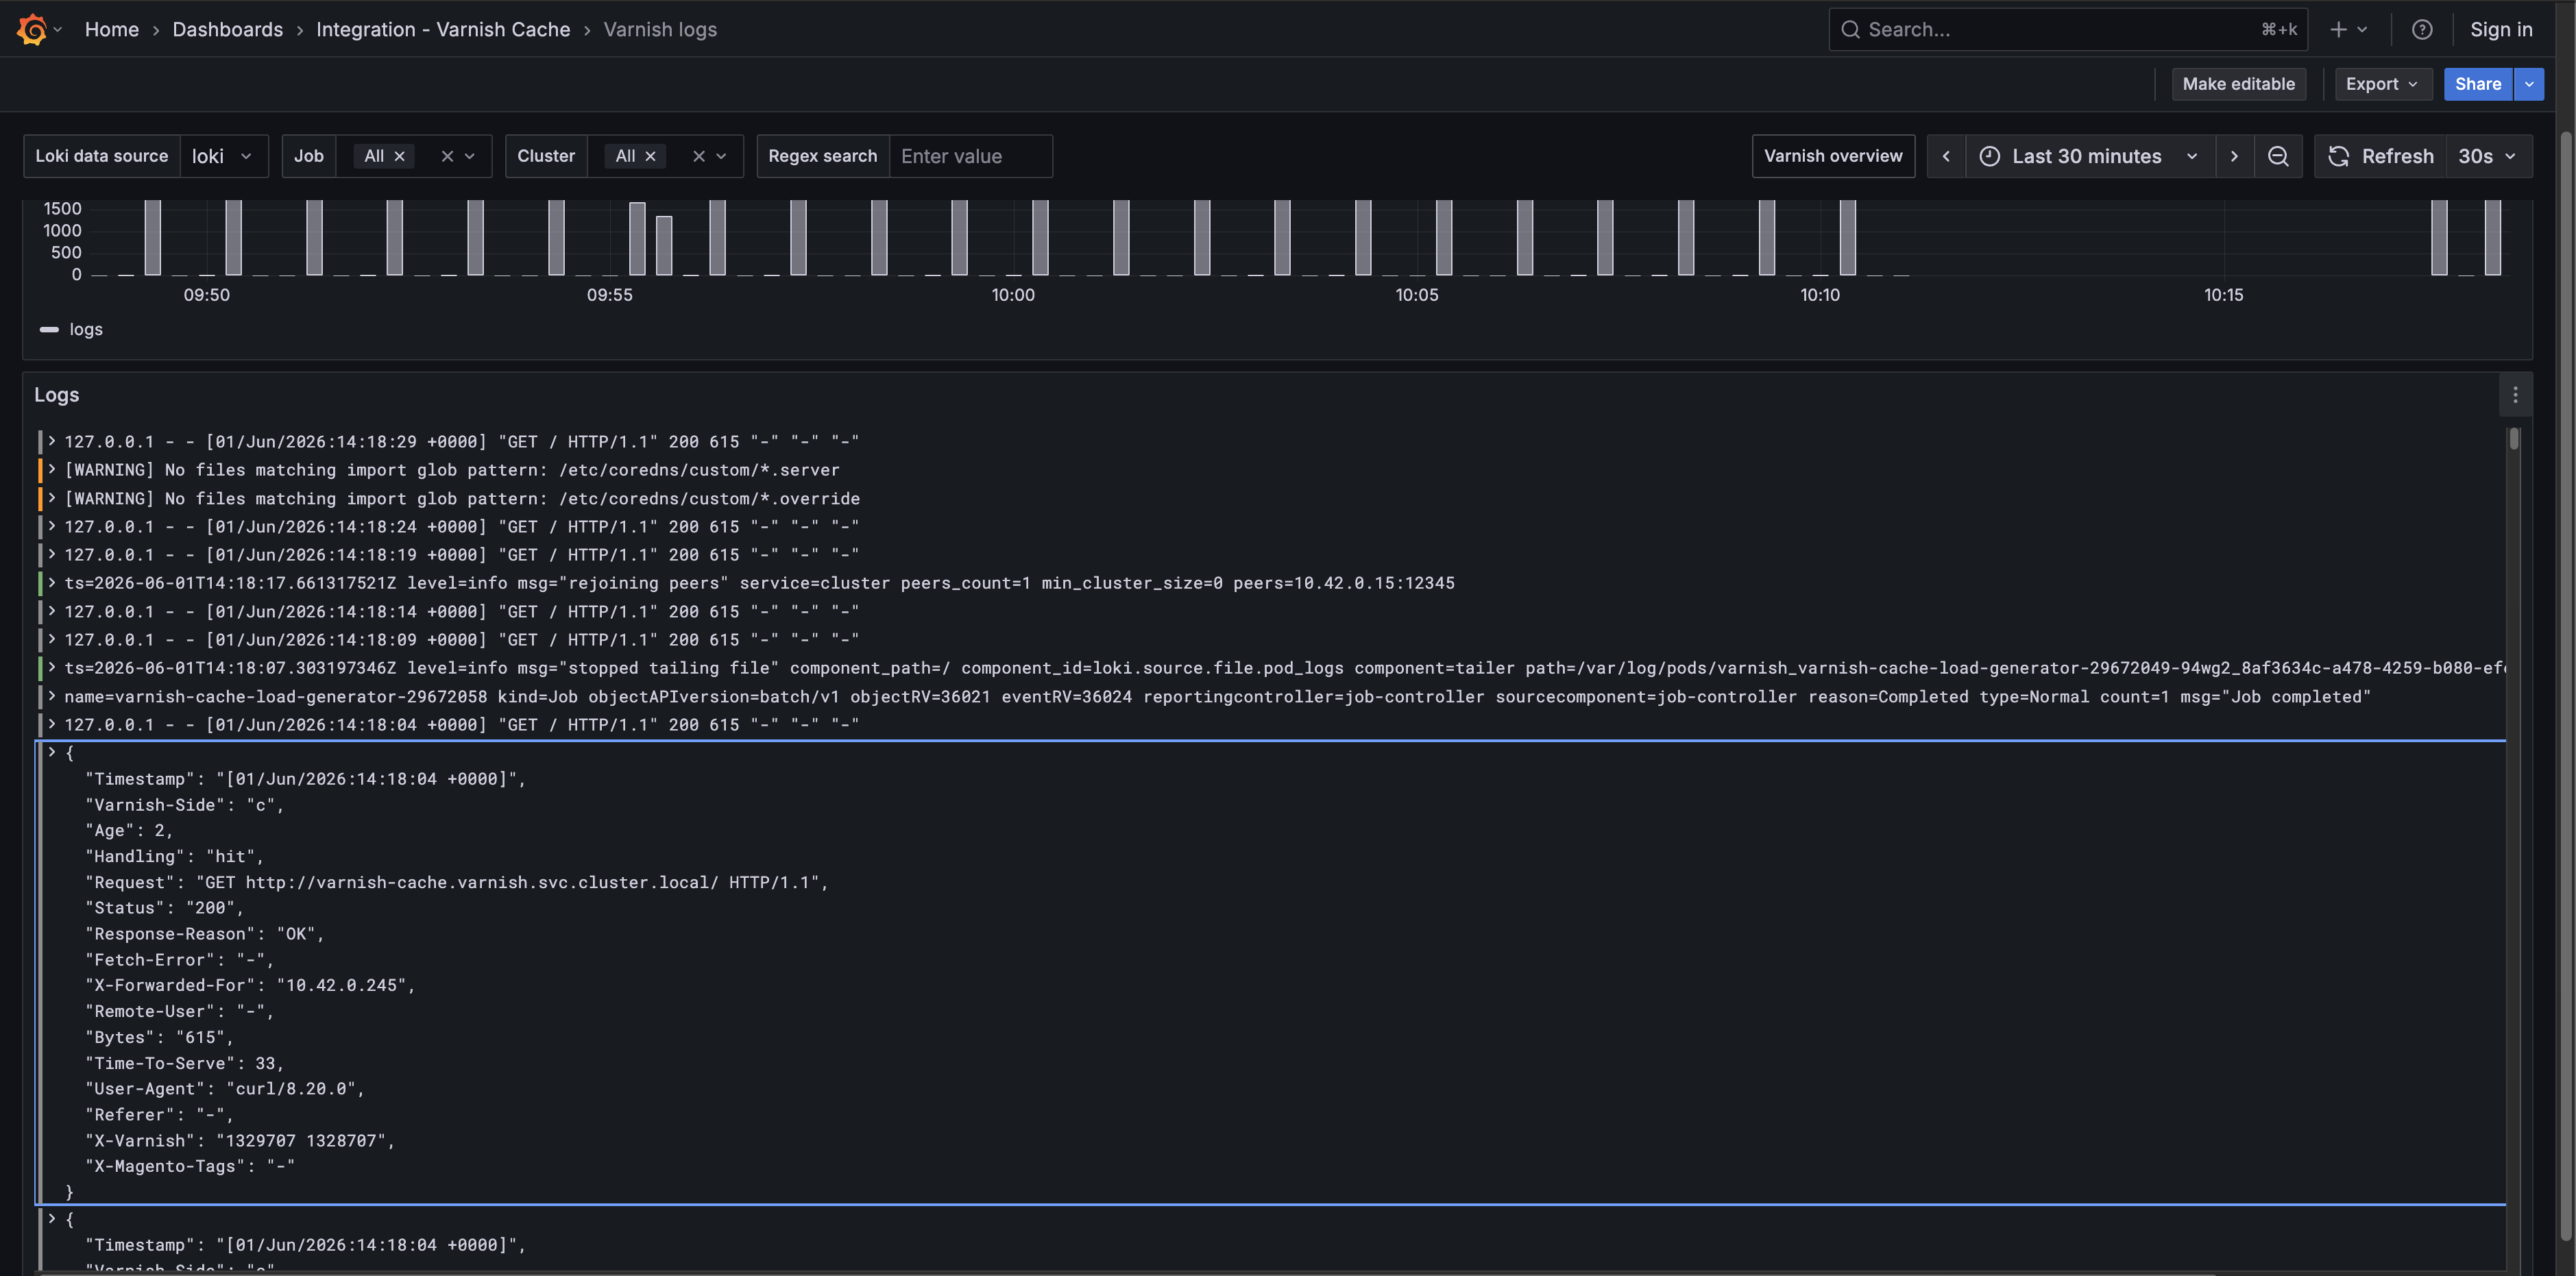
- Varnish logs
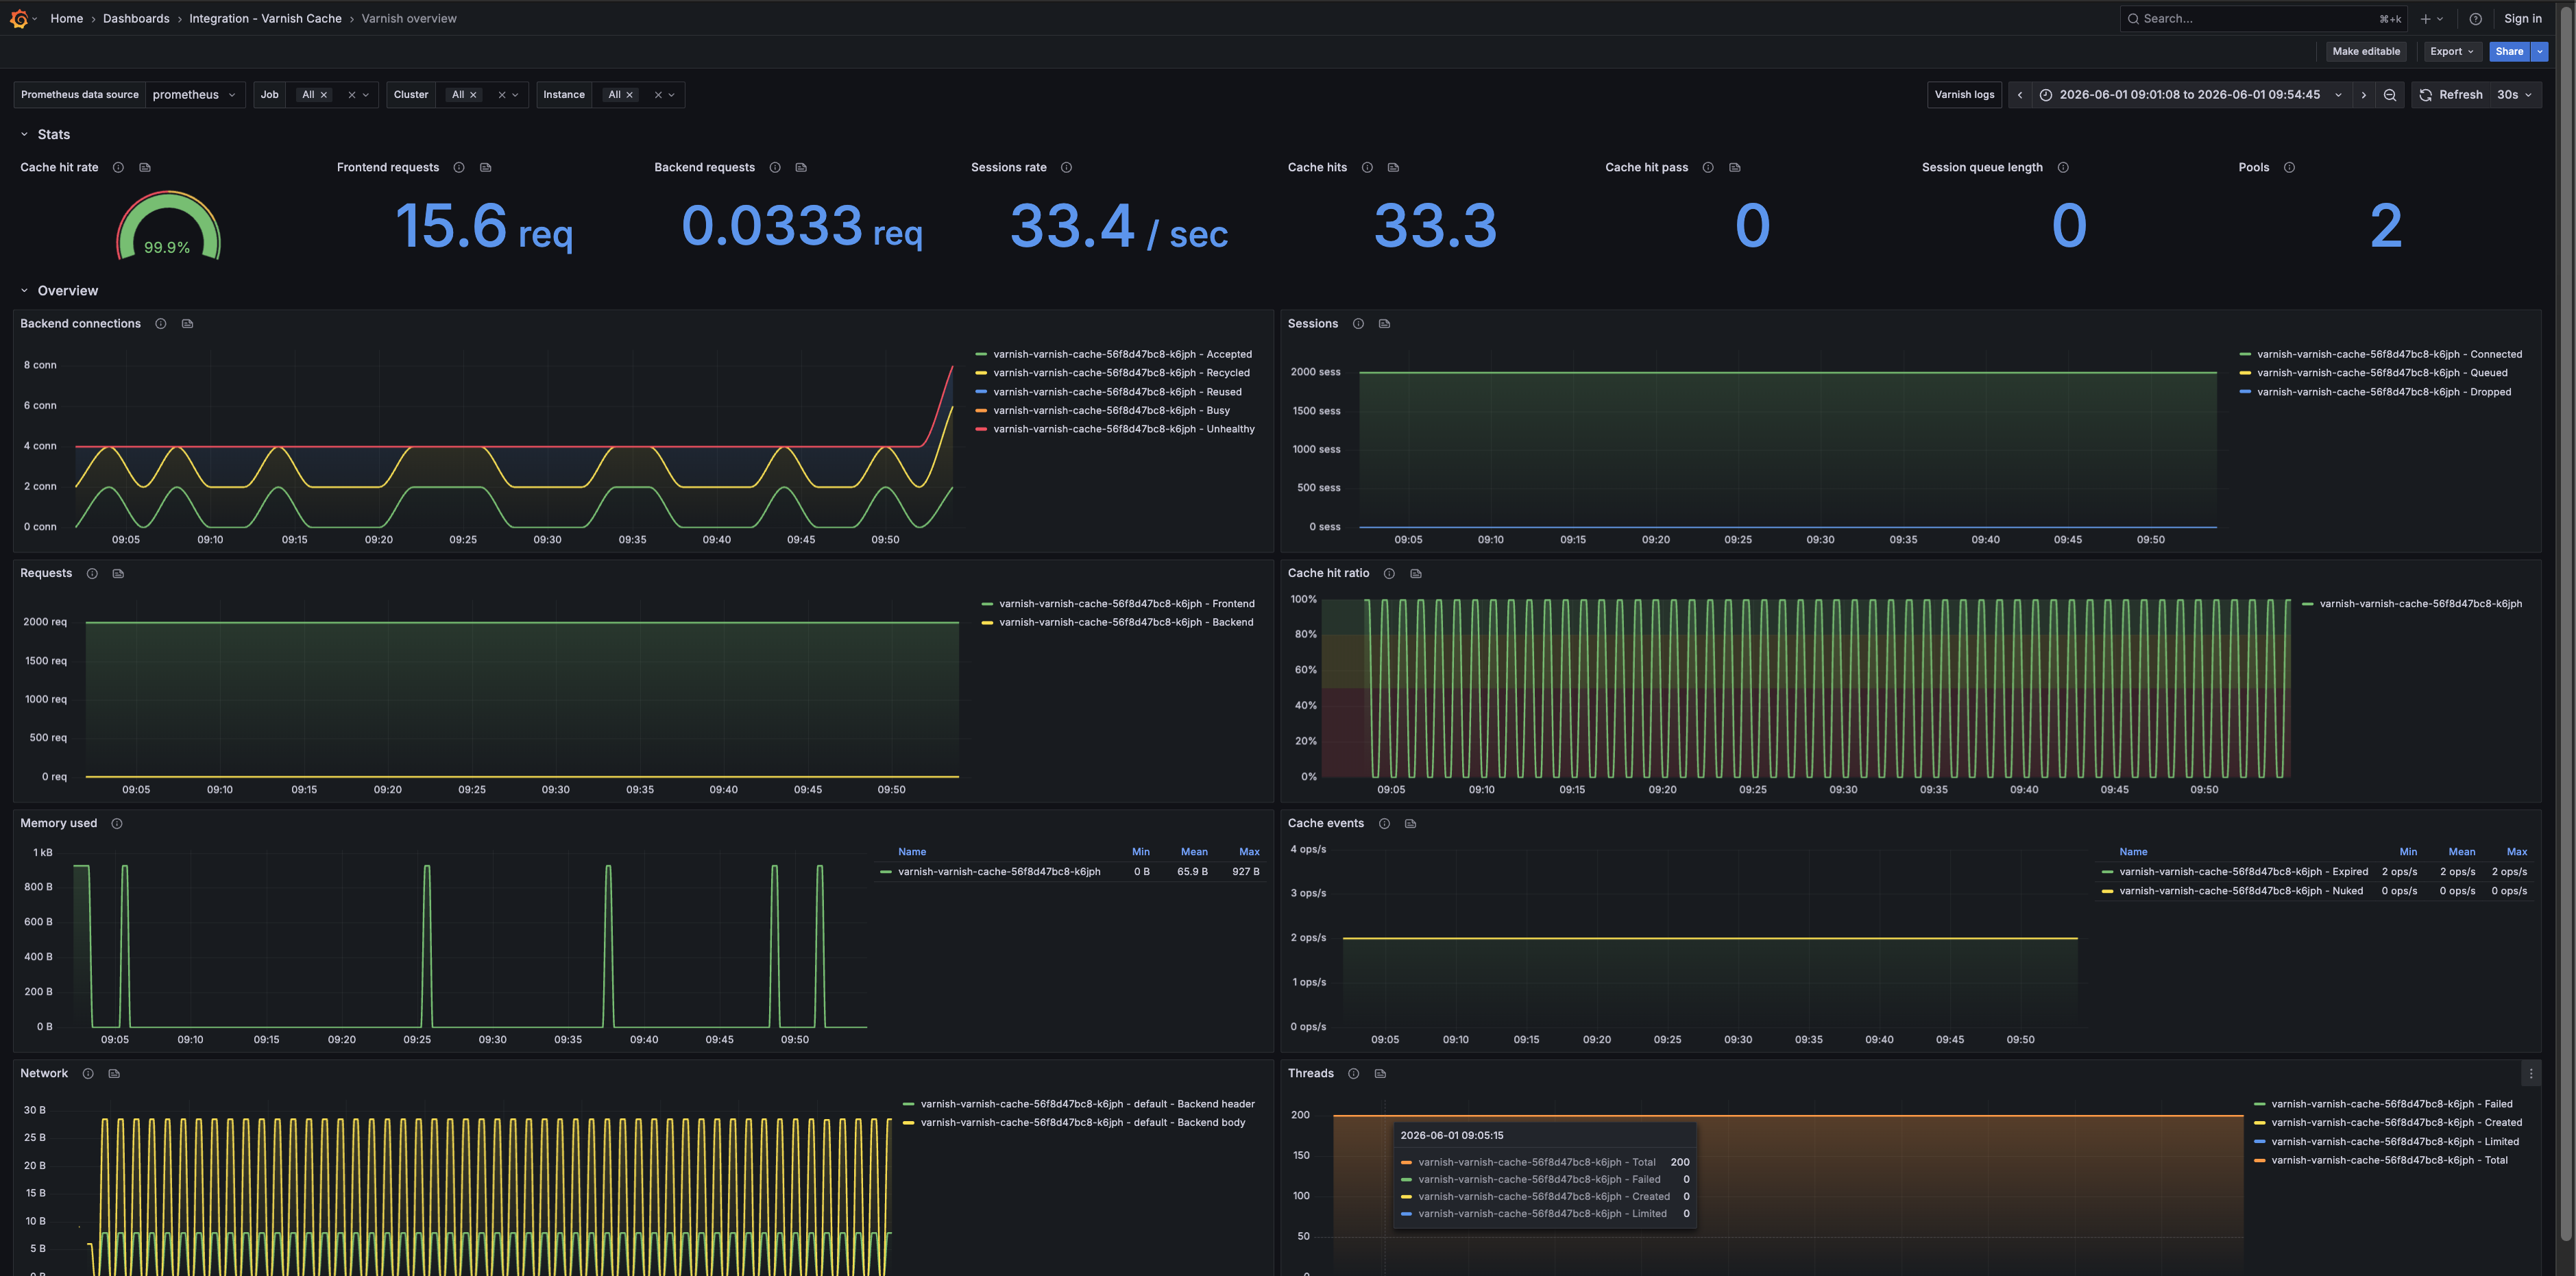
- Varnish overview
Varnish Cache overview (overview)
Varnish logs
Alerts
The Varnish Cache integration includes the following useful alerts:
Metrics
The most important metrics provided by the Varnish Cache integration, which are used on the pre-built dashboards and Prometheus alerts, are as follows:
- up
- varnish_backend_beresp_bodybytes
- varnish_backend_beresp_hdrbytes
- varnish_main_backend_busy
- varnish_main_backend_conn
- varnish_main_backend_recycle
- varnish_main_backend_req
- varnish_main_backend_reuse
- varnish_main_backend_unhealthy
- varnish_main_cache_hit
- varnish_main_cache_hitpass
- varnish_main_cache_miss
- varnish_main_client_req
- varnish_main_n_expired
- varnish_main_n_lru_nuked
- varnish_main_pools
- varnish_main_s_resp_bodybytes
- varnish_main_s_resp_hdrbytes
- varnish_main_sessions
- varnish_main_sessions_total
- varnish_main_thread_queue_len
- varnish_main_threads
- varnish_main_threads_created
- varnish_main_threads_failed
- varnish_main_threads_limited
- varnish_sma_g_bytes
- varnish_sma_g_space
Changelog
# 1.1.1 - June 2026

* Fixed issue with default filtering selectors

# 1.1.0 - June 2026

* Updated dashboards to follow new stylistic standards
* Added a dedicated `Varnish logs` dashboard.

# 1.0.0 - August 2024

* Add Kubernetes as a supported platform using Grafana Alloy

# 0.0.3 - September 2023

* New Filter Metrics option for configuring the Grafana Agent, which saves on metrics cost by dropping any metric not used by this integration. Beware that anything custom built using metrics that are not on the snippet will stop working.
* New hostname relabel option, which applies the instance name you write on the text box to the Grafana Agent configuration snippets, making it easier and less error prone to configure this mandatory label.

# 0.0.2 - August 2023

* Add regex filter for logs datasource

# 0.0.1 - July 2023

* Initial release
Cost
By connecting your Varnish Cache instance to Grafana Cloud, you might incur charges. To view information on the number of active series that your Grafana Cloud account uses for metrics included in each Cloud tier, see Active series and dpm usage and Cloud tier pricing.


