Docs
Grafana Cloud Traces is a fully managed distributed tracing system powered by Tempo that helps teams understand request flows and troubleshoot performance issues at scale.

Pinpoint a problematic service so you know exactly what to fix and who should fix it. View upstream and downstream connections to understand the ripple effects across your system
Leverage compatibility with OpenTelemetry, Jaeger, and Zipkin trace formats to get started quickly with minimal changes to your application instrumentation or use OpenTelemetry’s auto-instrumentation to get traces without adding any new code
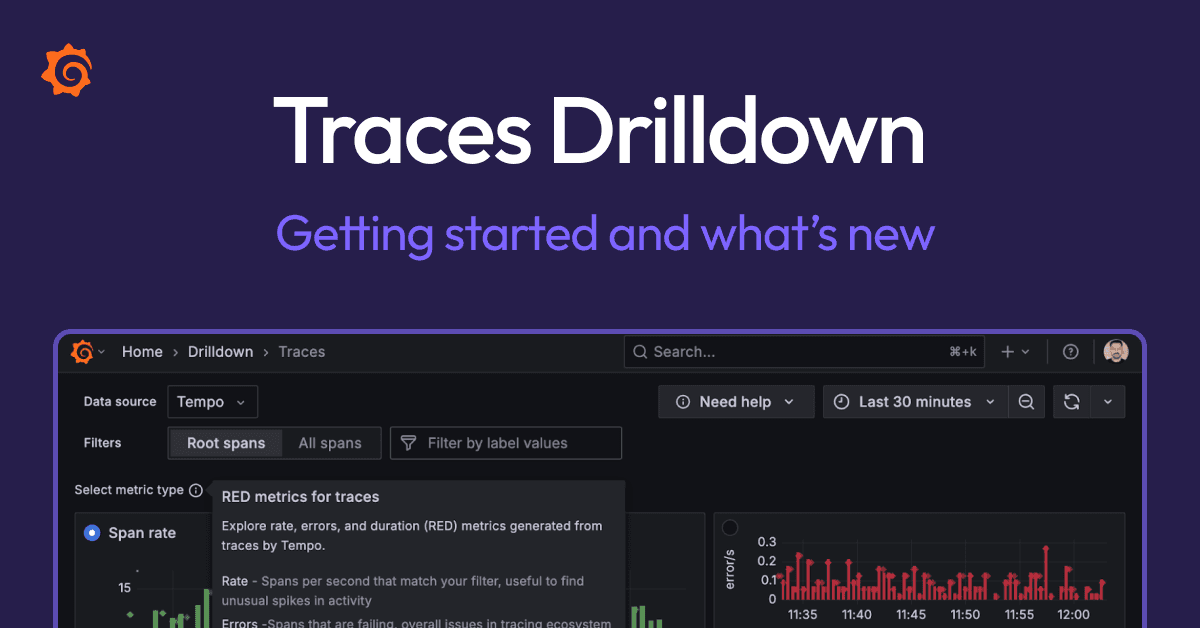
Automatically derive request rate, error rate, and duration (RED) metrics for your services. Understand overall system health at a glance, and get alerts when something goes wrong
Trusted by everyone from startups to the Fortune 500
Quickly pinpoint performance bottlenecks by correlating logs to traces
Easily explore errors, anomalies, and system changes with Grafana Assistant
Pivot smoothly between observability signals thanks to Grafana Cloud’s tightly integrated stack, which brings together metrics, logs, and traces with Grafana visualizations
Send spans from any app via Alloy or the OpenTelemetry Collector. OpenTelemetry, Jaeger, and Zipkin trace formats are all supported
Turn traces into insights by building dynamic Grafana dashboards and visualizations from trace data
Explore your traces with TraceQL, which is OpenTelemetry-native
Not familiar with TraceQL? Use Grafana Traces Drilldown to visualize and explore your traces — no queries required
Keep deployments cost-efficient by leveraging object storage and a columnar trace storage format based on Apache Parquet
Complete big searches quickly via Cloud Traces’ massively parallel query engine, which can scan terabytes of traces per second
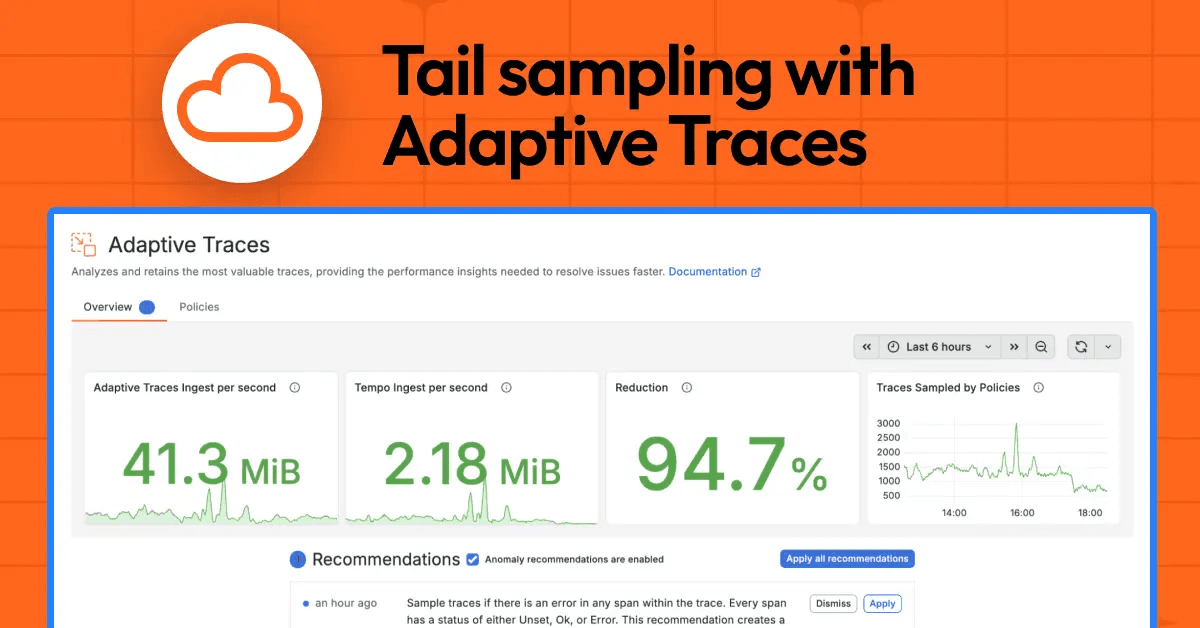
Store what matters most by automatically identifying and retaining your most valuable traces via Adaptive Traces

“Understanding where latency was increasing and finding areas where you can improve on that becomes more difficult once you have several services communicating with each other. And jumping from one tool to another while debugging makes things more complicated. Having it all in one tool like Grafana Cloud Traces simplifies the process.”
Roman VogmanDevOps Engineer, Houzz
No credit card required
Limited to 50 GB ingested per month
14 day retention
Community support
Automatic volume discounts. Pricing at scale. View calculator
50 GB ingested per month then pay as you go
30 days retention
8×5 email support
Scalable unit price based on annual commit
Custom retention
Premium support
Deployment flexibility (Public Cloud, Federal Cloud, or Bring Your Own Cloud)
OpenTelemetry-native observability and no lock-in, with out-of-the-box solutions like Kubernetes Monitoring, Application Observability, Grafana SLO, and RUM delivered in one unified experience.
Optimize costs without sacrificing insight with Adaptive Telemetry, which filters out unused data so your budget goes toward what actually drives value. Pair with cost management tools that help you monitor, control, and tune spend.
Grafana Assistant powers agentic workflows, prebuilt dashboards, intelligent filters, and customized alerts—surfacing the data you need for faster, more efficient incident response.


Welcome to
Built on open source, open standards, and open ecosystems