Apache Hadoop integration for Grafana Cloud
Apache Hadoop is an open-source framework designed to process and store large amounts of data across distributed clusters of computers. It provides a scalable and fault-tolerant solution for handling big data by utilizing a distributed file system (Hadoop Distributed File System) and a parallel processing model (MapReduce). This integration for Grafana Cloud allows users to monitor a Hadoop cluster with 4 separate dashboards for visualizing metrics and logs for a Hadoop NameNode, DataNode, NodeManager, and ResourceManager component.
This integration supports Apache Hadoop version 3.3.1+
Apache Hadoop 3.3 and upper supports Java 8 and Java 11 (runtime only)
This integration supports the JMX exporter 0.17.0+
This integration includes 8 useful alerts and 5 pre-built dashboards to help monitor and visualize Apache Hadoop metrics and logs.
Before you begin
In order for the integration to properly work, you must set up the JMX Exporter for Prometheus on each instance in your cluster.
Set up JMX Exporter
Each instance requires a JMX to Prometheus exporter. This is a collector that creates an HTTP server that serves mBean metrics of the local JVM target. Depending on the Apache Hadoop component being monitored - i.e., the NameNode, DataNode, NodeManager and/or ResourceManager - a slightly different configuration will be used. Typically, a DataNode and a NodeManager are grouped together, while the ResourceManager and NameNode are separate. However, each Hadoop deployment architecture may vary.
Expose JMX Remotely
To expose the JMX remotely, it needs to be enabled for the components being monitored. A configuration option enables JMX on the Hadoop daemons, which exists in a hadoop-env.sh file located in the /etc/hadoop/conf. Within the bash file, there is a HDFS_<COMPONENT>_OPTS value that will take an argument to enable JMX, specify the <JMX_PORT>, and manage security options. It should look similar to:
export HDFS_<COMPONENT>_OPTS="-Dcom.sun.management.jmxremote=true -Dcom.sun.management.jmxremote.authenticate=false -Dcom.sun.management.jmxremote.port=<JMX_PORT> -Dcom.sun.management.jmxremote.ssl=false"Then save the configuration file and restart the Hadoop daemons. For more details on setting up an Apache Hadoop cluster environment, refer to the official documentation.
Connect JMX to the Prometheus Exporter
In order to connect JMX to the Prometheus Exporter, a collector is configured in a config file for each component being monitored. This namenode.yaml, can be placed anywhere and named anything but must specify the exposed JMX_PORT for the component being monitored. It should look similar to:
hostPort: localhost:<JMX_PORT>
lowercaseOutputName: true
lowercaseOutputLabelNames: true
rules:
    - pattern: ".*"
Run the Prometheus Exporter
To run the JMX to Prometheus exporter, the Java Agent or a Standalone HTTP Server is used. These require two arguments: a
To run the JMX to Prometheus exporter as a Java Agent:
java -javaagent:./jmx_prometheus_javaagent-0.17.0.jar=<JMX_EXPORTER_PORT>:<COMPONENT>.yaml -jar yourJar.jarTo run the JMX to Prometheus exporter as a Standalone HTTP Server:
java -jar jmx_prometheus_httpserver-0.17.0.jar <JMX_EXPORTER_PORT> /path-to-jmx-configs/<COMPONENT>.yamlTo validate that the JMX Exporter is setup correctly, the Prometheus metrics should be available locally via curl:
curl http://localhost:<JMX_EXPORTER_PORT>/metricsInstall Apache Hadoop integration for Grafana Cloud
- In your Grafana Cloud stack, click Connections in the left-hand menu.
- Find Apache Hadoop and click its tile to open the integration.
- Review the prerequisites in the Configuration Details tab and set up Grafana Alloy to send Apache Hadoop metrics and logs to your Grafana Cloud instance.
- Click Install to add this integration’s pre-built dashboards and alerts to your Grafana Cloud instance, and you can start monitoring your Apache Hadoop setup.
Configuration snippets for Grafana Alloy
Advanced mode
The following snippets provide examples to guide you through the configuration process.
To instruct Grafana Alloy to scrape your Apache Hadoop instances, manually copy and append the snippets to your alloy configuration file, then follow subsequent instructions.
Advanced metrics snippets
prometheus.scrape "metrics_integrations_integrations_apache_hadoop" {
	targets = [{
		__address__    = "<your-host-name>:<jmx-exporter-port>",
		hadoop_cluster = "<your-cluster-name>",
		instance       = constants.hostname,
	}]
	forward_to = [prometheus.remote_write.metrics_service.receiver]
	job_name   = "integrations/apache-hadoop"
}
To monitor your Apache Hadoop instance, you must use a discovery.relabel component to discover your Apache Hadoop Prometheus endpoint and apply appropriate labels, followed by a prometheus.scrape component to scrape it.
Configure the following properties within each discovery.relabel component:
__address__: The address to your Apache Hadoop Prometheus metrics endpoint.instancelabel:constants.hostnamesets theinstancelabel to your Grafana Alloy server hostname. If that is not suitable, change it to a value uniquely identifies this Apache Hadoop instance. Make sure this label value is the same for all telemetry data collected for this instance.hadoop_clustermust be the value that identifies the Apache Hadoop cluster this node belongs to.
If you have multiple Apache Hadoop servers to scrape, configure one discovery.relabel for each and scrape them by including each under targets within the prometheus.scrape component.
Advanced logs snippets
linux
local.file_match "logs_integrations_integrations_apache_hadoop" {
	path_targets = [{
		__address__    = "localhost",
		__path__       = "<your-log-path>",
		hadoop_cluster = "<your-cluster-name>",
		instance       = constants.hostname,
		job            = "integrations/apache-hadoop",
	}]
}

loki.source.file "logs_integrations_integrations_apache_hadoop" {
	targets    = local.file_match.logs_integrations_integrations_apache_hadoop.targets
	forward_to = [loki.write.grafana_cloud_loki.receiver]
}
To monitor your Apache Hadoop instance logs, you will use a combination of the following components:
local.file_match defines where to find the log file to be scraped. Change the following properties according to your environment:
__address__: The Apache Hadoop instance address__path__: this is the component log location, which by default is indicated in theHADOOP_LOG_DIRentry within/etc/hadoop/confconfig gile. An example log path may look like/hadoop/logs/*.logon Linux.instancelabel:constants.hostnamesets theinstancelabel to your Grafana Alloy server hostname. If that is not suitable, change it to a value uniquely identifies this Apache Hadoop instance. Make sure this label value is the same for all telemetry data collected for this instance.hadoop_clustermust be the value that identifies the Apache Hadoop cluster this node belongs to.
loki.source.file sends logs to Loki.
On Linux, you will also need to add the alloy user to the hadoop group to get logs. Run the following command to configure the user as required:
sudo usermod -a -G hadoop alloyKubernetes instructions
Before you begin with Kubernetes
Please note: These instructions assume the use of the Kubernetes Monitoring Helm chart
In order for the integration to properly work, you must set up the JMX Exporter for Prometheus on each instance in your cluster.
Set up JMX Exporter
Each instance requires a JMX to Prometheus exporter. This is a collector that creates an HTTP server that serves mBean metrics of the local JVM target. Depending on the Apache Hadoop component being monitored - i.e., the NameNode, DataNode, NodeManager and/or ResourceManager - a slightly different configuration will be used. Typically, a DataNode and a NodeManager are grouped together, while the ResourceManager and NameNode are separate. However, each Hadoop deployment architecture may vary.
Expose JMX Remotely
To expose the JMX remotely, it needs to be enabled for the components being monitored. A configuration option enables JMX on the Hadoop daemons, which exists in a hadoop-env.sh file located in the /etc/hadoop/conf. Within the bash file, there is a HDFS_<COMPONENT>_OPTS value that will take an argument to enable JMX, specify the <JMX_PORT>, and manage security options. It should look similar to:
export HDFS_<COMPONENT>_OPTS="-Dcom.sun.management.jmxremote=true -Dcom.sun.management.jmxremote.authenticate=false -Dcom.sun.management.jmxremote.port=<JMX_PORT> -Dcom.sun.management.jmxremote.ssl=false"Then save the configuration file and restart the Hadoop daemons. For more details on setting up an Apache Hadoop cluster environment, refer to the official documentation.
Connect JMX to the Prometheus Exporter
In order to connect JMX to the Prometheus Exporter, a collector is configured in a config file for each component being monitored. This namenode.yaml, can be placed anywhere and named anything but must specify the exposed JMX_PORT for the component being monitored. It should look similar to:
hostPort: localhost:<JMX_PORT>
lowercaseOutputName: true
lowercaseOutputLabelNames: true
rules:
    - pattern: ".*"
Run the Prometheus Exporter
To run the JMX to Prometheus exporter, the Java Agent or a Standalone HTTP Server is used. These require two arguments: a
To run the JMX to Prometheus exporter as a Java Agent:
java -javaagent:./jmx_prometheus_javaagent-0.17.0.jar=<JMX_EXPORTER_PORT>:<COMPONENT>.yaml -jar yourJar.jarTo run the JMX to Prometheus exporter as a Standalone HTTP Server:
java -jar jmx_prometheus_httpserver-0.17.0.jar <JMX_EXPORTER_PORT> /path-to-jmx-configs/<COMPONENT>.yamlTo validate that the JMX Exporter is setup correctly, the Prometheus metrics should be available locally via curl:
curl http://localhost:<JMX_EXPORTER_PORT>/metricsConfiguration snippets for Kubernetes Helm chart
The following snippets provide examples to guide you through the configuration process.
To scrape your Apache Hadoop instances, manually modify your Kubernetes Monitoring Helm chart with these configuration snippets.
Replace any values between the angle brackets <> in the provided snippets with your desired configuration values.
Metrics snippets
alloy-metrics:
    extraConfig: |-
        discovery.kubernetes "hadoop_datanode_service_jmx" {
            role = "service"
            selectors {
                role = "service"
                field = "metadata.name=<hadoop-datanode-service-name>"
            }
            namespaces = ["<hadoop-datanode-service-namespace>"]
        }

        discovery.relabel "hadoop_datanode_service_jmx" {
            targets = discovery.kubernetes.services.targets

            rule {
                source_labels = ["__meta_kubernetes_service_port_name"]
                regex         = "<hadoop-datanode-service-exporter-port-name>"
                action        = "keep"
            }
        }

        discovery.kubernetes "hadoop_namenode_service_jmx" {
            role = "service"
            selectors {
                role = "service"
                field = "metadata.name=<hadoop-namenode-service-name>"
            }
            namespaces = ["<hadoop-namenode-service-namespace>"]
        }

        discovery.relabel "hadoop_namenode_service_jmx" {
            targets = discovery.kubernetes.hadoop_namenode_service_jmx.targets

            rule {
                source_labels = ["__meta_kubernetes_service_port_name"]
                regex         = "<hadoop-namenode-service-exporter-port-name>"
                action        = "keep"
            }
        }

        discovery.kubernetes "hadoop_nodemanager_service_jmx" {
            role = "service"
            selectors {
                role = "service"
                field = "metadata.name=<hadoop-nodemanager-service-name>"
            }
            namespaces = ["<hadoop-nodemanager-service-namespace>"]
        }

        discovery.relabel "hadoop_nodemanager_service_jmx" {
            targets = discovery.kubernetes.hadoop_nodemanager_service_jmx.targets

            rule {
                source_labels = ["__meta_kubernetes_service_port_name"]
                regex         = "<hadoop-nodemanager-service-exporter-port-name>"
                action        = "keep"
            }
        }

        discovery.kubernetes "hadoop_resourcemanager_service_jmx" {
            role = "service"
            selectors {
                role = "service"
                field = "metadata.name=<hadoop-resourcemanager-service-name>"
            }
            namespaces = ["<hadoop-resourcemanager-service-namespace>"]
        }

        discovery.relabel "hadoop_resourcemanager_service_jmx" {
            targets = discovery.kubernetes.hadoop_resourcemanager_service_jmx.targets

            rule {
                source_labels = ["__meta_kubernetes_service_port_name"]
                regex         = "<hadoop-resourcemanager-service-exporter-port-name>"
                action        = "keep"
            }
        }

        discovery.relabel "hadoop_all_services_jmx" {
            targets = array.concat(
                discovery.relabel.hadoop_datanode_service_jmx.output,
                discovery.relabel.hadoop_namenode_service_jmx.output,
                discovery.relabel.hadoop_nodemanager_service_jmx.output,
                discovery.relabel.hadoop_resourcemanager_service_jmx.output,
            )
            rule {
                target_label  = "hadoop_cluster"
                replacement   = "<your-hadoop-cluster-name>"
            }
        }

        prometheus.scrape "integrations_hadoop_prometheus_exporter" {
            targets        = discovery.relabel.hadoop_all_services_jmx.output
            job_name       = "integrations/apache-hadoop"
            forward_to     = [prometheus.remote_write.grafana_cloud_metrics.receiver]
        }
Logs snippets
podLogs:
    extraDiscoveryRules: |-
        rule {
            source_labels = ["__meta_kubernetes_namespace", "__meta_kubernetes_pod_name", "__meta_kubernetes_pod_container_name"]
            separator     = ":"
            regex         = "(<hadoop-namespace>:<hadoop-datanode-pod-name>:<hadoop-datanode-container-name>)"
            target_label  = "integration"
            replacement   = "hadoop"
        }

        rule {
            source_labels = ["__meta_kubernetes_namespace", "__meta_kubernetes_pod_name", "__meta_kubernetes_pod_container_name"]
            separator     = ":"
            regex         = "(<hadoop-namespace>:<hadoop-datanode-pod-name>:<hadoop-namenode-container-name>)"
            target_label  = "integration"
            replacement   = "hadoop"
        }

        rule {
            source_labels = ["__meta_kubernetes_namespace", "__meta_kubernetes_pod_name", "__meta_kubernetes_pod_container_name"]
            separator     = ":"
            regex         = "(<hadoop-namespace>:<hadoop-datanode-pod-name>:<hadoop-nodemanager-container-name>)"
            target_label  = "integration"
            replacement   = "hadoop"
        }

        rule {
            source_labels = ["__meta_kubernetes_namespace", "__meta_kubernetes_pod_name", "__meta_kubernetes_pod_container_name"]
            separator     = ":"
            regex         = "(<hadoop-namespace>:<hadoop-datanode-pod-name>:<hadoop-resourcemanager-container-name>)"
            target_label  = "integration"
            replacement   = "hadoop"
        }

        rule {
            source_labels = ["integration","__address__"]
            regex         = "hadoop-(datanode|namenode|nodemanager|resourcemanager):(.+)"
            replacement   = "$2"
            target_label  = "instance"
        }
        rule {
            source_labels = ["integration"]
            regex         = "hadoop-(datanode|namenode|nodemanager|resourcemanager)"
            target_label  = "log_type"
        }

    extraLogProcessingStages: |-
        stage.match {
            selector = "{integration=\\"hadoop\\"}"

            stage.static_labels {
                values = {
                    hadoop_cluster = "<your-hadoop-cluster-name>",
                    job            = "integrations/apache-hadoop",
                }
            }

            stage.labels {
                values = {
                    instance = null,
                    log_type = null,
                }
            }
        }
Dashboards
The Apache Hadoop integration installs the following dashboards in your Grafana Cloud instance to help monitor your system.
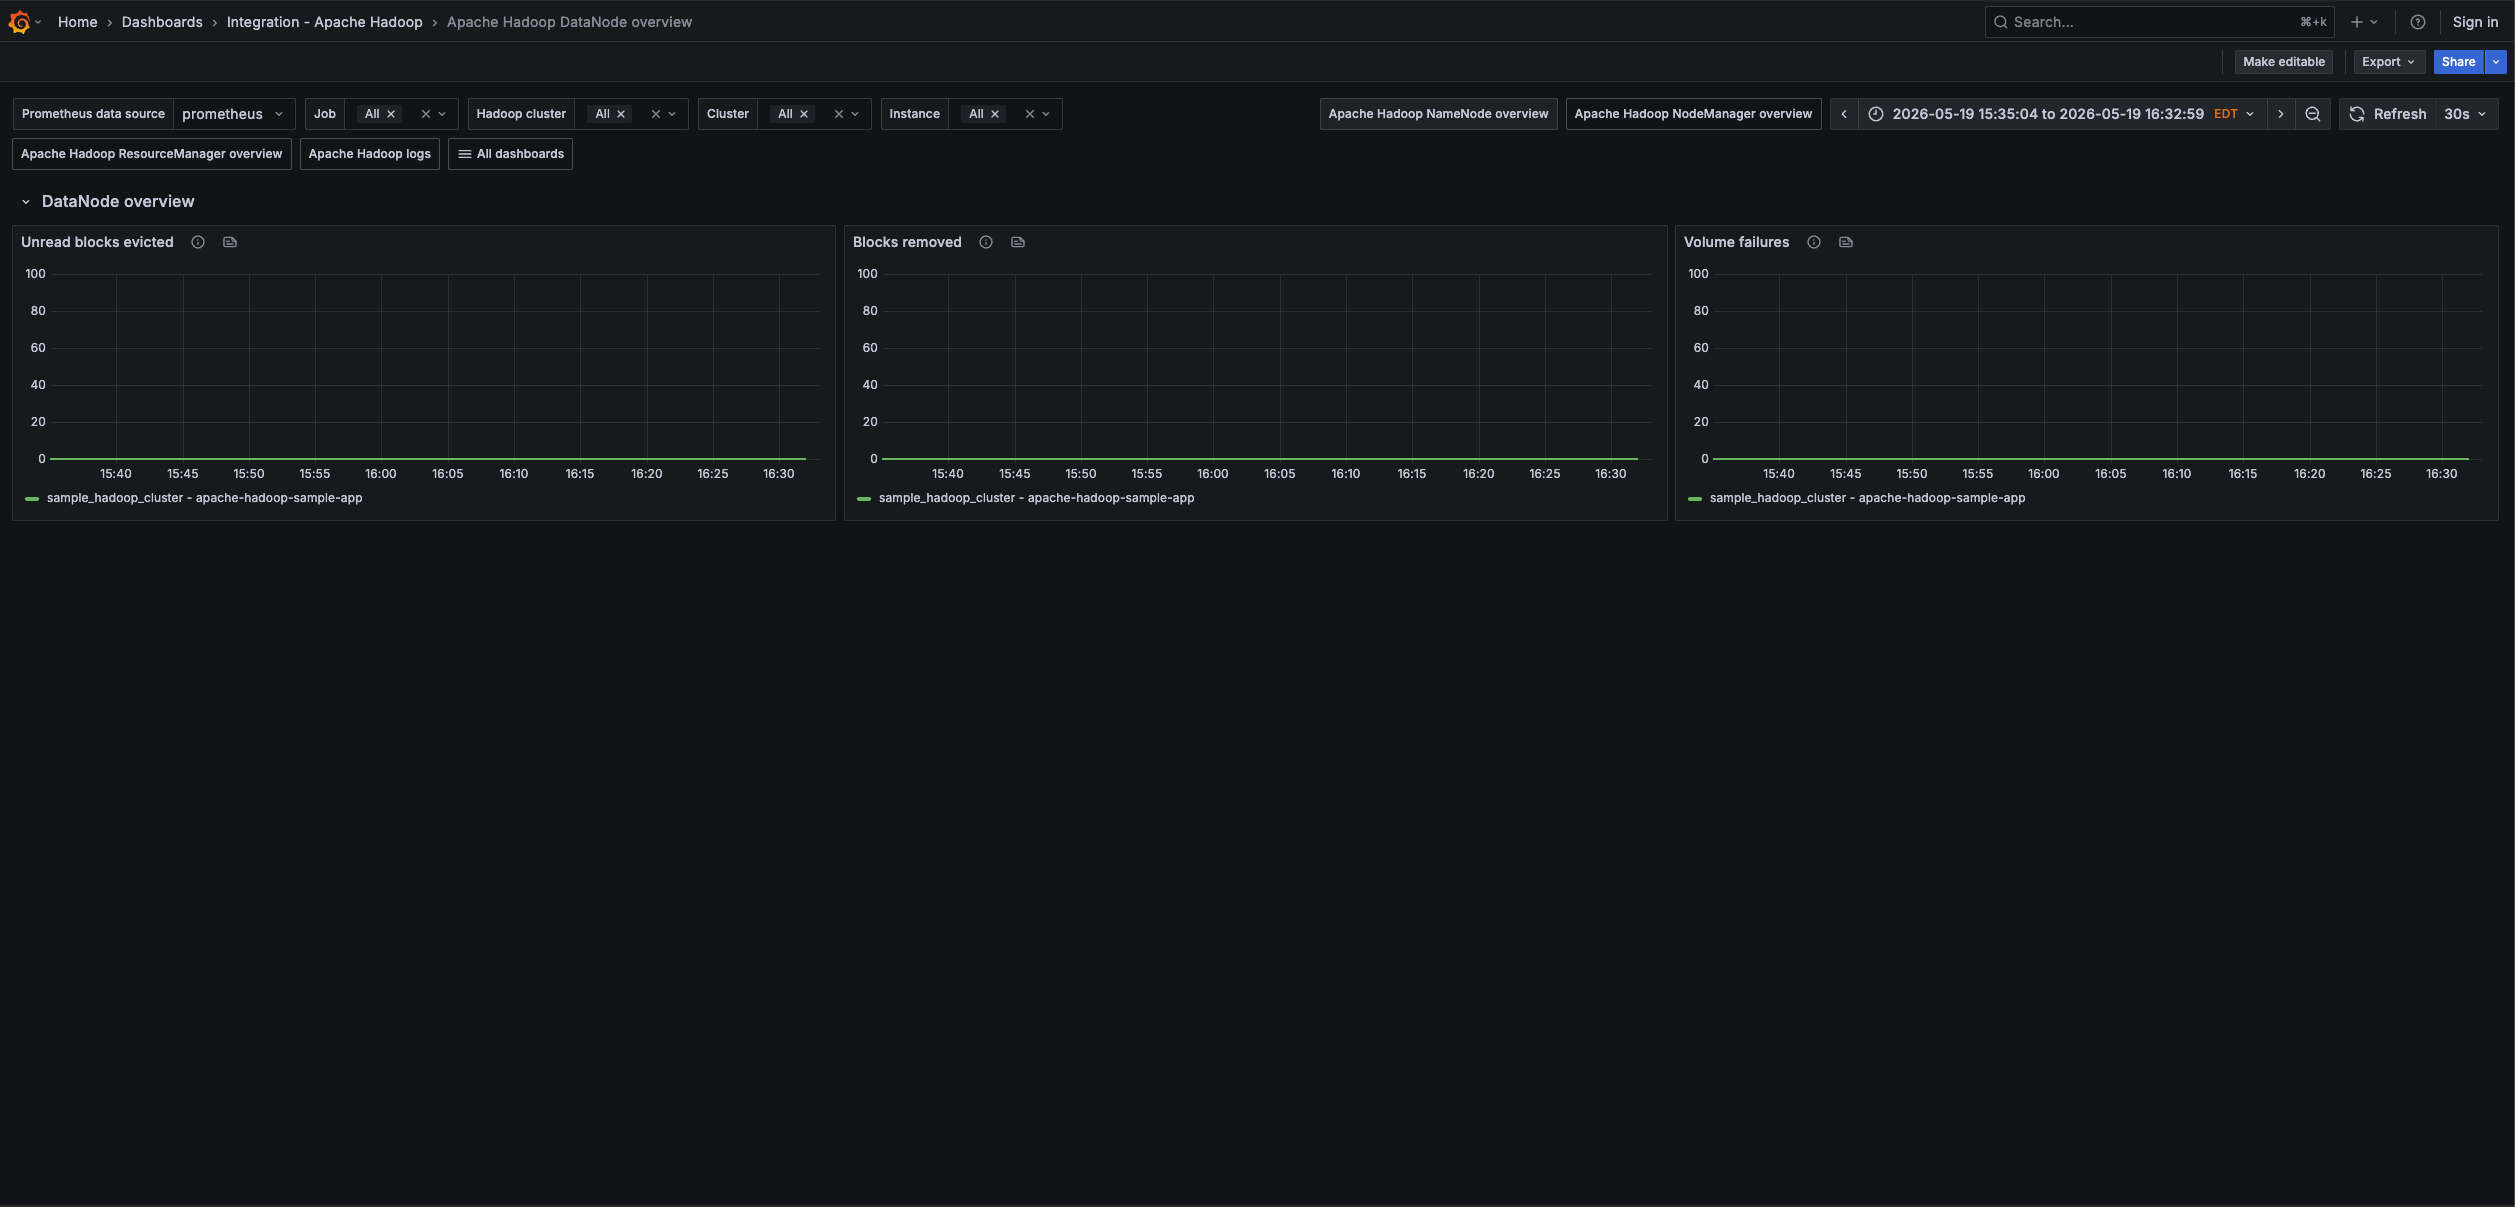
- Apache Hadoop DataNode overview
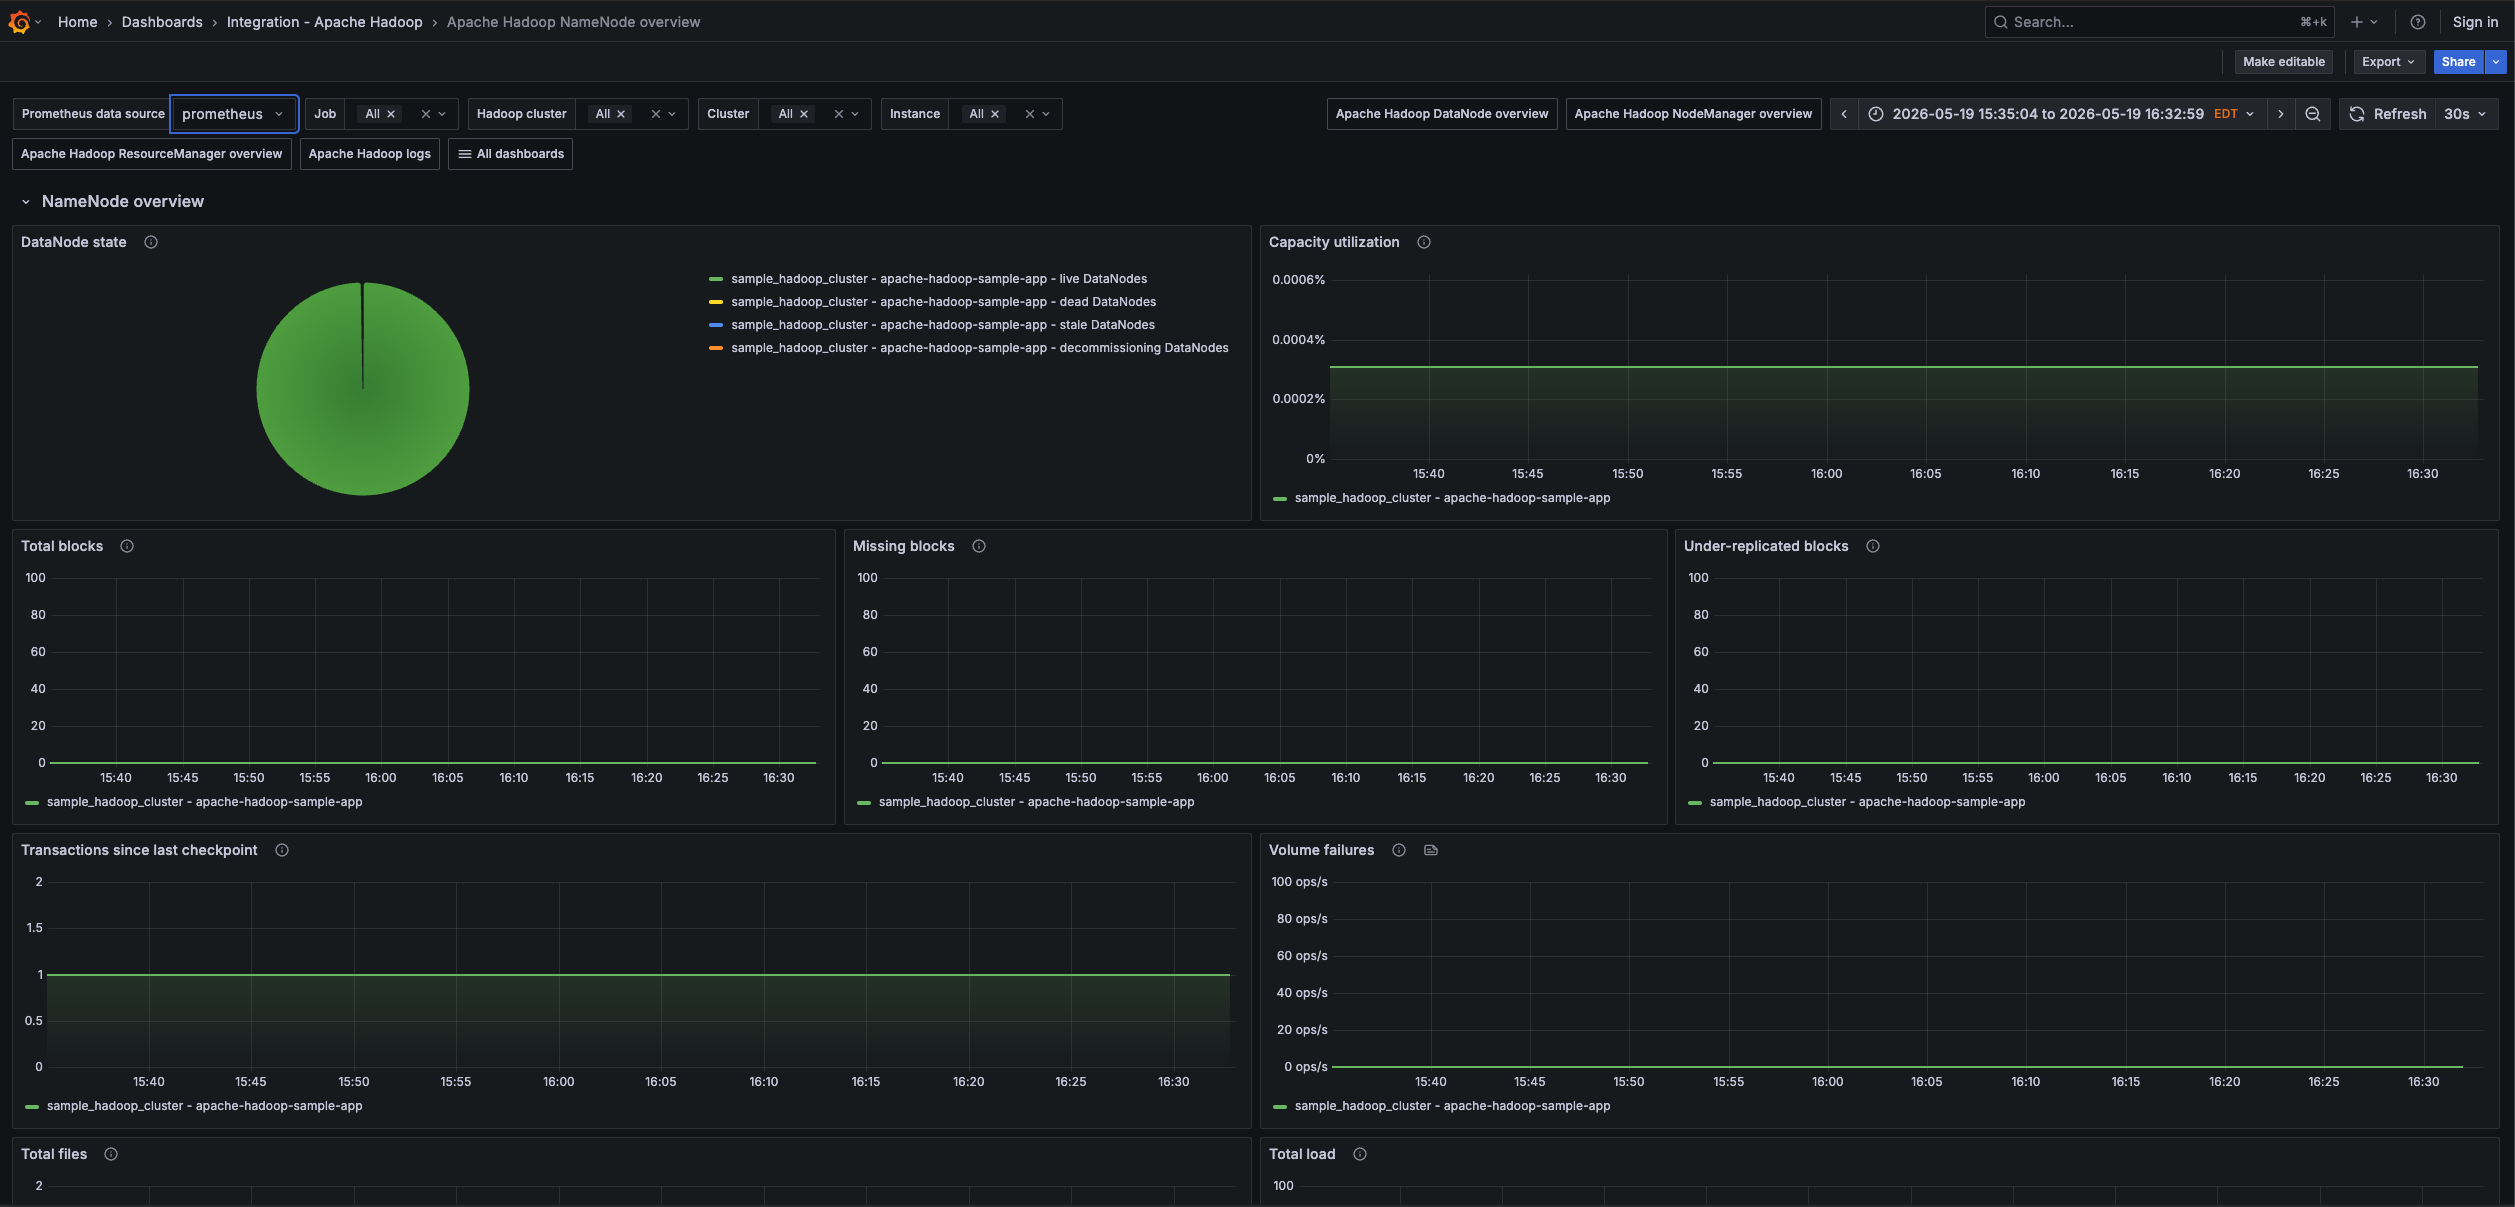
- Apache Hadoop NameNode overview
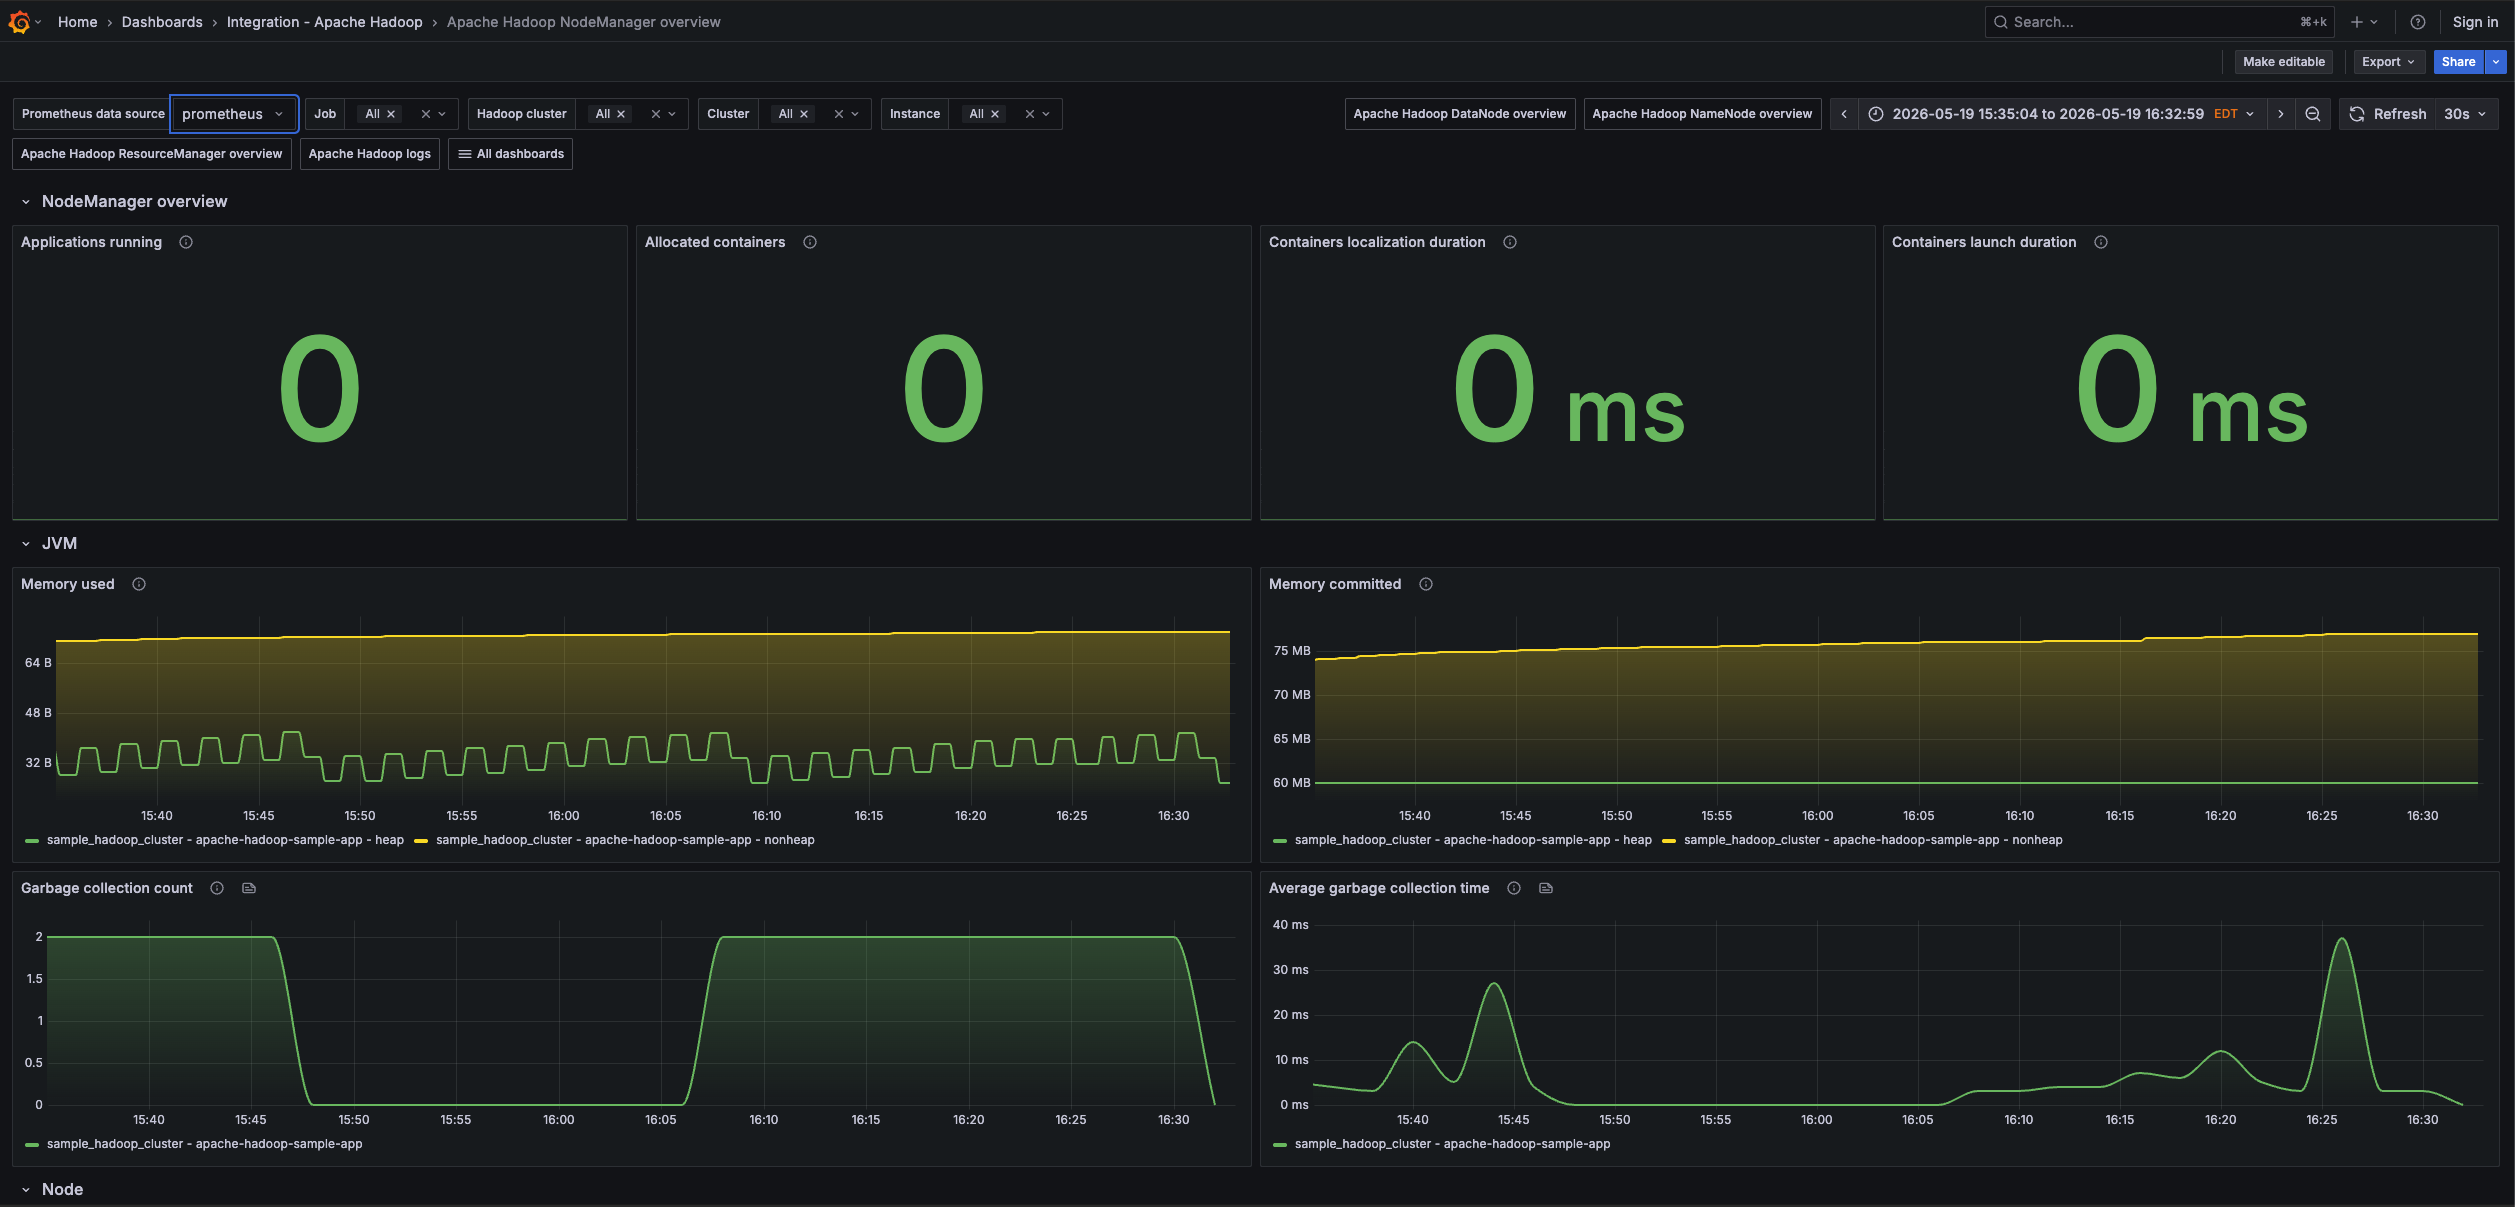
- Apache Hadoop NodeManager overview
- Apache Hadoop ResourceManager overview
- Apache Hadoop logs
Apache Hadoop NameNode overview (1/2)
Apache Hadoop DataNode overview (1/1)
Apache Hadoop NodeManger overview (1/2)
Alerts
The Apache Hadoop integration includes the following useful alerts:
Metrics
The most important metrics provided by the Apache Hadoop integration, which are used on the pre-built dashboards and Prometheus alerts, are as follows:
- hadoop_datanode_blocksremoved
- hadoop_datanode_ramdiskblocksevictedwithoutread
- hadoop_datanode_volumefailures
- hadoop_namenode_blockstotal
- hadoop_namenode_capacityremaining
- hadoop_namenode_capacitytotal
- hadoop_namenode_capacityused
- hadoop_namenode_filestotal
- hadoop_namenode_missingblocks
- hadoop_namenode_numdeaddatanodes
- hadoop_namenode_numdecommissioningdatanodes
- hadoop_namenode_numlivedatanodes
- hadoop_namenode_numstaledatanodes
- hadoop_namenode_totalload
- hadoop_namenode_transactionssincelastcheckpoint
- hadoop_namenode_underreplicatedblocks
- hadoop_namenode_volumefailurestotal
- hadoop_nodemanager_allocatedcontainers
- hadoop_nodemanager_allocatedgb
- hadoop_nodemanager_allocatedvcores
- hadoop_nodemanager_applicationsrunning
- hadoop_nodemanager_availablegb
- hadoop_nodemanager_availablevcores
- hadoop_nodemanager_containerlaunchdurationavgtime
- hadoop_nodemanager_containerscompleted
- hadoop_nodemanager_containersfailed
- hadoop_nodemanager_containersiniting
- hadoop_nodemanager_containerskilled
- hadoop_nodemanager_containerslaunched
- hadoop_nodemanager_containerspaused
- hadoop_nodemanager_containersreiniting
- hadoop_nodemanager_containerusedmemgb
- hadoop_nodemanager_containerusedvmemgb
- hadoop_nodemanager_gccount
- hadoop_nodemanager_gctimemillis
- hadoop_nodemanager_localizationdurationmillisavgtime
- hadoop_nodemanager_memheapcommittedm
- hadoop_nodemanager_memheapusedm
- hadoop_nodemanager_memnonheapcommittedm
- hadoop_nodemanager_memnonheapusedm
- hadoop_nodemanager_nodecpuutilization
- hadoop_nodemanager_nodegpuutilization
- hadoop_resourcemanager_allocatedmb
- hadoop_resourcemanager_allocatedvcores
- hadoop_resourcemanager_appscompleted
- hadoop_resourcemanager_appsfailed
- hadoop_resourcemanager_appskilled
- hadoop_resourcemanager_appspending
- hadoop_resourcemanager_appsrunning
- hadoop_resourcemanager_appssubmitted
- hadoop_resourcemanager_availablemb
- hadoop_resourcemanager_availablevcores
- hadoop_resourcemanager_gccount
- hadoop_resourcemanager_gctimemillis
- hadoop_resourcemanager_memheapcommittedm
- hadoop_resourcemanager_memheapusedm
- hadoop_resourcemanager_memnonheapcommittedm
- hadoop_resourcemanager_memnonheapusedm
- hadoop_resourcemanager_numactivenms
- hadoop_resourcemanager_numdecommissionednms
- hadoop_resourcemanager_numlostnms
- hadoop_resourcemanager_numrebootednms
- hadoop_resourcemanager_numshutdownnms
- hadoop_resourcemanager_numunhealthynms
- up
Changelog
# 1.1.1 - June 2026

* Fixed issue with default filtering selectors

# 1.1.0 - June 2026

* Updated dashboards to follow new stylistic standards
* Renamed alert `ApacheHadoopLowHDFSCapacity (Warning)` to `HadoopLowHDFSCapacity (Warning)`
* Renamed alert `ApacheHadoopHDFSMissingBlocks (Critical)` to `HadoopHDFSMissingBlocks (Critical)`
* Renamed alert `ApacheHadoopHDFSHighVolumeFailures (Critical)` to `HadoopHDFSHighVolumeFailures (Critical)`
* Renamed alert `ApacheHadoopHighDeadDataNodes (Critical)` to `HadoopHighDeadDataNodes (Critical)`
* Renamed alert `ApacheHadoopHighNodeManagerCPUUsage (Critical)` to `HadoopHighNodeManagerCPUUsage (Critical)`
* Renamed alert `ApacheHadoopHighNodeManagerMemoryUsage (Critical)` to `HadoopHighNodeManagerMemoryUsage (Critical)`
* Renamed alert `ApacheHadoopHighResourceManagerVirtualCoreCPUUsage (Critical)` to `HadoopHighResourceManagervCoreCPUUsage (Critical)`
* Renamed alert `ApacheHadoopHighResourceManagerMemoryUsage (Critical)` to `HadoopHighResourceManagerMemoryUsage (Critical)`
* Added a dedicated logs dashboard `Apache Hadoop logs`

# 1.0.0 - August 2024

* Add Kubernetes as a supported platform using Grafana Alloy

# 0.0.3 - September 2023

* New Filter Metrics option for configuring the Grafana Agent, which saves on metrics cost by dropping any metric not used by this integration. Beware that anything custom built using metrics that are not on the snippet will stop working.
* New hostname relabel option, which applies the instance name you write on the text box to the Grafana Agent configuration snippets, making it easier and less error prone to configure this mandatory label.

# 0.0.2 - August 2023

* Add regex filter for logs datasource

# 0.0.1 - July 2023

* Initial release
Cost
By connecting your Apache Hadoop instance to Grafana Cloud, you might incur charges. To view information on the number of active series that your Grafana Cloud account uses for metrics included in each Cloud tier, see Active series and dpm usage and Cloud tier pricing.


