Configure Redis exporter to generate Prometheus metrics
Use redis exporter to enable Prometheus metrics for Redis. To confirm you configured the exporter correctly, ensure the following metrics are available in Prometheus.
- redis_up
- redis_uptime_in_seconds
Request, error, and latency metrics
| Metric | KPI |
|---|---|
Request Counter
| Request Rate
|
Error Counter
| Error Ratio
|
Latency Counter
| Latency Average
|
Resource metrics
| Metric | KPI |
|---|---|
CPU Usage
| rate(redis_cpu_user_seconds_total[5m]) + rate(redis_cpu_sys_seconds_total[5m]) |
Memory Usage
| redis_memory_used_rss_bytes / redis_memory_max_bytes |
Network Bytes Received
Network Bytes Transmitted
| Data transfer rate
|
Current Redis Connected clients
| redis_connected_clients / redis_config_maxclients |
Alerts
| KPI | Alert |
|---|---|
| Request Rate | RequestRateAnomaly |
| Error Ratio | ErrorRatioBreach and ErrorBuildup based on an availability SLO of 99.9 |
| Latency Average | LatencyAverageBreach and LatencyAverageAnomaly |
| CPU Usage | Saturation with severity level of warning and critical when CPU utilization exceeds 70% and 90%, respectively |
| Memory Usage | Saturation with severity level of warning and critical when memory utilization exceeds 65% and 75%, respectively |
| Network Bytes | ResourceRateAnomaly |
| Client Connections | Saturation with severity level of ResourceMayExhaust if connections are about to exceed the limit of 256 connections within the next 4 hours |
Failure alerts
RedisDown: Redis instance is down
1redis_up != 1
RedisUptimeReset: Redis instance restarted
1delta(redis_uptime_in_seconds[5m]) < 0
RedisMasterLinkDown: Redis master link down
1( 2 avg_over_time(redis_master_link_up[10m]) 3 and on (instance) 4 redis_instance_info{role=“slave”} 5) == 0
RedisReplicationBroken: Redis instance lost a replica
1delta(redis_connected_slaves[1m]) < 0
RedisClusterFlapping: Changes have been detected in Redis replica connection
1changes(redis_connected_slaves[5m]) > 2
RedisRejectedConnections: Some connections to Redis have been rejected
1rate(redis_rejected_connections_total[1m]) * 60 > 0
RedisMissingMaster: Redis Master Missing
1count by (job, service, redis_mode, namespace,) 2 (redis_instance_info{role=“master”}) == 0
RedisTooManyMasters: Standalone and HA setup should only have one master
1count by (job, service, namespace) 2 (redis_instance_info{role=“master”, redis_mode=“standalone”}) > 1
RedisTooFewMastersInCluster: Redis cluster mode should have every instance in the role of “master”
1avg by (job, service, namespace) (redis_cluster_size) 2- 3count by (job, service, namespace) 4 (redis_instance_info{role=“master”, redis_mode=“cluster”}) 5> 0
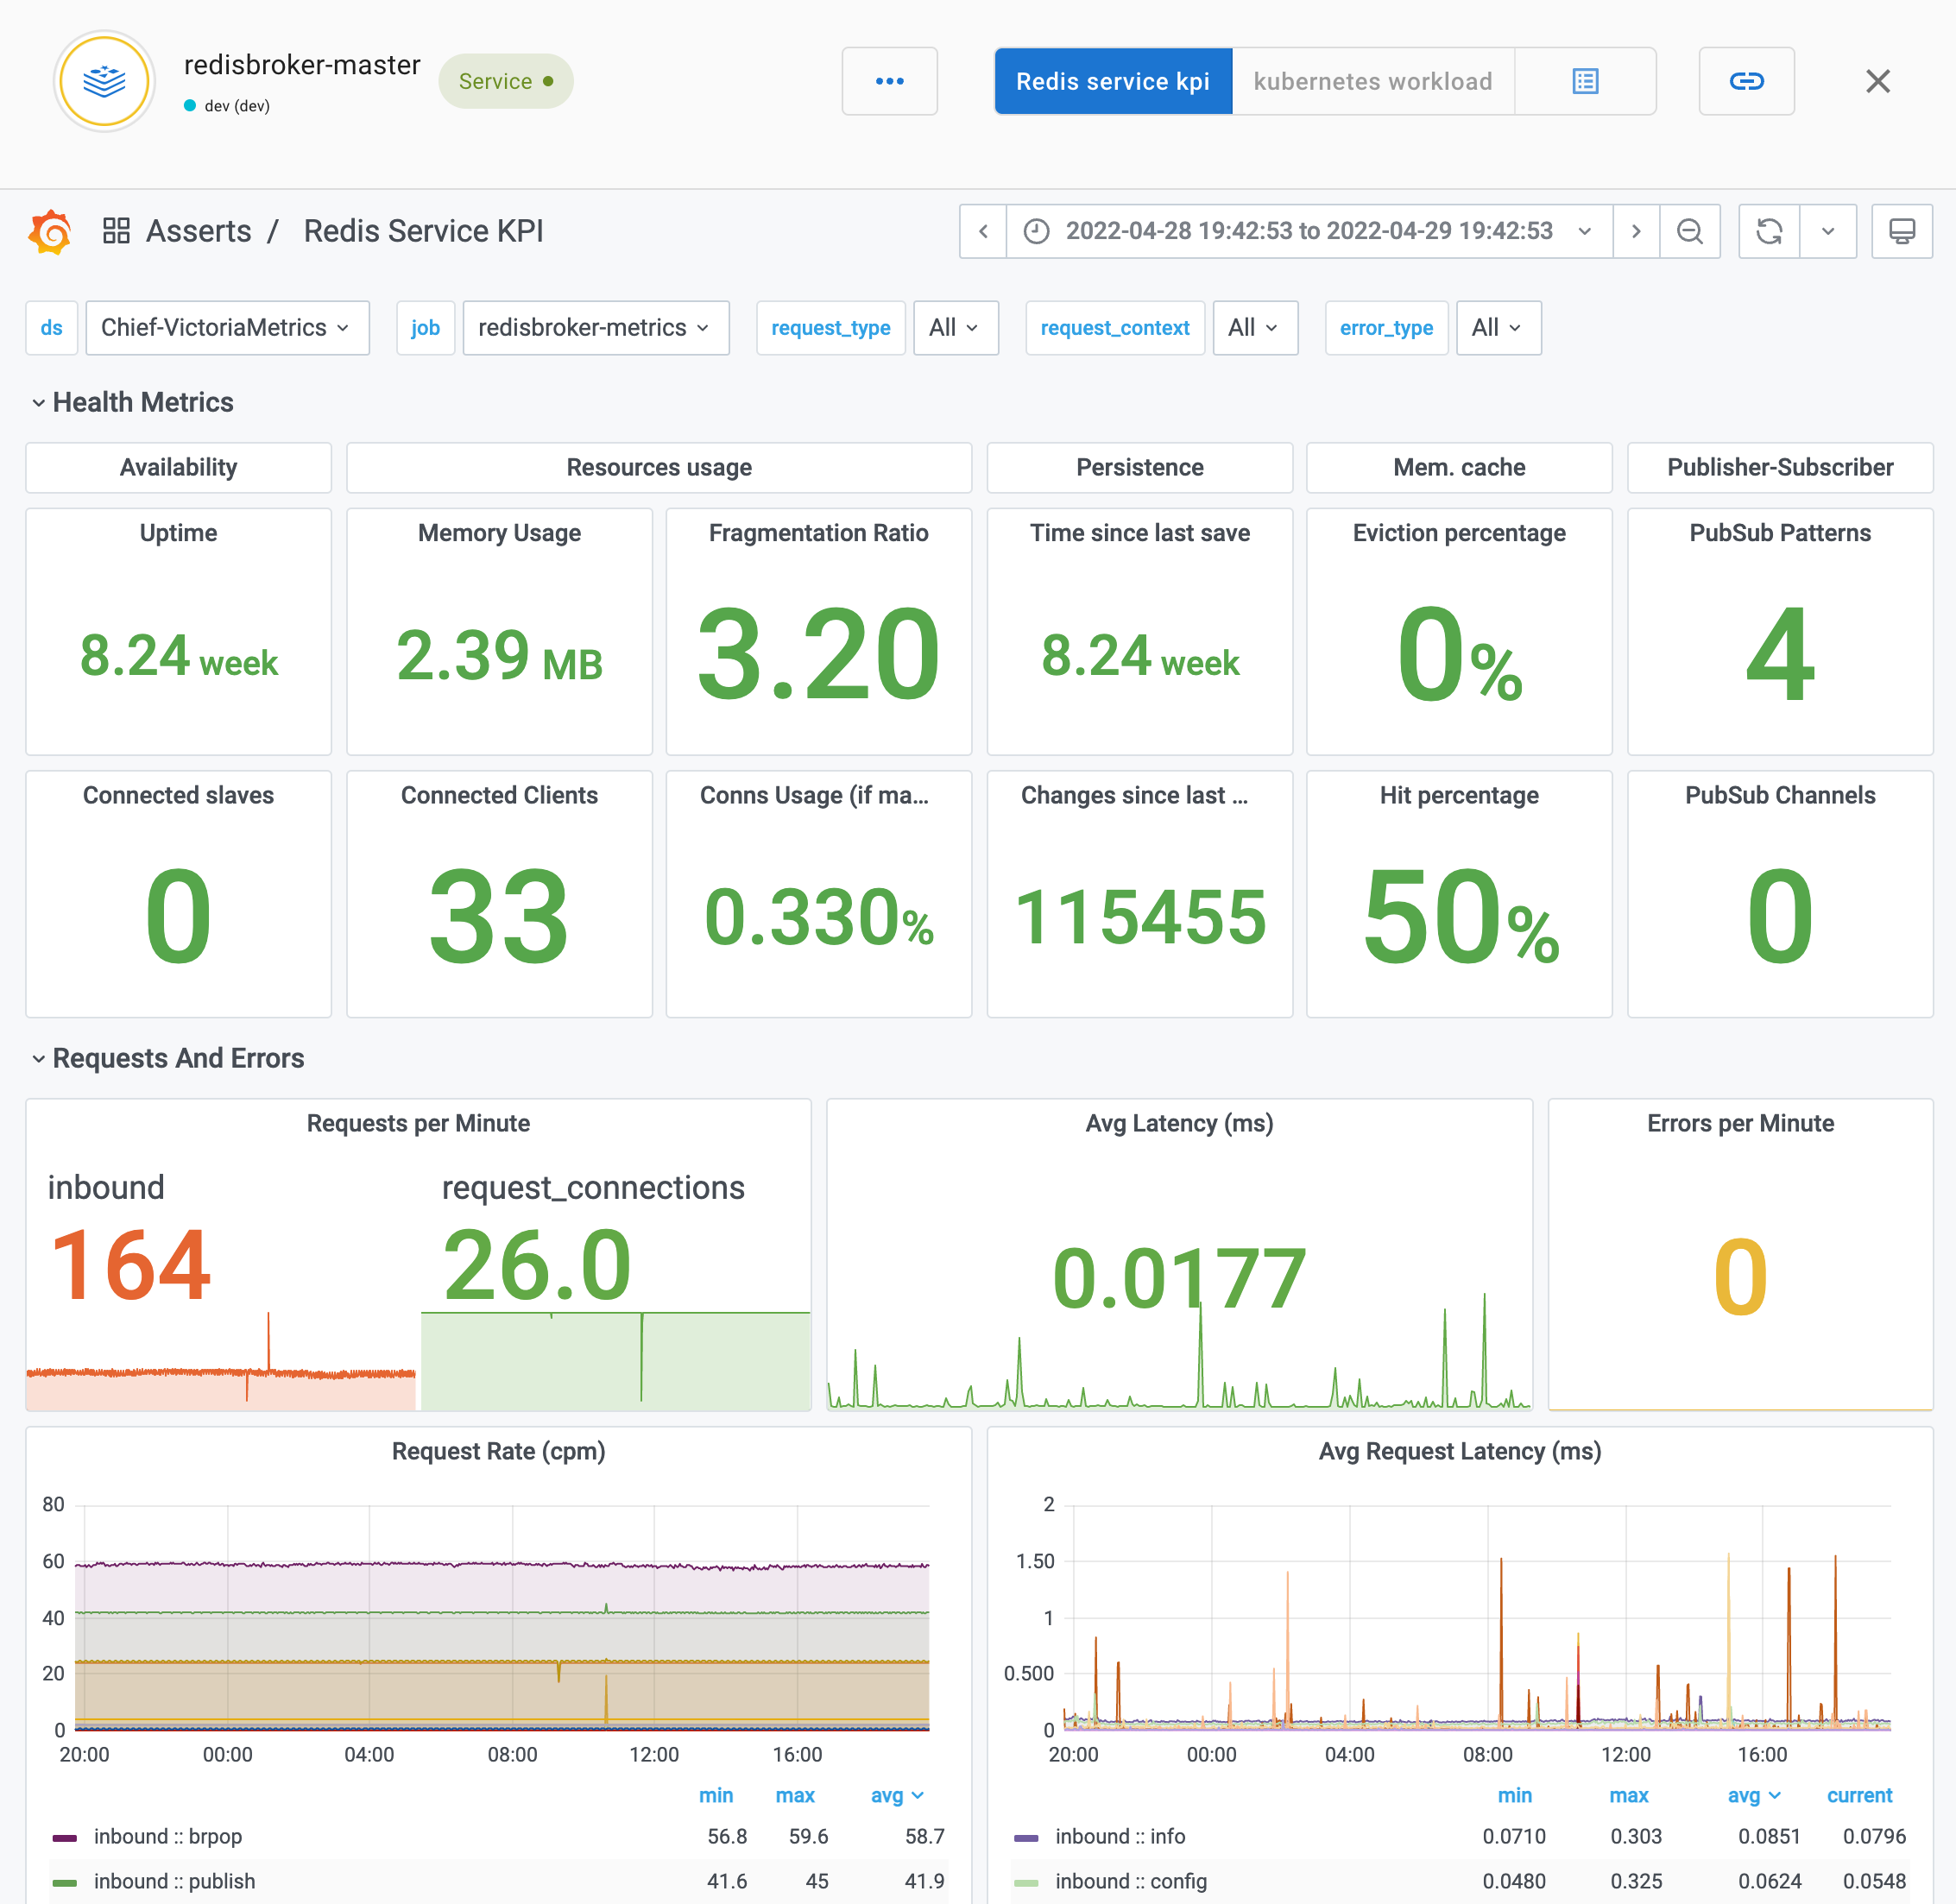
KPI dashboard
The following dashboard shows Redis KPIs.


