Squid integration for Grafana Cloud
Squid is a popular open-source proxy server that is used to improve web performance and provide content caching for web clients. The Squid integration uses Grafana Alloy to collect metrics for monitoring a Squid instance, including aspects such as cache hits & miss service time, cache hit ratios, client and server requests, server object swaps, and DNS lookup service time. The integration also supports Squid logs being scraped by Alloy using Promtail. An accompanying dashboard is provided to visualize these metrics and logs.
This integration supports Squid 5+.
This integration includes 5 useful alerts and 2 pre-built dashboards to help monitor and visualize Squid metrics and logs.
Before you begin
This integration monitors a Squid proxy server instance.
In order to scrape these metrics, you must have a running and reachable Squid instance.
Install Squid integration for Grafana Cloud
- In your Grafana Cloud stack, click Connections in the left-hand menu.
- Find Squid and click its tile to open the integration.
- Review the prerequisites in the Configuration Details tab and set up Grafana Alloy to send Squid metrics and logs to your Grafana Cloud instance.
- Click Install to add this integration’s pre-built dashboards and alerts to your Grafana Cloud instance, and you can start monitoring your Squid setup.
Configuration snippets for Grafana Alloy
Simple mode
These snippets are configured to scrape a single Squid instance running locally with default ports.
First, manually copy and append the following snippets into your alloy configuration file.
Logs snippets
darwin
local.file_match "logs_integrations_integrations_squid" {
	path_targets = [{
		__address__ = "localhost",
		__path__    = "/var/log/squid/cache.log",
		instance    = constants.hostname,
		job         = "integrations/squid",
	}, {
		__address__ = "localhost",
		__path__    = "/var/log/squid/access.log",
		instance    = constants.hostname,
		job         = "integrations/squid",
	}]
}

loki.source.file "logs_integrations_integrations_squid" {
	targets    = local.file_match.logs_integrations_integrations_squid.targets
	forward_to = [loki.write.grafana_cloud_loki.receiver]
}
linux
local.file_match "logs_integrations_integrations_squid" {
	path_targets = [{
		__address__ = "localhost",
		__path__    = "/var/log/squid/cache.log",
		instance    = constants.hostname,
		job         = "integrations/squid",
	}, {
		__address__ = "localhost",
		__path__    = "/var/log/squid/access.log",
		instance    = constants.hostname,
		job         = "integrations/squid",
	}]
}

loki.source.file "logs_integrations_integrations_squid" {
	targets    = local.file_match.logs_integrations_integrations_squid.targets
	forward_to = [loki.write.grafana_cloud_loki.receiver]
}
windows
local.file_match "logs_integrations_integrations_squid" {
	path_targets = [{
		__address__ = "localhost",
		__path__    = "/var/log/squid/cache.log",
		instance    = constants.hostname,
		job         = "integrations/squid",
	}, {
		__address__ = "localhost",
		__path__    = "/var/log/squid/access.log",
		instance    = constants.hostname,
		job         = "integrations/squid",
	}]
}

loki.source.file "logs_integrations_integrations_squid" {
	targets    = local.file_match.logs_integrations_integrations_squid.targets
	forward_to = [loki.write.grafana_cloud_loki.receiver]
}
Advanced mode
The following snippets provide examples to guide you through the configuration process.
To instruct Grafana Alloy to scrape your Squid instances, manually copy and append the snippets to your alloy configuration file, then follow subsequent instructions.
Advanced integrations snippets
prometheus.exporter.squid "integrations_squid" {
	address = "<squid_hostname>:<squid_port>"
}

discovery.relabel "integrations_squid" {
	targets = prometheus.exporter.squid.integrations_squid.targets

	rule {
		target_label = "instance"
		replacement  = constants.hostname
	}
}

prometheus.scrape "integrations_squid" {
	targets    = discovery.relabel.integrations_squid.output
	forward_to = [prometheus.remote_write.metrics_service.receiver]
	job_name   = "integrations/squid"
}
This integrations uses the prometheus.exporter.squid component to generate metrics from a Squid instance.
For the full array of configuration options, refer to the prometheus.exporter.squid component reference documentation.
This exporter must be linked with a discovery.relabel component to apply the necessary relabelings.
For each Squid instance to be monitored you must create a pair of these components.
Configure the following properties within each discovery.relabel component:
instancelabel:constants.hostnamesets theinstancelabel to your Grafana Alloy server hostname. If that is not suitable, change it to a value uniquely identifies this Squid instance. Make sure this label value is the same for all telemetry data collected for this instance.
You can then scrape them by including each discovery.relabel under targets within the prometheus.scrape component.
Advanced logs snippets
darwin
local.file_match "logs_integrations_integrations_squid" {
	path_targets = [{
		__address__ = "localhost",
		__path__    = "/var/log/squid/cache.log",
		instance    = constants.hostname,
		job         = "integrations/squid",
	}, {
		__address__ = "localhost",
		__path__    = "/var/log/squid/access.log",
		instance    = constants.hostname,
		job         = "integrations/squid",
	}]
}

loki.source.file "logs_integrations_integrations_squid" {
	targets    = local.file_match.logs_integrations_integrations_squid.targets
	forward_to = [loki.write.grafana_cloud_loki.receiver]
}
To monitor your Squid instance logs, you will use a combination of the following components:
local.file_match defines where to find the log file to be scraped. Change the following properties according to your environment:
__address__: The Squid instance address__path__: The path to the log file.instancelabel:constants.hostnamesets theinstancelabel to your Grafana Alloy server hostname. If that is not suitable, change it to a value uniquely identifies this Squid instance. Make sure this label value is the same for all telemetry data collected for this instance.
loki.source.file sends logs to Loki.
linux
local.file_match "logs_integrations_integrations_squid" {
	path_targets = [{
		__address__ = "localhost",
		__path__    = "/var/log/squid/cache.log",
		instance    = constants.hostname,
		job         = "integrations/squid",
	}, {
		__address__ = "localhost",
		__path__    = "/var/log/squid/access.log",
		instance    = constants.hostname,
		job         = "integrations/squid",
	}]
}

loki.source.file "logs_integrations_integrations_squid" {
	targets    = local.file_match.logs_integrations_integrations_squid.targets
	forward_to = [loki.write.grafana_cloud_loki.receiver]
}
To monitor your Squid instance logs, you will use a combination of the following components:
local.file_match defines where to find the log file to be scraped. Change the following properties according to your environment:
__address__: The Squid instance address__path__: The path to the log file.instancelabel:constants.hostnamesets theinstancelabel to your Grafana Alloy server hostname. If that is not suitable, change it to a value uniquely identifies this Squid instance. Make sure this label value is the same for all telemetry data collected for this instance.
loki.source.file sends logs to Loki.
windows
local.file_match "logs_integrations_integrations_squid" {
	path_targets = [{
		__address__ = "localhost",
		__path__    = "/var/log/squid/cache.log",
		instance    = constants.hostname,
		job         = "integrations/squid",
	}, {
		__address__ = "localhost",
		__path__    = "/var/log/squid/access.log",
		instance    = constants.hostname,
		job         = "integrations/squid",
	}]
}

loki.source.file "logs_integrations_integrations_squid" {
	targets    = local.file_match.logs_integrations_integrations_squid.targets
	forward_to = [loki.write.grafana_cloud_loki.receiver]
}
To monitor your Squid instance logs, you will use a combination of the following components:
local.file_match defines where to find the log file to be scraped. Change the following properties according to your environment:
__address__: The Squid instance address__path__: The path to the log file.instancelabel:constants.hostnamesets theinstancelabel to your Grafana Alloy server hostname. If that is not suitable, change it to a value uniquely identifies this Squid instance. Make sure this label value is the same for all telemetry data collected for this instance.
loki.source.file sends logs to Loki.
Kubernetes instructions
Before you begin with Kubernetes
Please note: These instructions assume the use of the Kubernetes Monitoring Helm chart
Metrics
To monitor your Squid instance metrics in k8s, you will need the following info to correctly configure the scrape snippets:
squid-service: the name of the squid servicesquid-namespace: the namespace where the Squid pod(s) livesquid-port: the configured port of your Squid deployment
Logs
To monitor your Squid instance logs in k8s, you will use a combination of the following components:
Please note: There are two loki.process components. One for the cache logs and another for access logs.
- discovery.relabel is used to filter logs from the various components. Change the following properties according to your environment:
squid-namespace: The namespace where the Squid pod(s) live.squid-pod-name: Regex to match the name of the Squid pod(s).squid-cluster-name: The name of your Squid cluster.instancelabel: This value needs to match theaddressvalue provided to the metrics exporter component.
Update the provided logs snippet for the Kubernetes Monitoring Helm chart with the variables above configured as appropriate.
Configuration snippets for Kubernetes Helm chart
The following snippets provide examples to guide you through the configuration process.
To scrape your Squid instances, manually modify your Kubernetes Monitoring Helm chart with these configuration snippets.
Replace any values between the angle brackets <> in the provided snippets with your desired configuration values.
Metrics snippets
alloy-metrics:
    extraConfig: |-
        prometheus.exporter.squid "squid_exporter" {
            address = "<squid-service>.<squid-namespace>.svc.cluster.local:<squid-port>"
        }

        prometheus.scrape "integrations_squid_default" {
            targets      = prometheus.exporter.squid.squid_exporter.targets
            job_name     = "integrations/squid"
            forward_to   = [prometheus.remote_write.grafana_cloud_metrics.receiver]
        }
Logs snippets
alloy-logs:
    extraConfig: |-
        loki.process "squid_cache_logs_process" {
            forward_to = [loki.relabel.squid_cache_logs_label.receiver]

            stage.drop {
                expression = \`^\\d+\\.\\d+\`
            }
            stage.multiline {
                firstline = \`^\\d{4}/\\d{2}/\\d{2} \\d{2}:\\d{2}:\\d{2}\`
            }
            stage.regex {
                expression = \`^\\d{4}/\\d{2}/\\d{2} \\d{2}:\\d{2}:\\d{2}\`
            }
        }

        loki.process "squid_access_logs_process" {
            forward_to = [loki.relabel.squid_access_logs_label.receiver]

            stage.drop {
                expression = \`^\\s+listening port: \\d+\`
            }
            stage.drop {
                expression = \`^\\d{4}/\\d{2}/\\d{2} \\d{2}:\\d{2}:\\d{2}\`
            }
            stage.regex {
                expression = \`^\\d+\\.\\d+\`
            }
        }

        loki.relabel "squid_cache_logs_label" {
            forward_to = [loki.write.logs_service.receiver]
            rule {
                replacement = "cache"
                target_label = "log_type"
            }
        }

        loki.relabel "squid_access_logs_label" {
            forward_to = [loki.write.logs_service.receiver]
            rule {
                replacement = "access"
                target_label = "log_type"
            }
        }

        discovery.relabel "squid_logs" {
            targets = discovery.relabel.pod_logs.output

            rule {
                replacement  = "<your-squid-cluster>"
                target_label = "squid_cluster"
            }

            rule {
                replacement   = "integrations/squid"
                target_label  = "job"
            }

            rule {
                replacement   = "<squid-exporter-address-value>"
                target_label  = "instance"
            }
        }

        loki.source.kubernetes "squid_logs" {
            targets      = discovery.relabel.squid_logs.output
            forward_to   = [loki.process.squid_access_logs_process.receiver,loki.process.squid_cache_logs_process.receiver]
        }
Dashboards
The Squid integration installs the following dashboards in your Grafana Cloud instance to help monitor your system.
- Squid logs
- Squid overview
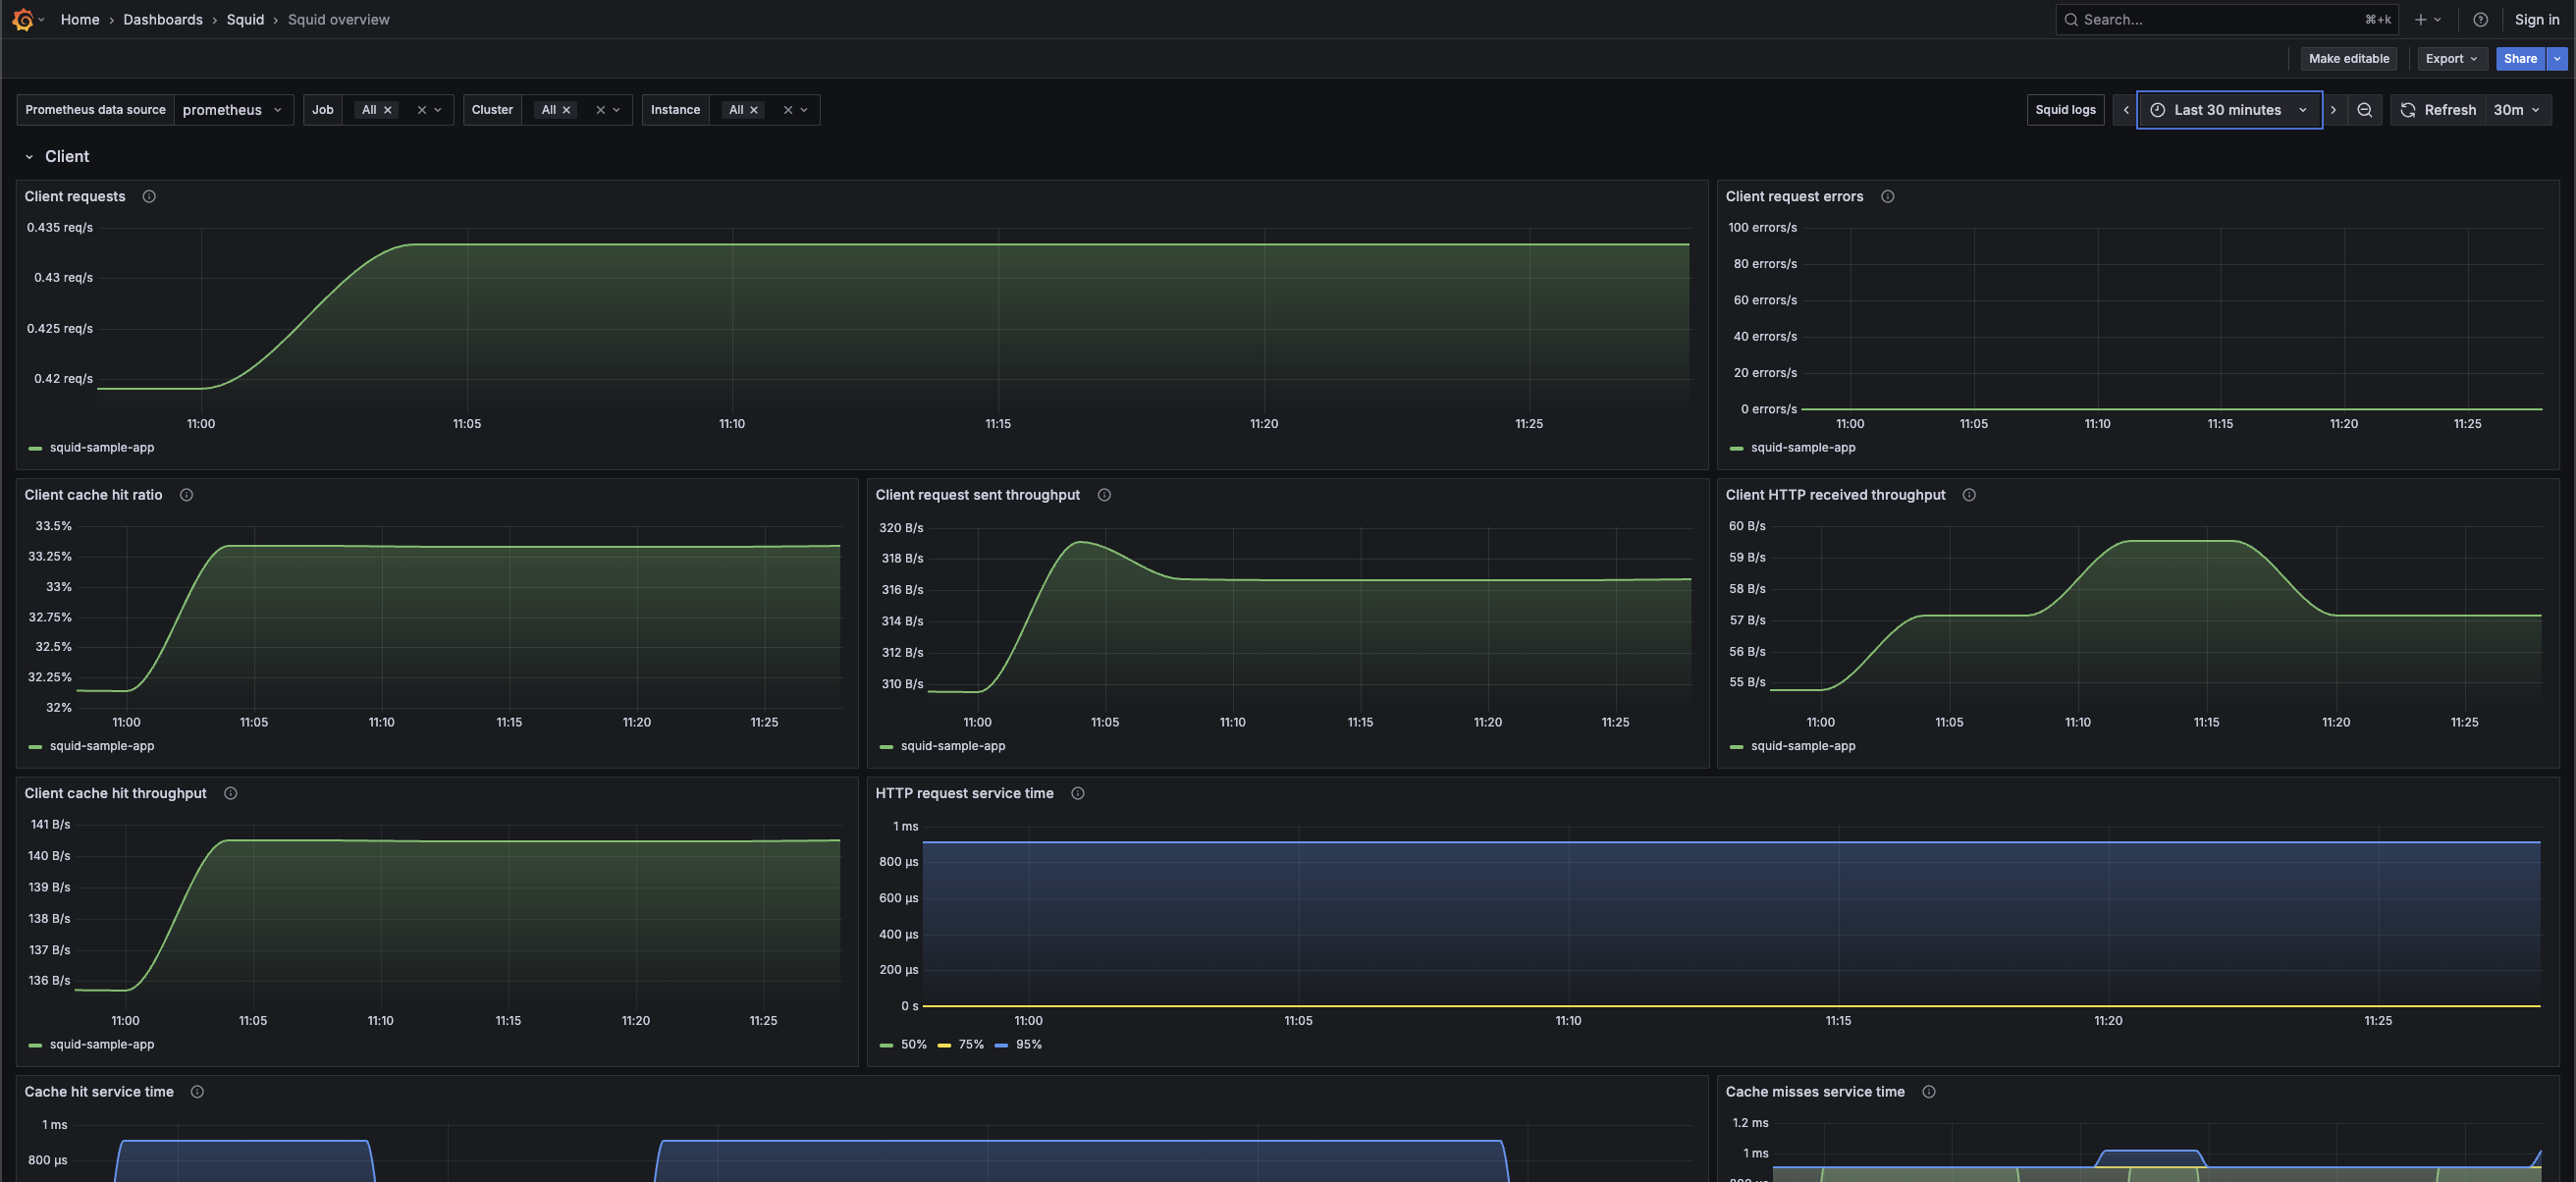
Squid overview dashboard (client)
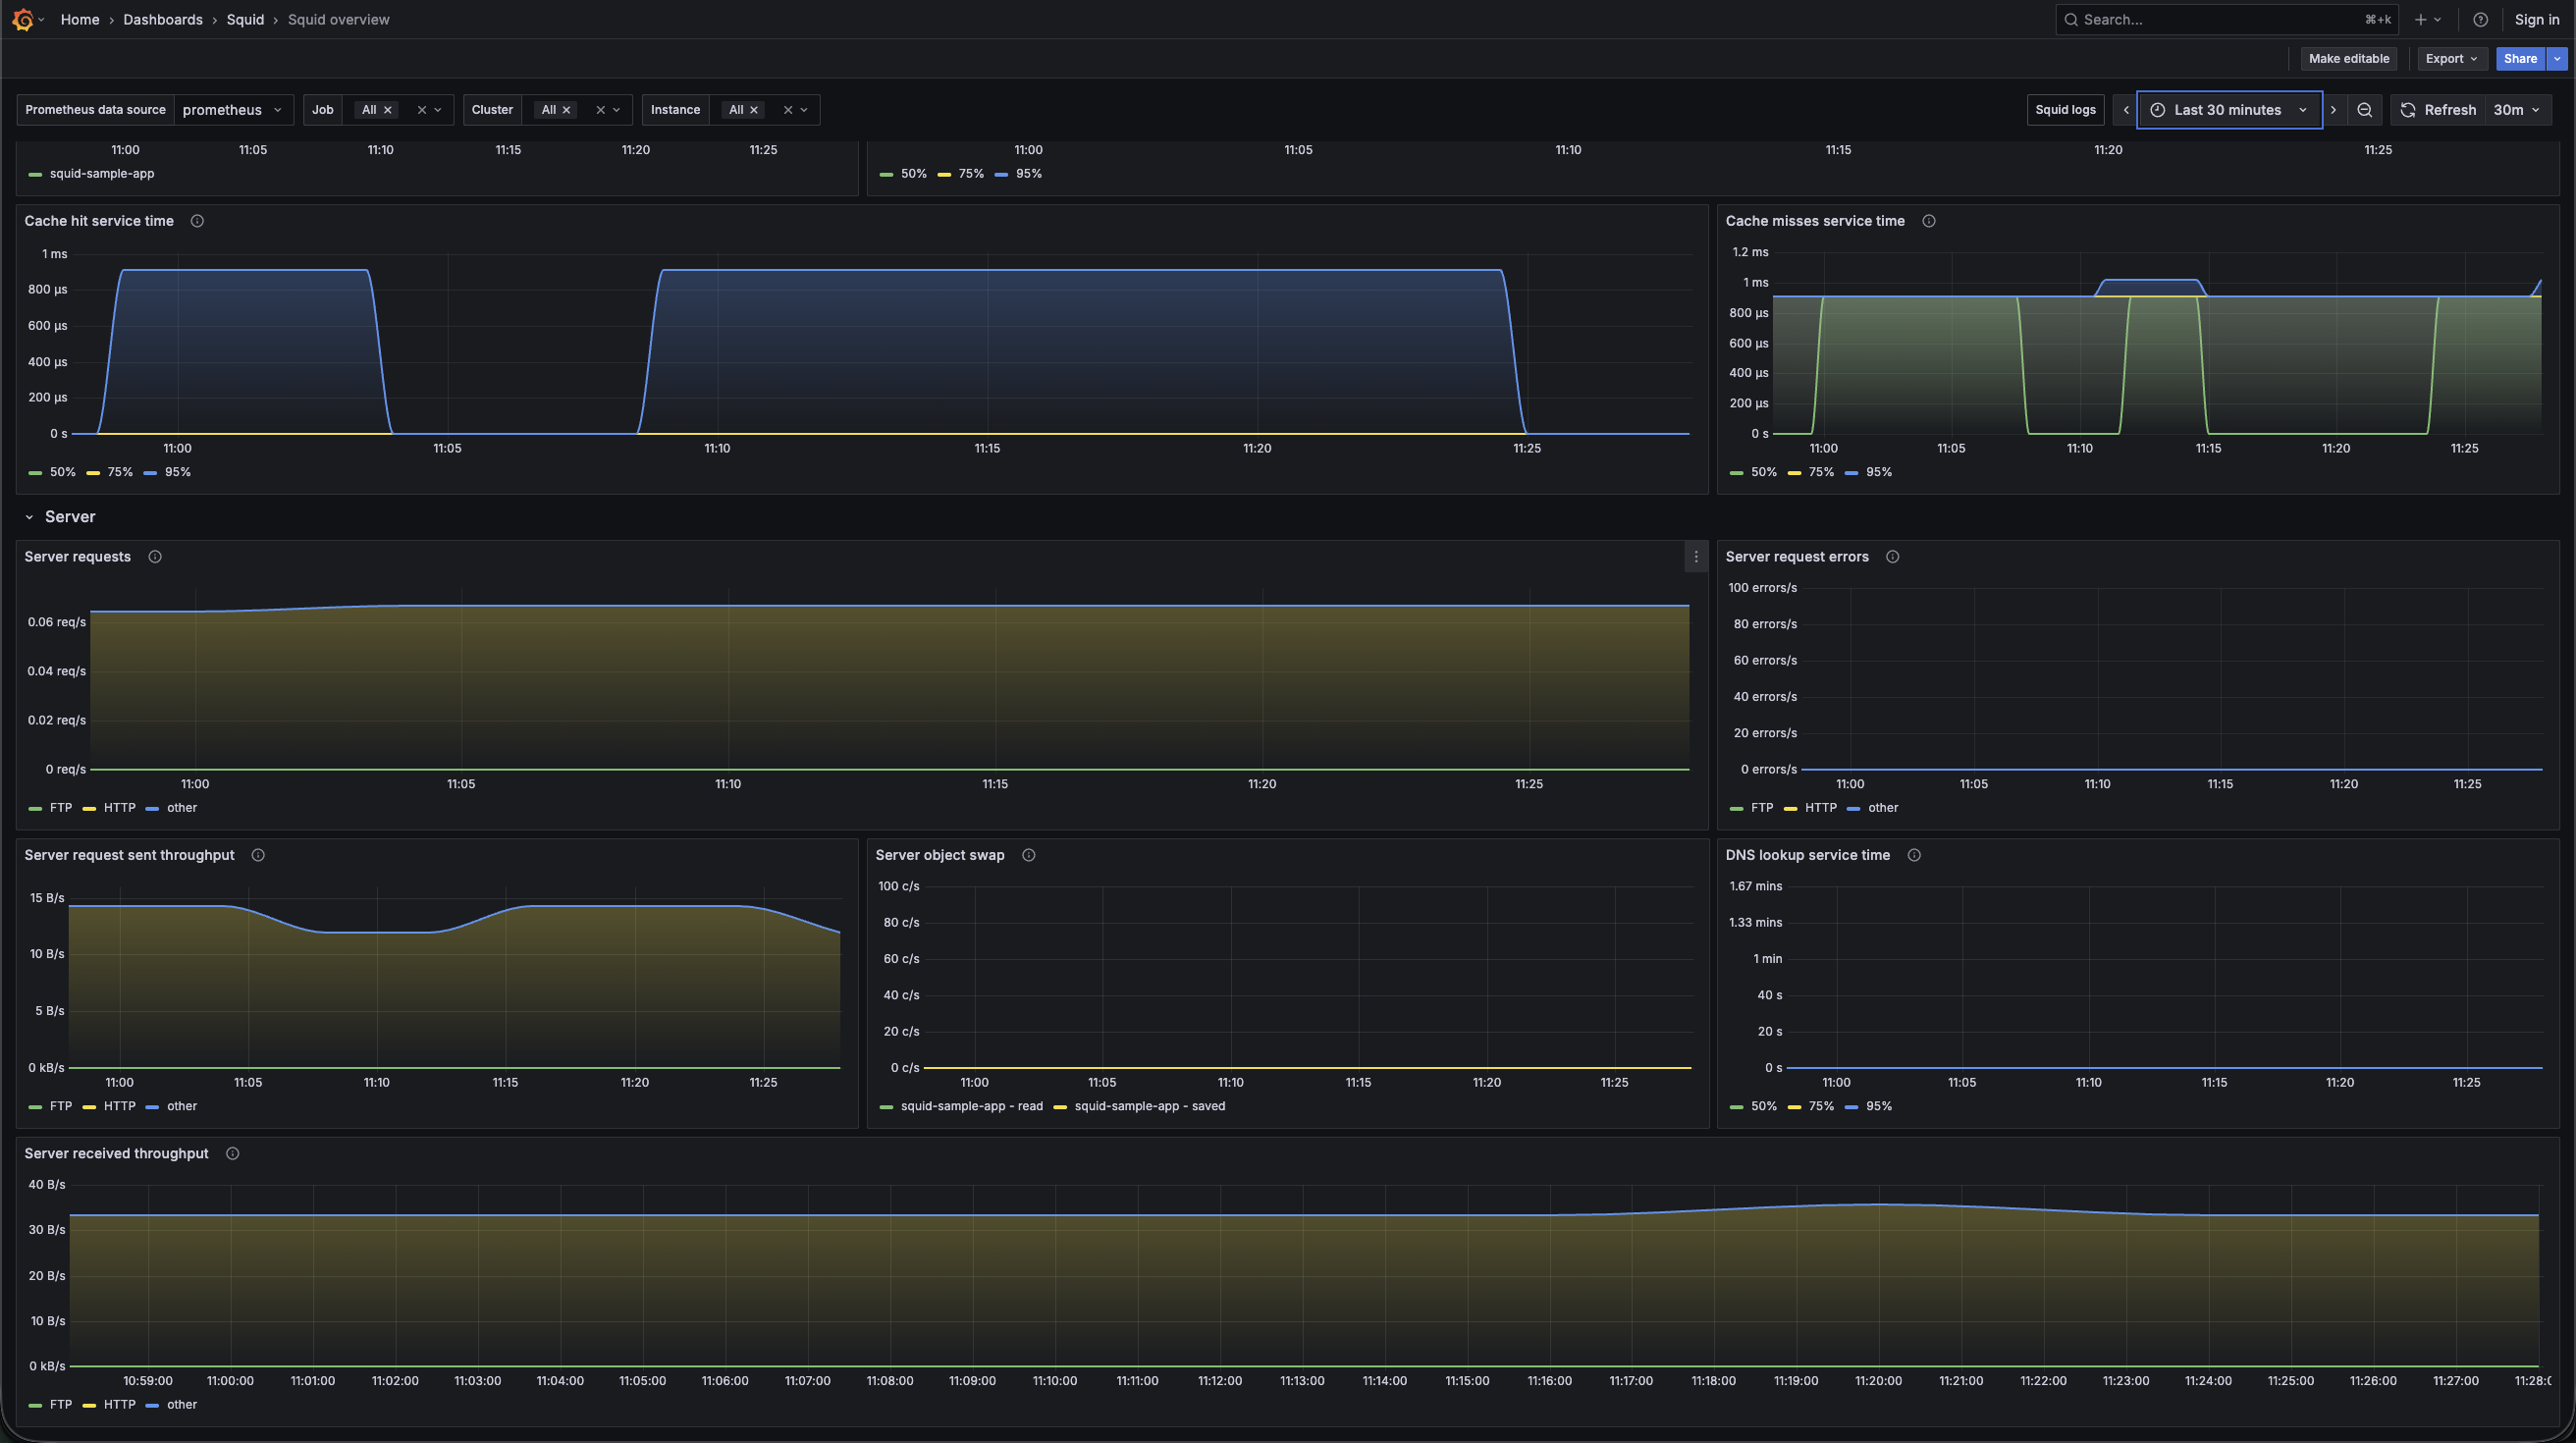
Squid overview dashboard (server)
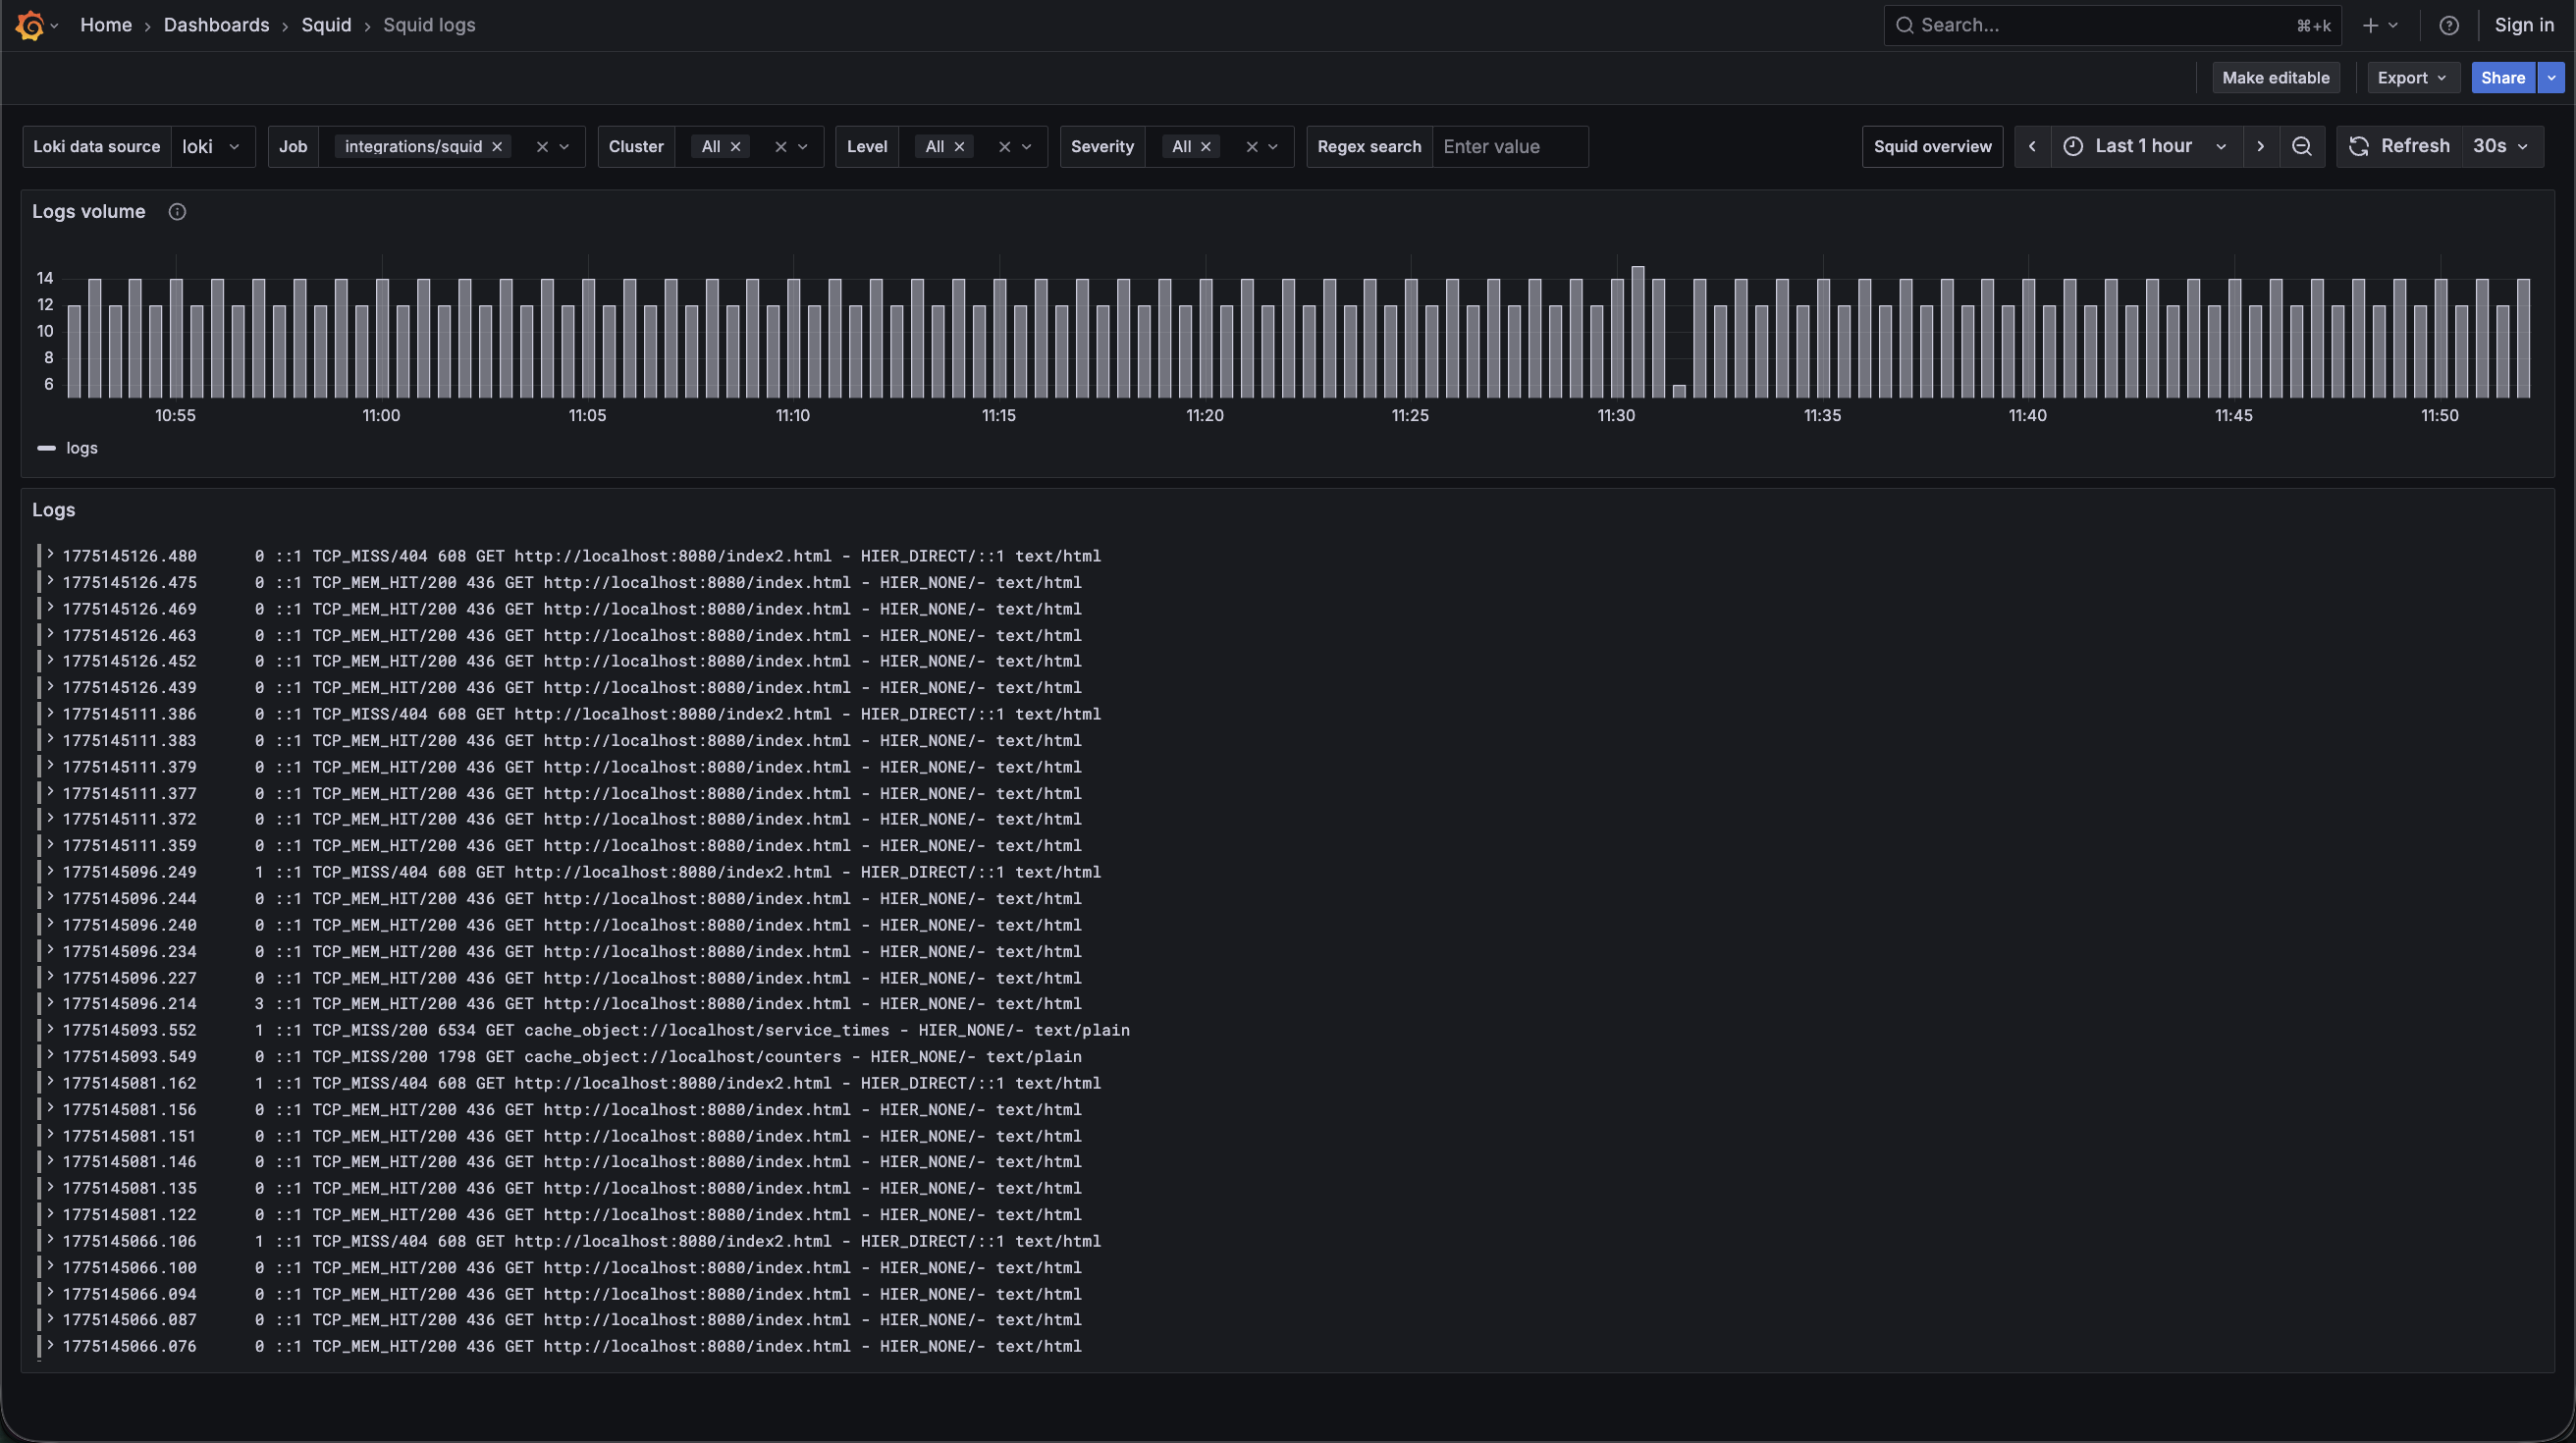
Squid logs dashboard
Alerts
The Squid integration includes the following useful alerts:
Metrics
The most important metrics provided by the Squid integration, which are used on the pre-built dashboards and Prometheus alerts, are as follows:
- squid_Cache_Hits_50
- squid_Cache_Hits_75
- squid_Cache_Hits_95
- squid_Cache_Misses_50
- squid_Cache_Misses_75
- squid_Cache_Misses_95
- squid_DNS_Lookups_50
- squid_DNS_Lookups_75
- squid_DNS_Lookups_95
- squid_HTTP_Requests_All_50
- squid_HTTP_Requests_All_75
- squid_HTTP_Requests_All_95
- squid_client_http_errors_total
- squid_client_http_hit_kbytes_out_bytes_total
- squid_client_http_hits_total
- squid_client_http_kbytes_in_kbytes_total
- squid_client_http_kbytes_out_kbytes_total
- squid_client_http_requests_total
- squid_server_ftp_errors_total
- squid_server_ftp_kbytes_in_kbytes_total
- squid_server_ftp_kbytes_out_kbytes_total
- squid_server_ftp_requests_total
- squid_server_http_errors_total
- squid_server_http_kbytes_in_kbytes_total
- squid_server_http_kbytes_out_kbytes_total
- squid_server_http_requests_total
- squid_server_other_errors_total
- squid_server_other_kbytes_in_kbytes_total
- squid_server_other_kbytes_out_kbytes_total
- squid_server_other_requests_total
- squid_swap_ins_total
- squid_swap_outs_total
- up
Changelog
# 1.1.1 - June 2026

* Fixed issue with default filtering selectors

# 1.1.0 - April 2026

* Updated dashboards to follow new stylistic standards
* Added a Squid logs dashboard dedicated to viewing log data

# 1.0.0 - July 2024

* Support for the Kubernetes plugin

# 0.0.3 - September 2023

* New Filter Metrics option for configuring the Grafana Agent, which saves on metrics cost by dropping any metric not used by this integration. Beware that anything custom built using metrics that are not on the snippet will stop working.
* New hostname relabel option, which applies the instance name you write on the text box to the Grafana Agent configuration snippets, making it easier and less error prone to configure this mandatory label.

# 0.0.2 - August 2023

* Add regex filter for logs datasource

# 0.0.1 - July 2023

* Initial Release
Cost
By connecting your Squid instance to Grafana Cloud, you might incur charges. To view information on the number of active series that your Grafana Cloud account uses for metrics included in each Cloud tier, see Active series and dpm usage and Cloud tier pricing.


