Visualization and monitoring solutions
Visualization and monitoring solutions  /  Monitor Jenkins
Jenkins logo

Monitor Jenkins easily with Grafana

Easily monitor your deployment of Jenkins, the open source automation server, with Grafana Cloud’s out-of-the-box monitoring solution. The Grafana Cloud forever free tier includes 3 users and up to 10k metrics series to support your monitoring needs.
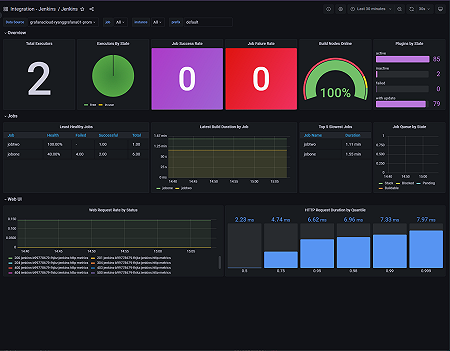
Key metrics included

http_requests
http_responseCodes_badRequest_total
http_responseCodes_created_total
http_responseCodes_forbidden_total
http_responseCodes_noContent_total
http_responseCodes_notFound_total
http_responseCodes_notModified_total
http_responseCodes_ok_total
http_responseCodes_other_total
http_responseCodes_serverError_total
http_responseCodes_serviceUnavailable_total
jenkins_executor_count_value
jenkins_node_count_value
jenkins_node_online_value
jenkins_plugins_active
jenkins_plugins_failed
jenkins_plugins_inactive
jenkins_plugins_withUpdate
jenkins_queue_blocked_value
jenkins_queue_buildable_value
jenkins_queue_pending_value
jenkins_queue_stuck_value
jenkins_runs_failure_total
jenkins_runs_success_total
up