Configure Java to generate Prometheus metrics
Use one of the following options to configure Java to generate Prometheus metrics:
- Install JMX Exporter
- (Recommended) Install Micrometer Prometheus Exporter. The Micrometer exporter provides more information.
Metrics and KPIs
| Metric | KPI |
|---|---|
GC Count jvm_gc_pause_seconds_count | Rate of GC Count rate(jvm_gc_pause_seconds_count{action=“end of major GC”}[2m]) |
GC Pause Time jvm_gc_pause_seconds_sum | Rate of GC Pause Time rate(jvm_gc_pause_seconds_sum{action=“end of major GC”}[2m]) |
Live Thread Count jvm_threads_live_threads | Live thread count normalized against a threshold jvm_threads_live_threads / 200 |
Alerts
| KPI | Alert |
|---|---|
| Rate of GC Count | JvmMajorGCCountHigh |
| Rate of GC Pause Time | JvmMajorGCTimeHigh |
| Live Thread Count | Saturation on jvm:live_threads |
Dashboard
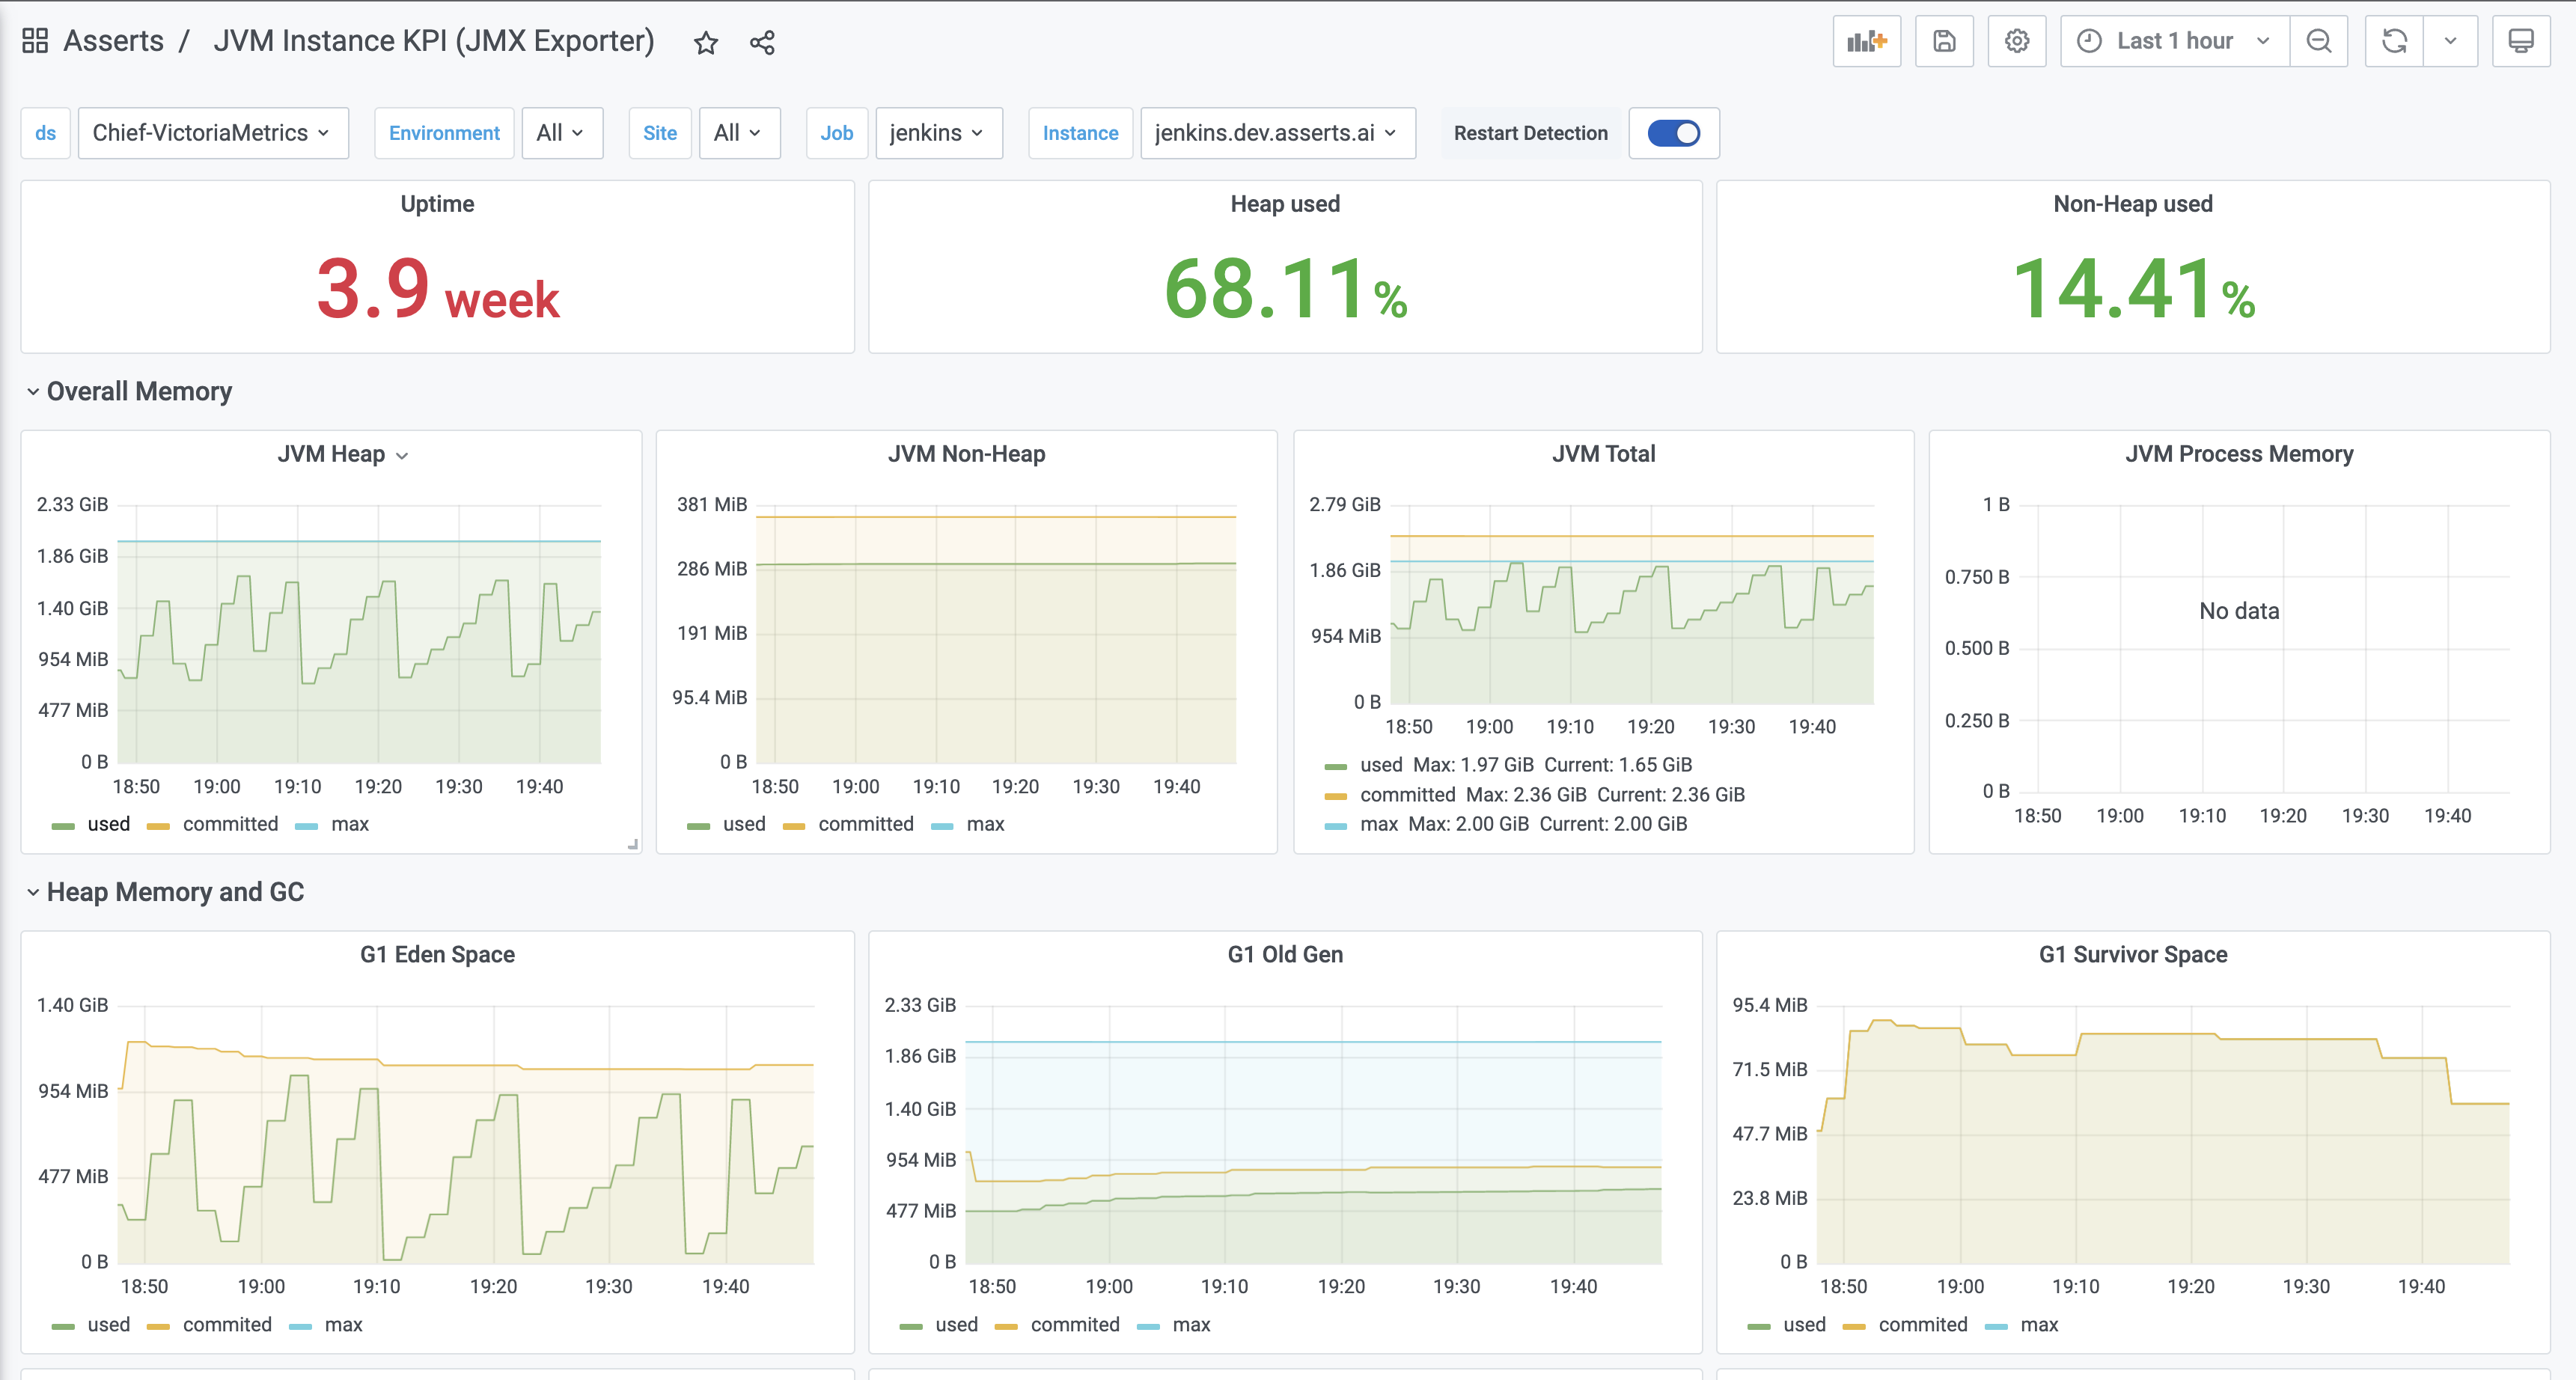
The JVM instance KPI dashboard includes metrics for CPU, heap memory, non-heap memory, buffer pools, threads, file descriptors, and classes loaded.
CPU
- system_cpu_usage
- process_cpu_usage
- system_cpu_count
- system_load_average_1m
Heap memory
The following heap metrics are available for Eden Space, Survivor Space, and Tenured Generation.
- jvm_memory_used_bytes{area=“heap”}
- jvm_memory_committed_bytes{area=“heap”}
- jvm_memory_max_bytes{area=“heap”}
Non-heap memory
The following non-heap metrics are available for Metaspace, Compressed Class Space, and Code Cache.
- jvm_memory_used_bytes{area=“nonheap”}
- jvm_memory_committed_bytes{area=“nonheap”}
- jvm_memory_max_bytes{area=“nonheap”}
Buffer pools
The following metrics are available for Direct and Mapped buffers.
- jvm_buffer_total_capacity_bytes
- jvm_buffer_memory_used_bytes
- jvm_buffer_count_buffers
Threads
- jvm_threads_live_threads
- jvm_threads_daemon_threads
- jvm_threads_peak_threads
- process_threads
- jvm_threads_states_threads
File descriptors
- process_files_open_files
- process_files_max_files
Classes loaded
- jvm_classes_loaded_classes

Was this page helpful?
Related resources from Grafana Labs


