Menu
Grafana Cloud
Enterprise
Open source
Manage and inspect variables
In the Variables section of the sidebar, you can add variables and manage existing variables. You can also inspect variables to identify any dependencies between them.
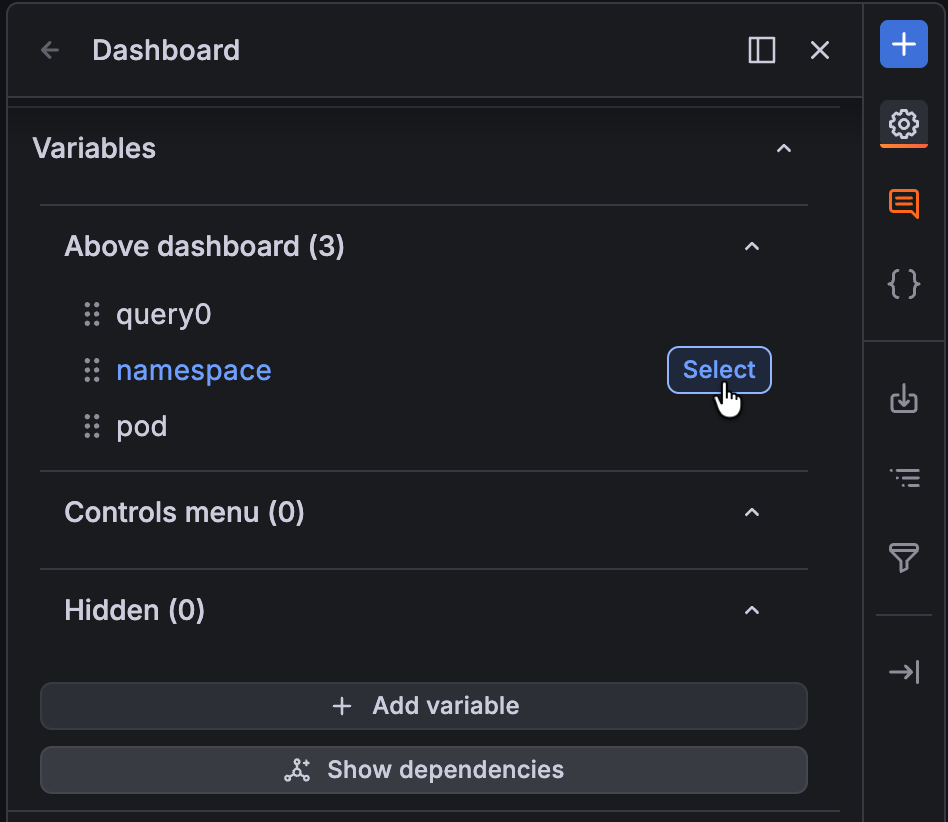
Manage variables
You can take the following actions in the Variables section of the sidebar:
- Edit: Click Select on the control to open it in the sidebar so you can make updates. Then you can access the following options:
- Duplicate: Duplicate a variable by clicking the clone icon the sidebar header. This creates a copy of the variable with the name of the original variable prefixed with
copyand the number of the copy; for example, “copy1”. - Delete: Delete a variable by clicking the trash icon in sidebar header.
- Duplicate: Duplicate a variable by clicking the clone icon the sidebar header. This creates a copy of the variable with the name of the original variable prefixed with
- Reorder: Drag and drop controls to reorder them.
- Change display: Drag and drop controls between sub-sections Above dashboard, Controls menu, and Hidden to update the control display option. Note that links can’t be hidden.
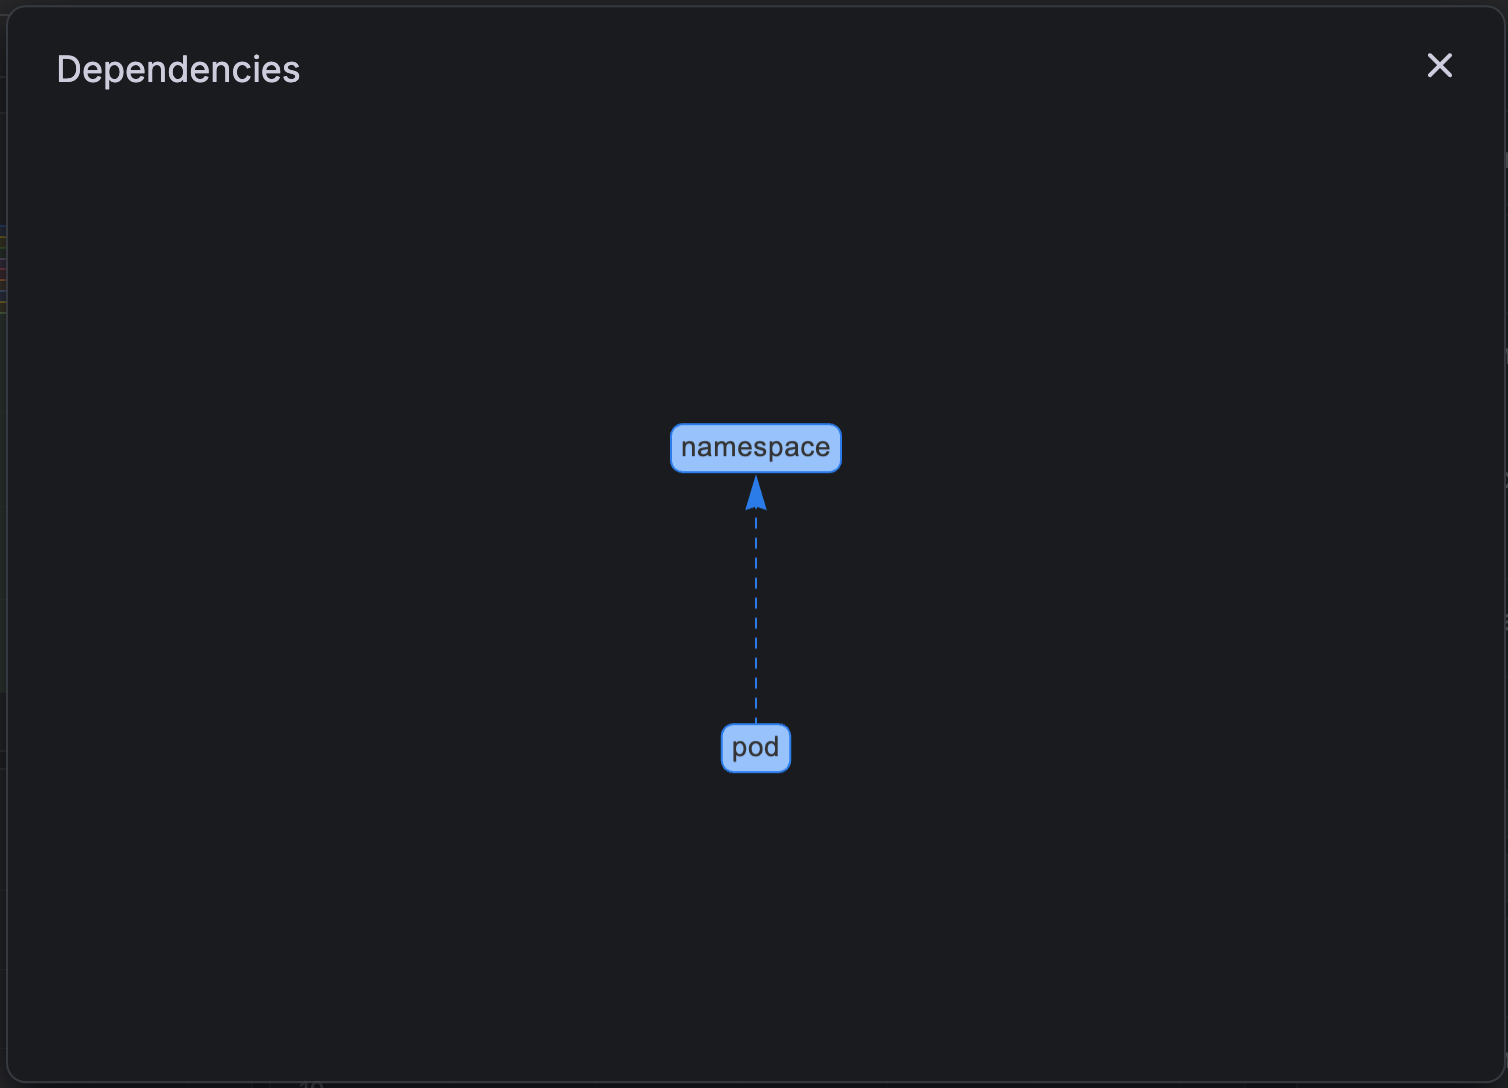
Inspect variables
In addition to managing variables, the Variables section lets you quickly identify whether variables have any dependencies. To check, click Show dependencies at the bottom of the list, which opens the dependencies diagram: