Apache Mesos integration for Grafana Cloud
Apache Mesos is an open-source distributed systems kernel that acts as a platform for managing and orchestrating computing resources across clusters of machines. Apache Mesos integration for Grafana cloud allows users to monitor masters events queue, registrar state, allocator usage as well as disk, memory and logs for both the master and agent targets in an overview dashboard.
This integration supports Apache Mesos 1.4.x+
This integration supports the Prometheus Mesos Exporter v1.1.2
This integration includes 5 useful alerts and 2 pre-built dashboards to help monitor and visualize Apache Mesos metrics and logs.
Before you begin
In order for the integration to work properly, you must enable logs and set up the Prometheus Mesos Exporter on your primary host. In a production environment, Apache Mesos master and agent node are ran separately for better resource management, availability and fault tolerance. Each master or agent node has their own log path and requires a prometheus exporter installation.
Enable logs for Apache Mesos
Users must enable Apache Mesos Logs in order for log panels on the dashboard to populate. Logs are added to either the Mesos master or agent node by specifying the log directory using --log_dir=. This path will also differ depending on if you are running Linux or Windows but is required so that Promtail can ingest the logs.
Run the Mesos master with the following flags:--log_dir=/var/log/mesos/master/ on Linux masters–-log_dir=C:\Program Files\mesos\master\ on Windows masters
Run the Mesos agent with the following flags:--log_dir=/var/log/mesos/agent/ on Linux agents–-log_dir=C:\Program Files\mesos\agent\ on Windows agents
Set up Prometheus Exporter for Apache Mesos
The Prometheus Mesos Exporter v1.1.2 must be setup with a Prometheus configuration file specifying a master or agent node. Run the Mesos exporter master process with mesos_exporter -master http://localhost:5050 and run the Mesos exporter for Alloy process with mesos_exporter -slave http://localhost:5051. For more information on how to configure the Prometheus exporter, please refer to Prometheus configuration documentation.
To validate that the Prometheus exporter is working correctly, curl the master Prometheus metrics endpoint on the port 9105:
curl http://localhost:9105/metricsInstall Apache Mesos integration for Grafana Cloud
- In your Grafana Cloud stack, click Connections in the left-hand menu.
- Find Apache Mesos and click its tile to open the integration.
- Review the prerequisites in the Configuration Details tab and set up Grafana Alloy to send Apache Mesos metrics and logs to your Grafana Cloud instance.
- Click Install to add this integration’s pre-built dashboards and alerts to your Grafana Cloud instance, and you can start monitoring your Apache Mesos setup.
Configuration snippets for Grafana Alloy
Advanced mode
The following snippets provide examples to guide you through the configuration process.
To instruct Grafana Alloy to scrape your Apache Mesos instances, manually copy and append the snippets to your alloy configuration file, then follow subsequent instructions.
Advanced metrics snippets
discovery.relabel "metrics_integrations_integrations_apache_mesos" {
	targets = [{
		__address__ = "<node-name>:<node-exporter-port>",
	}]

	rule {
		target_label = "mesos_cluster"
		replacement  = "<your-cluster-name>"
	}

	rule {
		target_label = "instance"
		replacement  = constants.hostname
	}
}

prometheus.scrape "metrics_integrations_integrations_apache_mesos" {
	targets    = discovery.relabel.metrics_integrations_integrations_apache_mesos.output
	forward_to = [prometheus.remote_write.metrics_service.receiver]
	job_name   = "integrations/apache-mesos"
}
To monitor your Apache Mesos instance, you must use a discovery.relabel component to discover your Apache Mesos Prometheus endpoint and apply appropriate labels, followed by a prometheus.scrape component to scrape it.
Configure the following properties within each discovery.relabel component:
__address__: The address to your Apache Mesos Prometheus metrics endpoint.instancelabel:constants.hostnamesets theinstancelabel to your Grafana Alloy server hostname. If that is not suitable, change it to a value uniquely identifies this Apache Mesos instance. Make sure this label value is the same for all telemetry data collected for this instance.mesos_cluster: Themesos_clusterlabel to group your Apache Mesos instances within a cluster. Set the same value for all nodes within your cluster.
If you have multiple Apache Mesos servers to scrape, configure one discovery.relabel for each and scrape them by including each under targets within the prometheus.scrape component.
Advanced logs snippets
linux
local.file_match "logs_integrations_integrations_apache_mesos" {
	path_targets = [{
		__address__   = "localhost",
		__path__      = "<mesos-node-log-dir>",
		instance      = constants.hostname,
		job           = "integrations/apache-mesos",
		mesos_cluster = "<mesos-cluster-name>",
	}]
}

loki.source.file "logs_integrations_integrations_apache_mesos" {
	targets    = local.file_match.logs_integrations_integrations_apache_mesos.targets
	forward_to = [loki.write.grafana_cloud_loki.receiver]
}
To monitor your Apache Mesos instance logs, you will use a combination of the following components:
local.file_match defines where to find the log file to be scraped. Change the following properties according to your environment:
__address__: The Apache Mesos instance address__path__: The path to the log file. It must be the log dir specified in the--log_dir=depending on your node and OS as instructed when enabling logs for Apache Mesos whose default values would be either:/var/log/mesos/master/for a master node on LinuxC:\Program Files\mesos\master\for a master node on Windows/var/log/mesos/agent/for an agent node on LinuxC:\Program Files\mesos\agent\for an agent node on Windows
instancelabel:constants.hostnamesets theinstancelabel to your Grafana Alloy server hostname. If that is not suitable, change it to a value uniquely identifies this Apache Mesos instance. Make sure this label value is the same for all telemetry data collected for this instance.mesos_cluster: Themesos_clusterlabel to group your Apache Mesos instances within a cluster. Set the same value for all nodes within your cluster.
loki.source.file sends logs to Loki.
windows
local.file_match "logs_integrations_integrations_apache_mesos" {
	path_targets = [{
		__address__   = "localhost",
		__path__      = "<mesos-node-log-dir>",
		instance      = constants.hostname,
		job           = "integrations/apache-mesos",
		mesos_cluster = "<mesos-cluster-name>",
	}]
}

loki.source.file "logs_integrations_integrations_apache_mesos" {
	targets    = local.file_match.logs_integrations_integrations_apache_mesos.targets
	forward_to = [loki.write.grafana_cloud_loki.receiver]
}
To monitor your Apache Mesos instance logs, you will use a combination of the following components:
local.file_match defines where to find the log file to be scraped. Change the following properties according to your environment:
__address__: The Apache Mesos instance address__path__: The path to the log file. It must be the log dir specified in the--log_dir=depending on your node and OS as instructed when enabling logs for Apache Mesos whose default values would be either:/var/log/mesos/master/for a master node on LinuxC:\Program Files\mesos\master\for a master node on Windows/var/log/mesos/agent/for an agent node on LinuxC:\Program Files\mesos\agent\for an agent node on Windows
instancelabel:constants.hostnamesets theinstancelabel to your Grafana Alloy server hostname. If that is not suitable, change it to a value uniquely identifies this Apache Mesos instance. Make sure this label value is the same for all telemetry data collected for this instance.mesos_cluster: Themesos_clusterlabel to group your Apache Mesos instances within a cluster. Set the same value for all nodes within your cluster.
loki.source.file sends logs to Loki.
Kubernetes instructions
Before you begin with Kubernetes
Please note: These instructions assume the use of the Kubernetes Monitoring Helm chart
In order for the integration to work properly, you must enable logs and set up the Prometheus Mesos Exporter on your primary host. In a production environment, Apache Mesos master and agent node are ran separately for better resource management, availability and fault tolerance. Each master or agent node has their own log path and requires a prometheus exporter installation.
Enable logs for Apache Mesos
Users must enable Apache Mesos Logs in order for log panels on the dashboard to populate. Logs are added to either the Mesos master or agent node by specifying the log directory using --log_dir=. This path will also differ depending on if you are running Linux or Windows but is required so that Promtail can ingest the logs.
Run the Mesos master with the following flags:--log_dir=/var/log/mesos/master/ on Linux masters–-log_dir=C:\Program Files\mesos\master\ on Windows masters
Run the Mesos agent with the following flags:--log_dir=/var/log/mesos/agent/ on Linux agents–-log_dir=C:\Program Files\mesos\agent\ on Windows agents
Set up Prometheus Exporter for Apache Mesos
The Prometheus Mesos Exporter v1.1.2 must be setup with a Prometheus configuration file specifying a master or agent node. Run the Mesos exporter master process with mesos_exporter -master http://localhost:5050 and run the Mesos exporter for the agent process with mesos_exporter -slave http://localhost:5051. For more information on how to configure the Prometheus exporter, please refer to Prometheus configuration documentation.
To validate that the Prometheus exporter is working correctly, curl the master Prometheus metrics endpoint on the port 9105:
curl http://localhost:9105/metricsConfiguration snippets for Kubernetes Helm chart
The following snippets provide examples to guide you through the configuration process.
To scrape your Apache Mesos instances, manually modify your Kubernetes Monitoring Helm chart with these configuration snippets.
Replace any values between the angle brackets <> in the provided snippets with your desired configuration values.
Metrics snippets
alloy-metrics:
    extraConfig: |-
        discovery.kubernetes "apache_mesos" {
            role = "endpoints"
            selectors {
                role = "service"
                field = "metadata.name=<apache_mesos_service_name>"
            }
        }

        discovery.relabel "apache_mesos" {
            targets = discovery.kubernetes.apache_mesos.targets
            rule {
                source_labels = ["__meta_kubernetes_endpoint_port_name"]
                regex         = "<your-exporter-endpoint-port-name>"
                action        = "keep"
            }
            rule {
                replacement  = "<your-mesos-cluster-name>"
                target_label = "mesos_cluster"
            }
        }

        prometheus.scrape "integrations_mesos_statsd_exporter" {
            targets    = discovery.relabel.apache_mesos.output
            job_name   = "integrations/apache-mesos"
            forward_to = [prometheus.remote_write.grafana_cloud_metrics.receiver]
        }
Logs snippets
podLogs:
    extraDiscoveryRules: |-
        rule {
            source_labels = ["__meta_kubernetes_namespace", "__meta_kubernetes_pod_name", "__meta_kubernetes_pod_container_name"]
            separator     = ":"
            regex         = "(<mesos-namespace>:<mesos-master-pod-name>:<mesos-master-container-name>)"
            replacement   = "apache_mesos"
            target_label  = "integration"
        }
        rule {
            source_labels = ["integration"]
            regex         = "apache_mesos"
            replacement   = "master"
            target_label  = "log_type"
        }
        rule {
            source_labels = ["__meta_kubernetes_namespace", "__meta_kubernetes_pod_name", "__meta_kubernetes_pod_container_name"]
            separator     = ":"
            regex         = "(<mesos-namespace>:<mesos-agent-pod-name>:<mesos-agent-container-name>)"
            replacement = "apache_mesos"
            target_label = "integration"
        }
        rule {
            source_labels = ["integration", "log_type"]
            separator     = ":"
            regex         = "apache_mesos:"
            replacement   = "agent"
            target_label  = "log_type"
        }
        rule {
            source_labels = ["integration", "__meta_kubernetes_node_name"]
            separator     = ":"
            regex         = "apache_mesos:(.*)"
            target_label  = "node"
        }
        rule {
            source_labels = ["integration"]
            regex         = "apache_mesos"
            replacement   = "<your-mesos-cluster-name>"
            target_label  = "mesos_cluster"
        }
        rule {
            source_labels = ["integration"]
            regex         = "apache_mesos"
            replacement   = "integrations/mesos"
            target_label  = "job"
        }
Dashboards
The Apache Mesos integration installs the following dashboards in your Grafana Cloud instance to help monitor your system.
- Apache Mesos logs
- Apache Mesos overview
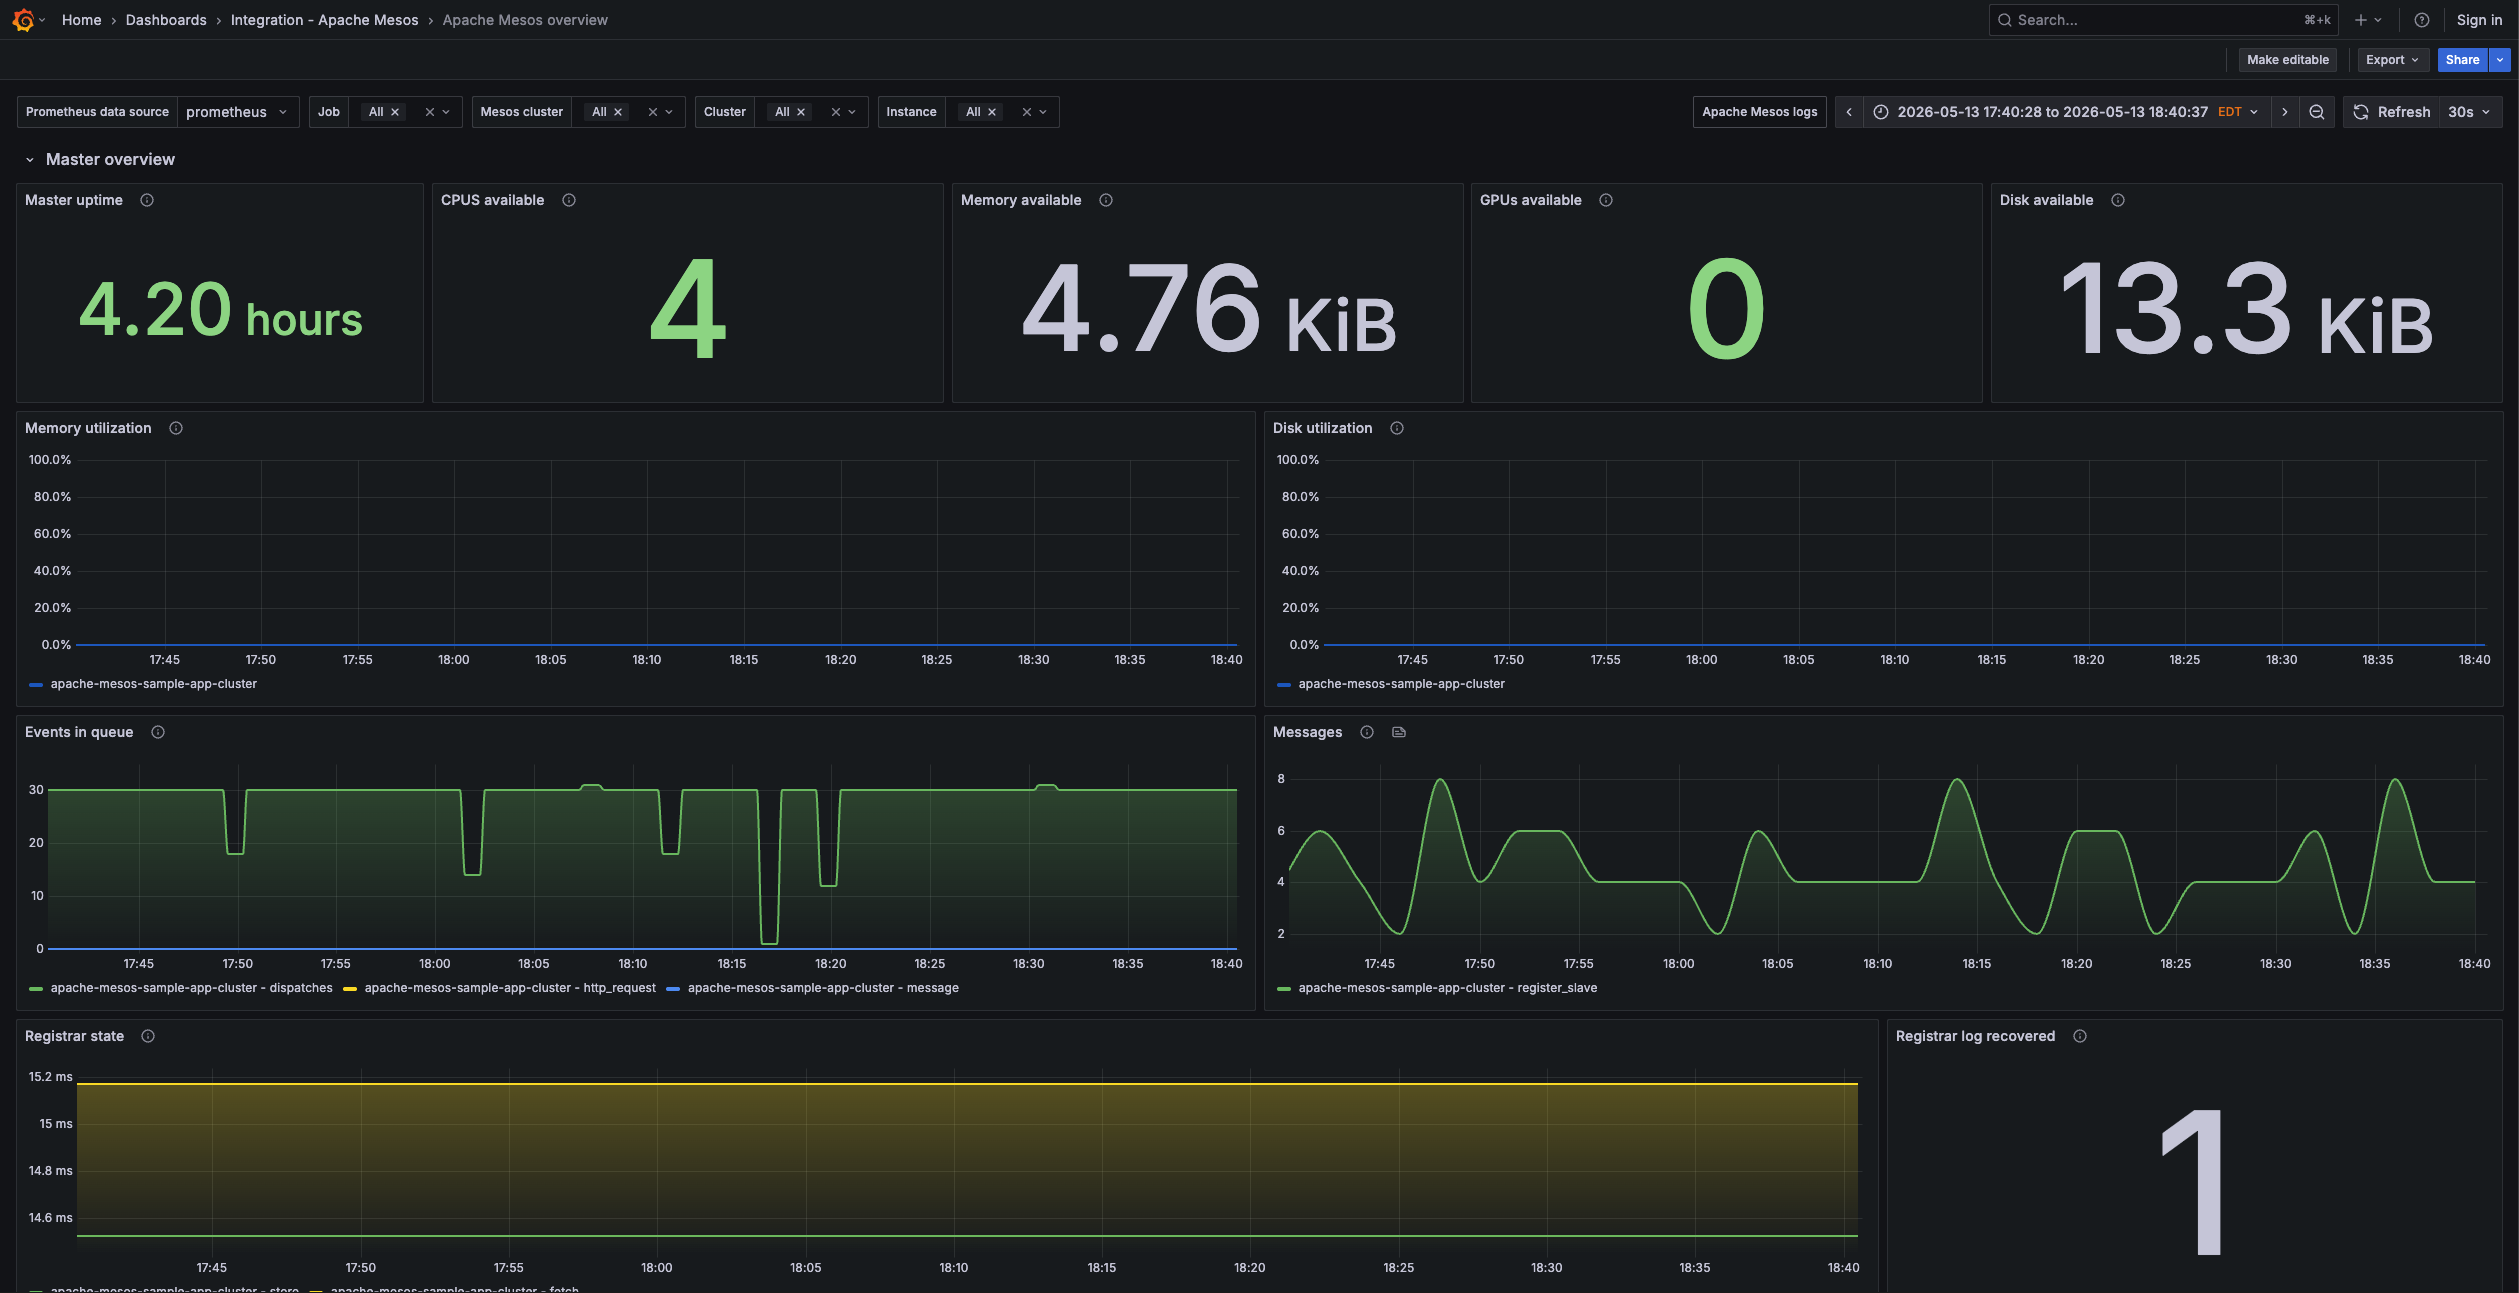
Apache Mesos overview dashboard part 1
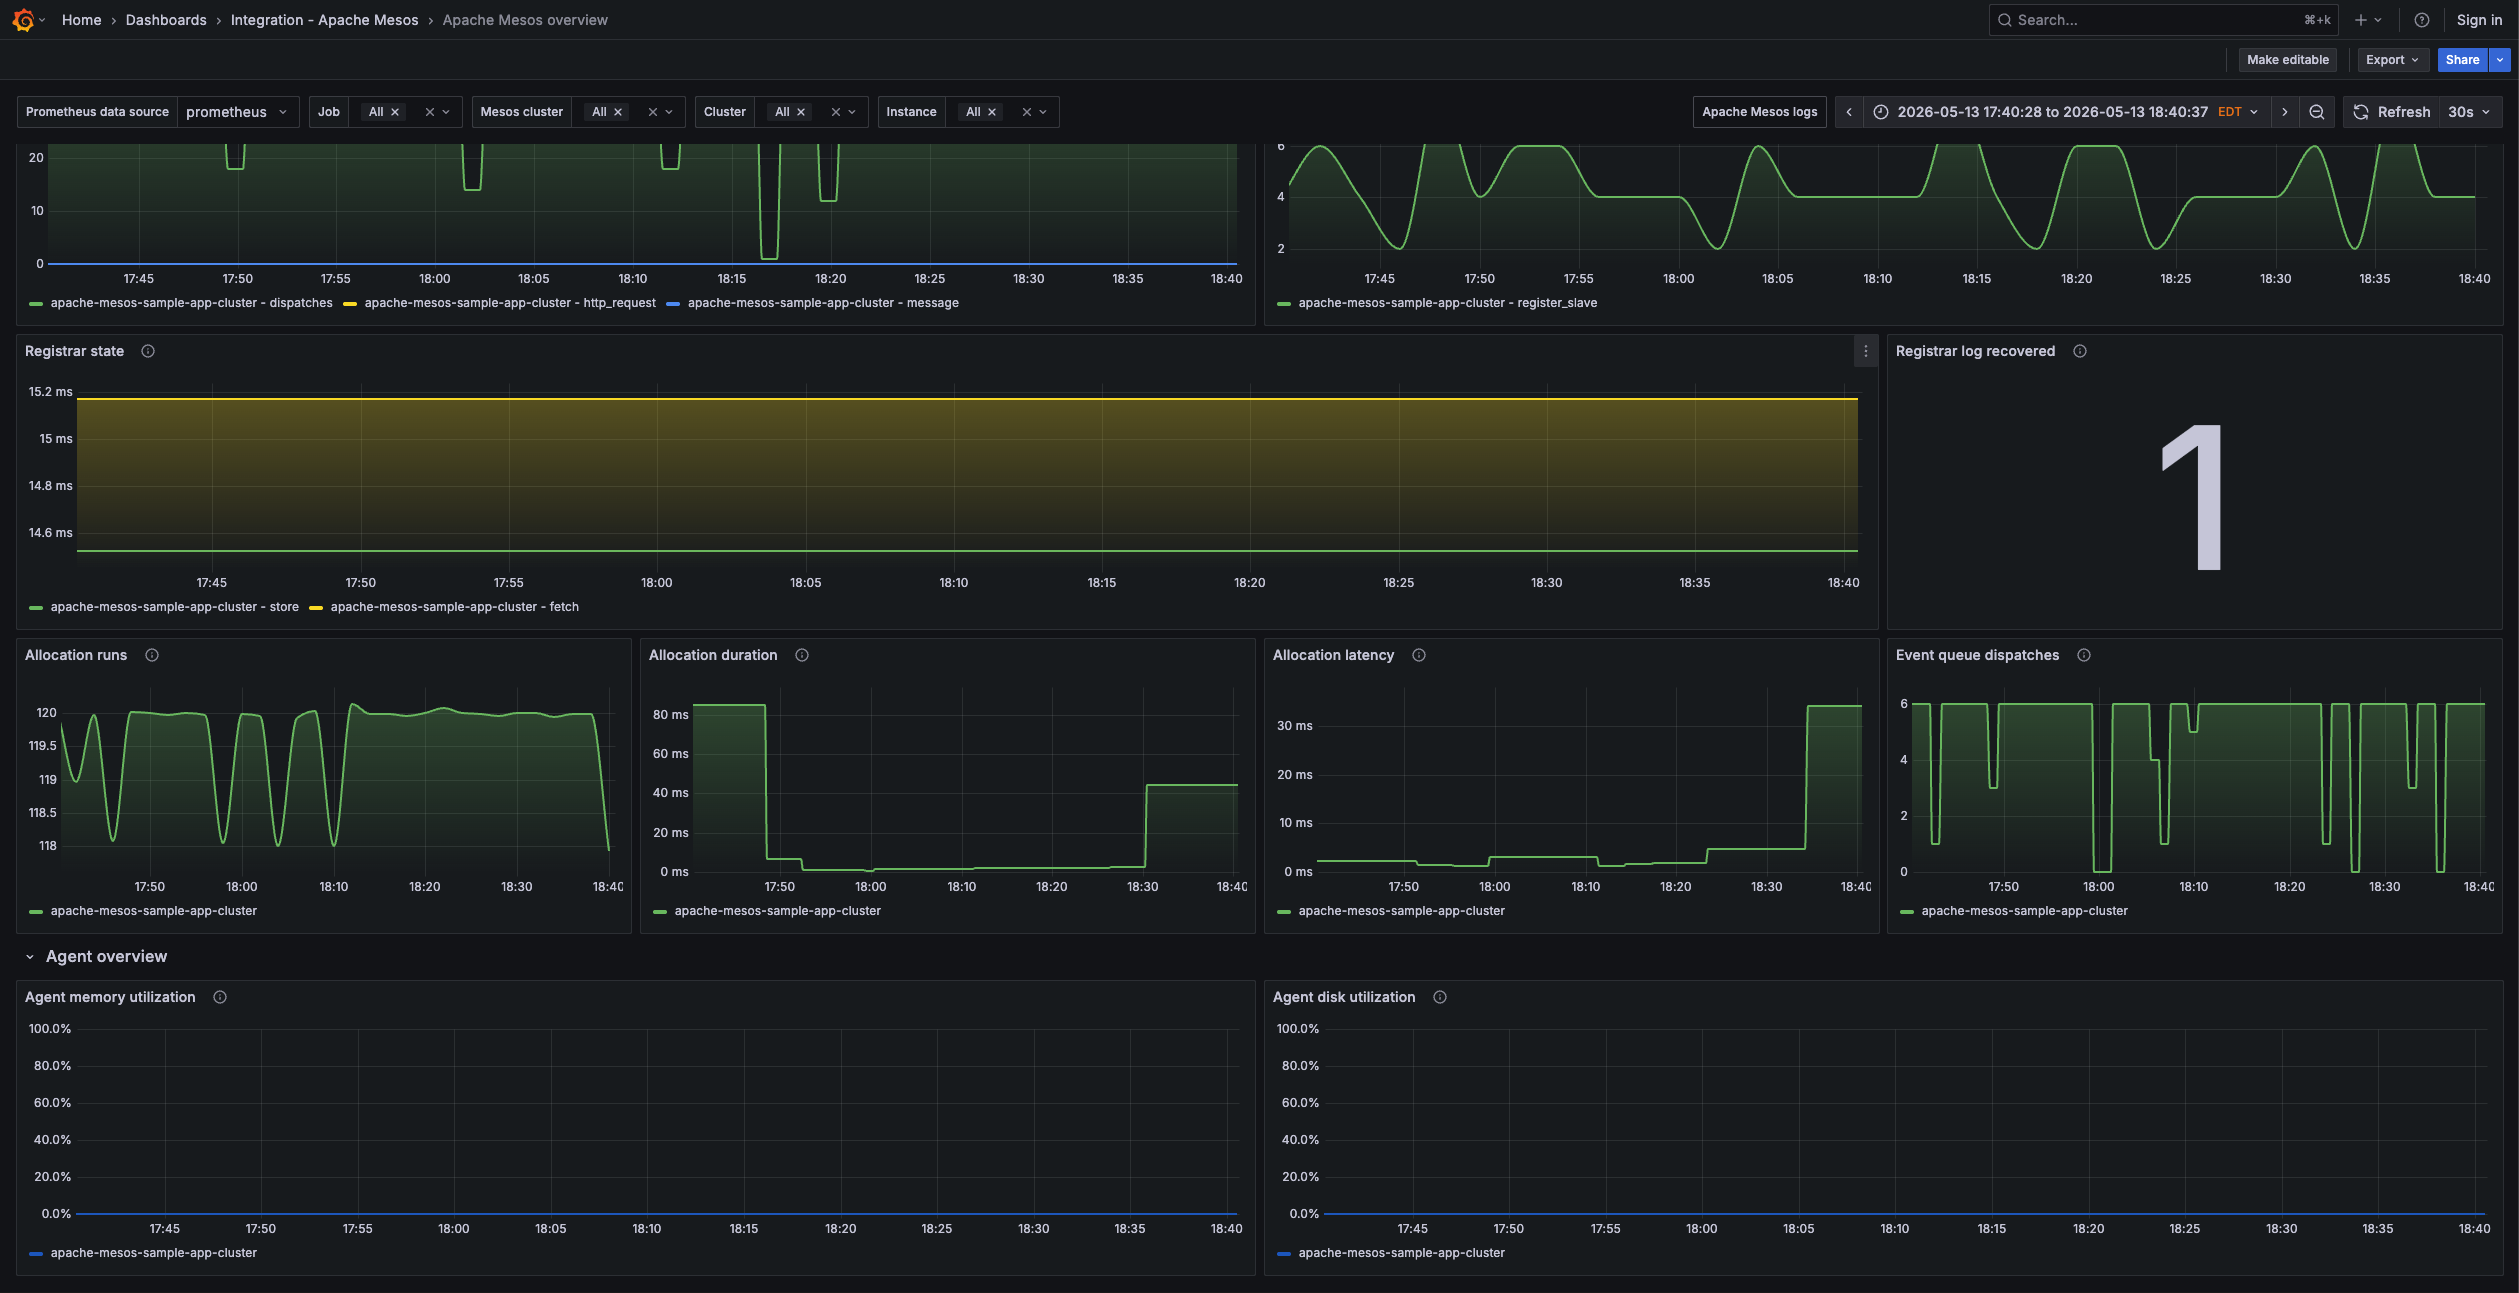
Apache Mesos overview dashboard part 2
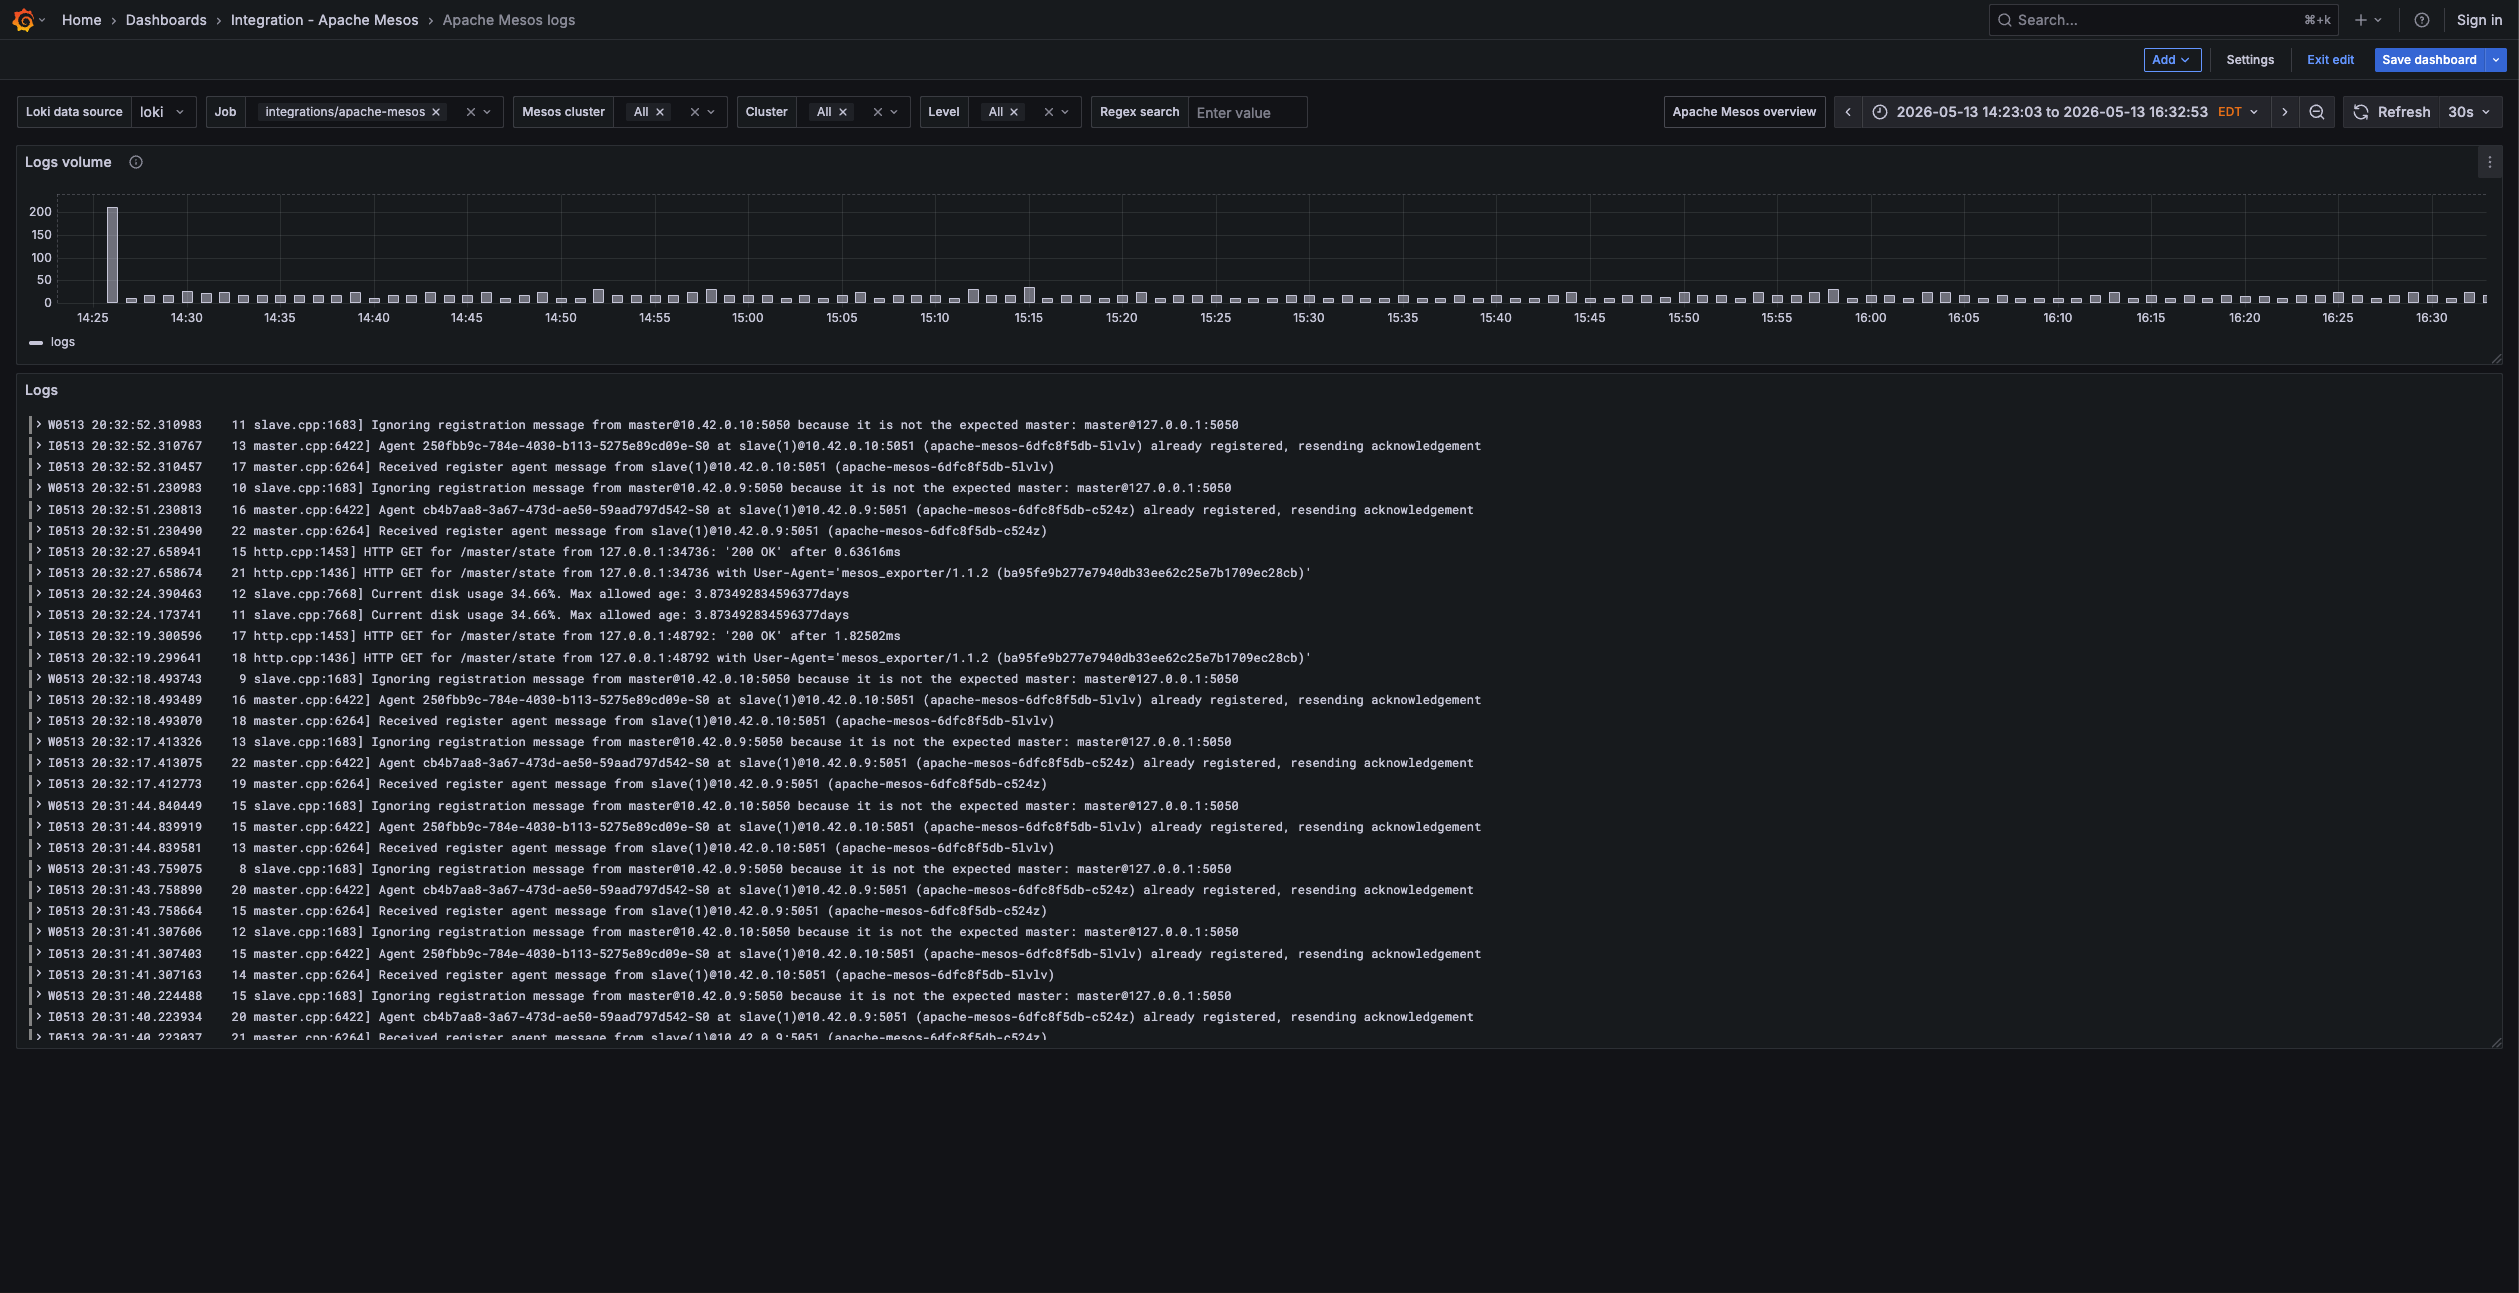
Apache Mesos logs dashboard
Alerts
The Apache Mesos integration includes the following useful alerts:
Metrics
The most important metrics provided by the Apache Mesos integration, which are used on the pre-built dashboards and Prometheus alerts, are as follows:
- mesos_master_allocation_run_latency_ms
- mesos_master_allocation_run_ms
- mesos_master_allocation_run_ms_count
- mesos_master_cpus
- mesos_master_disk
- mesos_master_elected
- mesos_master_event_queue_dispatches
- mesos_master_event_queue_length
- mesos_master_gpus
- mesos_master_mem
- mesos_master_messages
- mesos_master_slaves_state
- mesos_master_task_states_current
- mesos_master_uptime_seconds
- mesos_registrar_log_recovered
- mesos_registrar_state_fetch_ms
- mesos_registrar_state_store_ms
- mesos_slave_disk_bytes
- mesos_slave_disk_used_bytes
- mesos_slave_mem_bytes
- mesos_slave_mem_used_bytes
- up
Changelog
# 1.1.1 - June 2026

* Fixed issue with default filtering selectors

# 1.1.0 - June 2026

* Adds a dedicated Apache Mesos logs dashboard
* Updated dashboards to follow new stylistic standards

# 1.0.0 - July 2024
* Add Kubernetes as a supported platform using Grafana Alloy

# 0.0.3 - September 2023

* New Filter Metrics option for configuring the Grafana Agent, which saves on metrics cost by dropping any metric not used by this integration. Beware that anything custom built using metrics that are not on the snippet will stop working.
* New hostname relabel option, which applies the instance name you write on the text box to the Grafana Agent configuration snippets, making it easier and less error prone to configure this mandatory label.

# 0.0.2 - August 2023

* Add regex filter for logs datasource

# 0.0.1 - June 2023

* Initial release
Cost
By connecting your Apache Mesos instance to Grafana Cloud, you might incur charges. To view information on the number of active series that your Grafana Cloud account uses for metrics included in each Cloud tier, see Active series and dpm usage and Cloud tier pricing.


